Isolation and Characterization of Diosgenin, a Phytosterol Sapogenin from the Ethanolic Root Extract of Coleus forskohlii, and its Anti-ovarian Cancer Eefficacy on the SKOV-3 Cell Line
F. Virginia* , L. Cathrine, Sebin Fernandez, P. Pratheema, J. Morris Princey, A. Jerlin Philo, V. Mareeshwari, and S. Harithasakthi
Department of chemistry, Holy Cross College (Autonomous), Affiliated to Bharathidasan University, Tiruchirappalli, Tamilnadu.
Corresponding Author E-mail: virginiafrancis96@gmail.com
DOI : http://dx.doi.org/10.13005/ojc/400329
Article Received on : 02 May 2024
Article Accepted on : 14 Jun 2024
Article Published : 21 Jun 2024
Reviewed by: Dr. Imran Khan
Second Review by: Dr. Surendra Shukla
Final Approval by: Dr. Ioana Stanciu
The successful isolation and characterization of diosgenin from the roots of C. forskohlii was accomplished by a combination of multiple analytical methods, including HPTLC, HPLC, UV, FT-IR, NMR, and mass spectroscopy. The primary goal of this research was to quantify the anticancer capabilities of the human ovarian SKOV-3 cancer cell line. The acquired compound is persisted to the preparative TLC using ethyl acetate and methanol (70:30 v/v) as eluents. Maximum absorbance was reported in the UV-Vis spectrum at 232 nm. The presence of the functional group was subsequently established by a variety of peaks in the FT-IR spectra, including 3450.06, 2947.74, 1236.38, 1054.99, and 894.11 cm-1.Structural elucidation of diosgenin had been performed through spectrum analysis for instance 13C and 1H profoundly nuclear magnetic resources. The molecular formula C27H42O3 coincides with the parent molecular ion [M+] peak at m/z 414.63 g/mol, which is apparent in the mass spectra. The presently proceeding study's findings tend to show diosgenin has an astonishing cytotoxic action (IC50: 75.47µg/ml) on human ovarian cancer cells.
KEYWORDS:Coleus forskohlii; Diosgenin; Isolation; SKOV-3; spectral analysis
Download this article as:| Copy the following to cite this article: Virginia F, Cathrine L, Fernandez S, Pratheema P, Princey J. M, Philo A. J, Mareeshwari V, Harithasakthi S. Isolation and Characterization of Diosgenin, a Phytosterol Sapogenin from the Ethanolic Root Extract of Coleus forskohlii, and its Anti-ovarian Cancer Eefficacy on the SKOV-3 Cell Line. Orient J Chem 2024;40(3). |
| Copy the following to cite this URL: Virginia F, Cathrine L, Fernandez S, Pratheema P, Princey J. M, Philo A. J, Mareeshwari V, Harithasakthi S. Isolation and Characterization of Diosgenin, a Phytosterol Sapogenin from the Ethanolic Root Extract of Coleus forskohlii, and its Anti-ovarian Cancer Eefficacy on the SKOV-3 Cell Line. Orient J Chem 2024;40(3). Available from: https://bit.ly/45yZwqY |
Introduction
Cancer is alluded to as the uncontrolled proliferation of abnormal cells virtually anywhere in a body that may traverse normal body tissue, and it is one of the substantial lethal illnesses that equates to mortality globally1. The overwhelming number of cancer sorts with their peculiar histopathologies, genetic-epigenetic variations, and clinical manifestations affords persistent obstacles in deciphering the mechanism of action of chemotherapeutics and devising innovative rehabilitative techniques2,3.Ovarian cancer brutally impacts the human population as distinguished from other gynecological cancers globally. Novel interventions are rationally necessary to treat and prevent this devastating sickness. Because naturally-derived compounds are presumed to have fewer dangerous side effects than traditional treatments like chemotherapy, laser therapy, radiation therapy, gene therapy, hyperthermia, and surgery, they are becoming an emphasis of creative research scrutiny. Secondary metabolites generated by plants are under inquiry for the potential to deter ovarian cancer, which could result in the formulation of innovative therapeutic drugs4,5. Compounds developed from medicinal plants that have anti-ovarian cancer capabilities have been utilized as cornerstone medications for both prevention and treatment; new technologies are commencing to increase the scope of the industry. The biodiversity of high-value medicinal plants is in peril due to rising demand for pharmaceuticals manufactured from plants. Because they proficiently inhibit cancer cell lines, plant-derived anti-ovarian cancer therapies are in increasing demand6.
Diosgenin is a phytosterol sapogenin that emanates from isoprostane and is the end product of the hydrolysis of dioscin and protodioscin by acid or enzyme7. It has been touted as a significant antecedent to steroidal drugs. Diosgenin has emerged as steadily becoming more common than conventional synthetic drugs among researchers and industrialists worldwide because of its prospective advantages for treating a wide range of chronic conditions, including high level of cholesterol8, stroke9, diabetes10, cancer11, tumors, Alzheimer’s disease12, inflammation13, leukemia14, climacteric syndrome, depression, thrombosis15, and other metabolic disorders. The aforementioned secondary metabolite is prevalent in numerous genera of Dioscorea (Dioscoreaceae), Costus (Costaceae), Trigonella (Fabaceae), Smilax (Smilacaceae), Tribulus (Zygophyllaceae), Paris (Melanthiaceae), Aletris (Nartheciaceae), Trillium (Melanthiaceae)16 etc. Due to an expansive gamut of therapeutic characteristics, diosgenin has been scrutinized as an appropriate resource in the pharmaceutical sector’s current trend of exploiting bioactive lead molecules in the formulation of innovative medications. This essential industrial component is semi-synthetically employed to produce a variety of steroid-based medicinal products17. Researchers who employ diosgenin as a cure for numerous disorders are particularly interested in accumulating large quantities of it from natural sources18.
The Lamiaceae family spans the predominant medicinal plant Coleus forskohlii, which has a perpetual shaft and perennial roots. C. forskohlii constitutes a nurturing luscious that nurtures a gustatory impression resembling of oregano that is strong-smelling and camphor-like. Hailing in India, this plant is substantially disseminated across tropical and subtropical nations, encasing Brazil, China, Egypt, Ethiopia, Nepal, Pakistan, and Sri Lanka19. Considering C. forskohlii’s brownish-red tuberous roots are a substantial source of terpenoids, flavonoids, steroids, phenols, etc., that are prerequisites to the industry of pharmaceuticals. Beyond being a medicinal plant to its usage in treating gastrointestinal issues, psoriasis, glaucoma, asthma, eczema, hypertension, elevated liver, antiplatelet consolidation, along with tumor suppression, C. forskohlii additionally has applications as an antidepressant, antithrombotic, and cardio tonic (lowers blood and intraocular pressure)20. Furthermore, the principal objective of the current work geared to isolate, purify, and alongside characterize the phytosterol sapogenin (diosgenin) emanating from the tuberous roots with C. forskohlii employing chromatographic and spectroscopic techniques. It entails testing the compound’s anti-cancer specifications relying on its cytotoxic effects on human ovarian SKOV-3 cancer cells.
Materials and Methods
Collection of plant material
The tuberous roots belonging to Coleus forskohlii were procured in April 2023 from the Salem district (Latitude -11.6643°N, Longitude -78.146011°E and Altitude 278 m), Tamilnadu, India. The plant specimens have been detected, approved, and authenticated by Arulanandam, a director associated with the Rapinat Herbarium notably Centre for Molecular Systematics, St. Joseph’s College (Autonomous), Tiruchirappalli, Tamilnadu. The authorization specimen number seems F.V.001 (15.04.2023).
Preparation of ethanolic extracts
The C. forskohlii tuberous roots underwent sterilization under frigid running water, minced into tiny chunks, and eventually shade-dried to one month at 35–40°C. They were subsequently refined into a coarse powder with a 40-mesh dimension. A Soxhlet extraction has been employed to consistently immerse 1.5 kg of the dried pulverized plant powder in 1.5 L of ethanol for 10 hours to formulate the ethanol extracts21. To remove any unextractable material, such as cellular components and additional compounds that are consider impermeable in the extraction solvent, the resulting extracts underwent filtering through Whatman filter paper No. 42 (125mm). By employing a rotary evaporator at low pressure, the extract was concentrated until it was thoroughly desiccated. The final dried samples (876 g) have been mounted in sterile bottles with labels sealed and stored at -20°C22.
Fractionation by column and thin layer chromatography
TLC was the methodology of choice specified for the separation functioning and column chromatography was the method employed for the isolation from C. forskohlii tuberous roots23. Concerning chromatography, 10 g of the condensed desiccated ethanolic sample has been mounted on a column comprised of silica gel. After commencing the extraction together with 100% hexane, ethyl acetate, chloroform, ethanol, and methanol are added to further enhance the polarity. Close to a flow of 10 ml/min, 5 ml fractions were seized when each gradient of the mobile phase navigated down the column. Immediately following a TLC plate assessment of the acquired fractions, Rf values were evaluated concerning standards. 20 x 5 cm manually rendered TLC plates leveraging silica gel were applied for TLC to gaze over the eluted fractions. To apply greater quantities of the substance, the column fractions have been defined three times on TLC plates, 0.2 mm beneath the bottom line, by way of capillary tubes (5 µl). The freely moving mobile phase in the solvent solution occurred in a 1:1 combination of methanol and chloroform. To ensure a balance of solvent vaporization, an adequate amount of mobile phase was sprinkled into the chamber and left there for thirty minutes. Following ultraviolet lamps with a wavelength of 366 nm, bands with coloration and those without it emerged on the plate. The fractions emphasizing Rf values that were presumably equal to or seemingly equivalent to the standards were selected for structural identification. Rf value has been calculated relying on the below formula24:
Rf = Distance travelled by the solute ∕ Distance travelled by the solvent
Purification by High performance thin layer chromatography and High performance liquid chromatography
HPTLC analysis
The HPTLC evaluation of the retrieved compound from C. forskohlii roots was executed attributed to the prescriptions, with a few slight alterations. Solubilizing 0.1 g of standard diosgenin in ethanol resulted in the stock solutions. An assortment of concentrations ranging from 5µl to 20µl had been developed leveraging the stock solution. For the HPTLC inquiry, aluminum TLC plates (20 × 10 cm) were pre-coated beneath a 0.2 mm layer of silica gel (60 F254 by SRL Chemicals, India). The silica-coated plate has been processed with the standard and the isolated naturally active compound integrating an automated TLC sample for HPTLC analysis. Toluene, ethyl acetate, and methanol seemed pre-saturated in the twin chamber’s mobile phase for 15 minutes after plate development in a ratio of 16:2:2 (v/v/v). Afterward, the plate was patted dry after being scanned at 366 nm25. The split zones were apparent using the newly generated Liebermann Burchard reagent after the partitioned zones underwent heating for ten minutes at 100°C. By sustaining the plate in the CAMAG Reprostar 3 photo-documentation chamber, we were able to reclaim the resolution bands and compute the retention factor (Rf)26.
HPLC analysis
A diode matrix detector, 20µl looping process, 200 x 4.6 mm C18 column, along with methanol (HPLC grade, 0.2 mm filtered) constitute the experimental HPLC system created by Shimadzu. By harnessing a mobile phase assembled by methanol and acetonitrile (2:8 v/v) with an ostensible flow scale rate of 1.0 ml/min within a column temperature set at 30°C, the isolated diosgenin compound was segregated27. At 230 nm, detection was attempted using an injection volume of 40 μl.
Structural elucidation of the isolated compound
An assortment of spectroscopic probes had been performed on the isolated compound, notably Mass studies, 1H NMR, 13C NMR, FT-IR, and UV-visible studies, to acquire insight into its structure and physical properties. At room temperature, a Shimadzu spectrophotometer was calibrated to record the UV-visible spectrum of the isolated compound. The absolute maximum wavelength revealed by the ensuing absorption spectra was recorded in nanometers28. A UV-visible spectrum of the purified compound was acquired by the use of ethanol as a solvent. Regarding the wavelength ranging from 200 to 800 nm, the ultraviolet spectra were recorded29. In accordance with the existence of diverse functional groups, the FTIR spectrum assists in the identification of substances30,31. An FTIR spectrometer that was hooked up to the OPUS operating system’s software was employed to establish the spectrum. KBr pellets had been working to create the sample in a hydraulic pellet press. The sample platter was then scanned between 4000 and 400 cm-1.
Bruker WP 200 SY and AM 200 SY instruments were utilized to acquire 1H and 13C NMR spectra. To formulate a solution for nuclear magnetic resonance analysis, 5–10 mg of a pure, desiccated substance was suspended in 2 ml of deuterated chloroform/DMSO (Merck). TMS emerged as an internal standard. After being set inside a plastic spinner, the sample was dumped into a glass tube. Samples are loaded into the magnet in the rotator, and chemical changes are tracked in parts per million32,33. Exploiting 1H NMR and 13C NMR, the compounds’ hydrogen and carbon atom arrangements are ascertained. Mass spectrometry is a beneficial analytical strategy for detecting the structure and chemical characteristics of molecules as well as for identifying and quantifying known and newly discovered chemicals. The molecular weight and fragmentation of the material may be scrutinized using the MS spectra. The methodology for analysis was constructed with both GC and MS in mind. A Perkin-Elmer GC Clarus 500 equipment along with a gas chromatograph grasped up towards a mass spectrometer (GC-MS) correlated through a certain Elite-I bonded silica capillary gradient (30 mm × 0.25 mm, 1D x 1 μMdf, generated completely as dimethyl poly siloxane) was adopted for assessing the isolated compound using GC-MS34.
Anti-ovarian cancer efficacy of the isolated diosgenin
Cell culture and anti-cancer evaluation
Human ovarian cancer cell line SKOV-3 originally emerged by the National Centre for Cell Sciences (NCCS) in Pune, India. It had been subsequently propagated on Dulbecco’s modified Eagles medium (DMEM) (Sigma Aldrich, USA). Cells had been nurtured through a 25 cm2 tissue culture vial from Merck in Germany in an antibiotic solution that encompassed penicillin (100 U/ml), streptomycin (100 μg/ml), also amphotericin B (2.5 μg/ml), in addition to DMEM supplemented over 10% FBS, L-glutamine, along with sodium bicarbonate. A humidified 5% CO2 incubator from NBS Eppendorf, Germany, retained the cultured cell lines at 37°C. Cells barely two days old were trypsinized followed by being suspended beneath a 10% growth medium to accumulate convergent monolayers. The accord entailed seeding a 96-well tissue culture plate together with 100µl of cell suspension (5×10³cells/well) prior to incubating it upon 37°C underneath a humidified 5% CO2 incubator35.
The growing medium had been discarded shortly after 24 hours. In a humidified 5% CO2 incubator, 100µl of each concentration was randomly distributed amongst the optimal aquifers and left to incubate at 37°C. The isolated diosgenin in DMEM was serially diluted five times by a two-fold dilution (6.25 to 100 μg/ml concentrations in DMEM)36. Additionally, untreated control cells were retained.
Anti-cancer efficacy by MTT assay
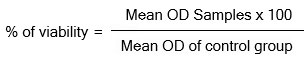
15 milligrams of MTT (Sigma, M-5655) had been reconstituted over 3 milliliters of PBS, agitated well, and scrutinized to remove any residual contaminants. Following the incubation period of 24 hours, 30 µl of reconstituted MTT solution was added to each test well in conjunction with the control-cell well and the sample was subsequently expunged from each well. The plate proved correctly agitated delicately before being incubated for four hours starting at 37°C in an appropriately humidified 5% CO2 incubator. The incubation time was terminated once the supernatant had been removed, and 100µl of MTT Solubilization Solution (Dimethyl Sulfoxide, DMSO, Sigma Aldrich, and USA) was injected. The next step was to meticulously amalgamate the formazan crystals by pipetting them up and down the wells. The absorbance measurements were taken using a microplate reader that employs at 540 nm. The anticancer efficacy of the isolated diosgenin was quantified using the IC50 value, which was computed from a plot incorporating numerous sample concentrations versus percentages of viability37. The percentage of growth inhibition has been predicted by applying the formula:
Results and Discussions
Isolation of diosgenin by Column chromatography
The sample’s condensed ethanol extract (876 g) was infused by tapping into column chromatography on TLC-grade silica gel. Increasing the concentration of ethyl acetate in n-hexane facilitated the development of several fractions during column elution with n-hexane and methanol, correspondingly. After obtaining roughly eighteen fractions, the fractions were collected into 100 ml beakers. The ethyl acetate: methanol (70:30 v/v), a phytosterol sapogenin also called as diosgenin (424mg/876g)38 were extracted from fraction 13 by solvent systems preparation (Fig. 1a). After column separation, TLC plates showed the presence of many ethanolic extract samples; nevertheless, the Rf of fraction 13, which was consistent with that of standard diosgenin, was 0.43. The pale yellow color of the spots was found to be reminiscent of diosgenin (Fig. 1b).
 |
Figure 1: Separation along with identification of diosgenin. a. Column chromatography of C. forskohlii ethanol extract. b. TLC plate of column fraction 13 under UV λ= 366 nm. |
Determination of the physical properties of the diosgenin
Diosgenin is designated by its chemical name, (25R)-Spirost-5-en-3β-ol. Despite its array of names, this compound is additionally known as diosgenine and nitogenin. The formula for its molecular weight is 414.63 g/mol, as well as its chemical formula is C27H42O3. Physical parameters, such as solubility and melting points, tend to be employed for compound identification39,40. To ascertain the nature of a molecule and perceive its functional groups by solubility categorization, solubility tests are frequently carried out. It became apparent that the isolated diosgenin was a light yellow to pale yellow color granular substance that was virtually insoluble in water, easily soluble in ethyl acetate, dimethylformamide, and chloroform, and merely partially soluble in methanol and ethanol. The compound’s melting point was assessed to be 204 to 207°C.
Purification of isolated diosgenin by HPTLC
Since HPTLC fingerprint patterns are being acquired to independently verify the legitimacy on the isolated component in the ethanolic extract residing in the sample. Diosgenin was quantified using HPTLC from the roots of C. forskohlii ethanol extracted fraction (F-13). HPTLC scanning at 366 nm was executed to ensure the existence of diosgenin, plus the outcomes are depicted in Fig. 2c. The densitometric HPTLC chromatogram of separated diosgenin and standard is illustrated in Fig. 2a-2b. Table 1 highlights how the HPTLC chromatogram was applied to quantify the isolated and designated standard diosgenin41.
 |
Figure 2: a-b. Densitometry HPTLC chromatogram of standard diosgenin and isolated diosgenin. |
Table 1: HPTLC results of standard and isolated diosgenin
|
Track |
Start Rf |
Start height |
Max Rf |
Height % |
End Rf |
End height |
Area |
Area % |
Assigned substance |
|
1 |
0.43 |
0.1 |
0.53 |
100.00 |
0.55 |
2.4 |
24338.9 |
100.00 |
Diosgenin |
|
2 |
0.43 |
0.3 |
0.52 |
100.00 |
0.56 |
0.6 |
24178.3 |
100.00 |
Diosgenin |
Purification of diosgenin by HPLC
The high-performance liquid chromatography (HPLC) peak in Figure 3 clearly shows the retention duration of diosgenin that was separated by the ethanolic extract prepared from C. forskohlii roots took approximately 2.742 minutes42.
 |
Figure 3: HPLC spectrum of diosgenin. |
UV-Visible spectroscopy
Considering the peak and baseline were clearly stated the UV-Vis profiling of the isolated diosgenin was acquired between 200 and 800 nm in wavelength. In Fig. 4, a strong peak has been perceived at 232 nm43.
 |
Figure 4: UV- Visible spectrum of diosgenin |
Fourier transforms Infrared spectroscopy
IR: (KBr) Vmas: Major peaks have been encountered in the diosgenin’s IR spectroscopic evaluation at the absorption bands at 3450.06 cm-1 (O-H stretching), 2947.74 cm-1 (C-H stretching due to CH3), 2836.11 cm-1 (C-H stretching due to CH2 group), 1453.07 cm-1 (C-O group of scissoring vibration), 1369.35 cm-1 (CH2 bending stretching), 1236.38 cm-1 (C-O-C stretching), 1160.05 cm-1 and 1054.99 cm-1 attributed to (C-O stretching vibration), 977.83 cm-1 and 894.11 cm-1 corresponds to a CH2 twist44 in Fig.5.
 |
Figure 5: FT-IR spectrum of diosgenin. |
1H NMR
The isolated compound-diosgenin, depicted in Figure 6, endured 42 ‘H’ atoms in their proton NMR spectrum. Hydrogen atom’s locations in the compounds are apparent by the 1H NMR peaks that are discernible at different concentrations (ppm). 1H NMR (400MHz, DMSO- d6): δ5.15 (1H, s, OH), δ3.76 (1H, m, CH-OH), δ3.46 (1H, s, =CH), δ3.45 (2H, dd, J=9.20, 7.20 Hz, CH2), δ2.13 (1H, s, CH-CH3), δ2.12 (2H, m, CH2), δ1.50 – δ1.90 (16H, m, 8CH2), δ1.23 – δ1.58 (6H, m, CH), δ0.72 – δ1.16 (12H, m, 4CH3)45.
 |
Figure 6: 1H NMR spectrum of diosgenin |
13C NMR
The spectral analysis data of the carbon NMR spectra pointed out that there were 27 ‘C’ atoms in the specified compound-diosgenin portrayed in Fig. 7. The precise positions of the carbon atoms in the compounds are conveyed by the 13C NMR peaks that are discernible at varying concentrations (ppm). The resulting δC values have been identified in the diosgenin 13C NMR spectrum: δ38.77 (C-1), δ30.60 (C-2), δ70.71 (C-3), δ42.26 (C-4), δ139.78 (C-5), δ120.40 (C-6), δ31.03 (C-7), δ30.37 (C-8), δ49.04 (C-9), δ36.21 (C-10), δ19.86 (C-11), δ39.25 (C-12), δ40.59 (C-13), δ55.50 (C-14), δ30.83 (C-15), δ79.81 (C-16), δ61.08 (C-17), δ15.27 (C-18), δ18.40 (C-19), δ41.26 (C-20), δ13.50 (C-21), δ108.28 (C-22), δ30.43 (C-23), δ27.78 (C-24), δ29.28 (C-25), δ65.83 (C-26), and δ16.11 (C-27)46.
 |
Figure 7: 13C NMR spectrum of diosgenin |
Mass spectral studies
A parent molecular ion [M+] peak underneath m/z 414.63 g/mol, which appears reminiscent of the molecular formula C27H42O3, was spotted in the mass spectra of the isolated compound diosgenin. The aforementioned substances were separated, and the GC-MS spectra stated peculiar fragments with the following percentage abundances47: 415.32, 397.31, 392.79, 362.24, 359.25, 355.28, 324.80, 322.81, 301.14, 283.23, 261.12, 253.19, 249.15, 227.12, 216.92, 206.89, 194.11, 192.13, 178.12, 158.09, 135.04, 133.06, 124.08, and 118.06. As confirmed in Fig.8, the compounds portray diosgenin under their respective molecular weight and fragmentation pattern.
 |
Figure 8: Mass spectrum of diosgenin. |
Anti-ovarian cancer activity of isolated diosgenin
The MTT approach is employed to evaluate the human ovarian cancer cell line for anti-cancer capabilities. The quantities of alive cells are measured by calculating the absorbance of the living cells employing this experiment. The amount of formazan accomplished in the SKOV-3 cells using MTT was used for predicting the percentage of cell viability. MTT can only be converted into formazan by conduct them, or living, SKOV-3 cells with an active metabolism. The color changes aided in forecasting the number of surviving SKOV-3 (ovarian cancer) cells whilst cancer cells lose this capacity to convert when they die. Table 2 exhibits the absorbance values of the sample and the control. The absorbance column makes it prominent that the control had the greatest absorbance value; as the diosgenin concentration increased, the absorbance value fell, implying that as the sample concentration increased, fewer live SKOV-3 cells were present. From 0.4959 to 0.2399 was a decrease in absorbance value. Table 2 and Chart 1 reveal the cell viability of the control and sample, which were calculated based on those data. Figure 9 indicates indisputably that the cell viability percentage declined from 100% to 45.87% as the diosgenin concentration dose. Based on the concentration vs. cell viability graph, the IC50 value is obtained48,49. A lower IC50 value suggests greater ovarian cancer activity. The IC50 value focuses on the percentage of cancer cells slaughtered by the sample (IC50 = 50%). It was discovered that the isolated diosgenin had an IC50 of 75.47 µg/ml. (Calculated using ED50 PLUS V1.0 Software)
Table 2: Absorbance value and cell viability percentage of anti-ovarian cancer activity of isolated diosgenin.
|
S.No |
Tested sample concentration (µg/ml)
|
OD values at 540 nm (in triplicates) |
Average absorbance @540 nm |
Cell viability % (in triplicates) |
Average Percentage viability |
||||
|
OD I |
OD II |
OD III |
CV I |
CV II |
CV III |
||||
|
1 |
Control |
0.4944 |
0.505 |
0.4884 |
0.4959 |
100 |
100 |
100 |
100 |
|
2 |
6.25 |
0.3733 |
0.3801 |
0.3854 |
0.3796 |
84.7322 |
83.0693 |
84.3857 |
84.0624 |
|
3 |
12.5 |
0.3510 |
0.3519 |
0.3524 |
0.3518 |
76.2217 |
75.4851 |
76.629 |
76.1119 |
|
4 |
25 |
0.3202 |
0.3195 |
0.3185 |
0.3194 |
63.9919 |
62.0693 |
62.688 |
62.9164 |
|
5 |
50 |
0.2761 |
0.2828 |
0.2754 |
0.2781 |
52.1173 |
53.802 |
53.9582 |
53.2925 |
|
6 |
100 |
0.2382 |
0.2428 |
0.2387 |
0.2399 |
46.4061 |
45.8812 |
45.3489 |
45.8787 |
 |
Chart 1: Cell viability percentage of anti-ovarian (SKOV-3) cancer activity of isolated diosgenin. |
 |
Figure 9: Images of cell viability percentage of anti-ovarian (SKOV-3) cancer activity of isolated diosgenin. |
Discussions
Sapogenins originate from the aglycones of saponins, a substantial class of natural compounds. Sapogenins embrace steroid or other triterpene frameworks as their principal organic distinctive. Diosgenin, a phytosterol sapogenin, was isolated and acknowledged for the first time from the ethanolic root extract of Coleus forskohlii deploying chromatographic methodologies. Diosgenin – (25R)-Spirost-5-en-3β-ol is a bioactive compound extracted from several medicinal plants and has been implied to have robust pharmacological capabilities. The conceived HPTLC methodology for the measurement of the aforementioned diosgenin compound is intuitive, precise, reliable, dependent, and accurate. The compound revealed the signal in UV spectra featuring a λmax value of 232 nm, respectively. The FT-IR peak at 3450.06 cm-1 depicts the OH stretching-related absorption. Stretching vibrations are symbolized by the peak at 2947.74 cm-1, which could allude to the presence of a CH3 group. Stretching vibrations originate at the peak at 2836.11 cm-1, which would imply the presence of a CH2 group. The scissoring vibration’s C-O group vibration correlates with the peak at 1453.07 cm-1. The C-O-C stretching is evident by the peak at 1236.38 cm-1. It becomes obvious that the C-O group is expanding vibrational by the peaks at 1160.05 and 1054.99 cm-1. It is discernible in the peak at 977.83 and 894.11 cm-1 that the cycloalkane moiety has a CH2 twist.
In 1NMR analysis, the OH proton of the hydroxyl moiety is encoded by the singlet signal at δ 5.15 ppm. The multiple peaks at δ 3.76 ppm exemplify the presence of the CH-OH proton. During singlet splitting, a vinylic proton is present as disclosed by the signal at δ 3.46 ppm. Methylene proton substantiation is supplied by the peak at δ 3.45 ppm at doublet of doublet splitting. The presence of methylene protons can be evidenced by the multiple-split peak at δ 2.12 ppm. With multiplet splitting, the cyclohexane moiety’s eight methylene protons correspond to δ 1.50–1.90 ppm. Six CH protons seem to be extant by the multiplet signal at 1.23–1.58 ppm. Four methyl protons can be confirmed to be present by the multiple peaks between δ 0.72 to 1.16 ppm, correspondingly. A parent molecular ion [M+] peak at 415 g/mol m/z, which resonates with the molecular formula C27H42O3, emerged in the diosgenin mass spectrum. These allocations align closely with the structure of Diosgenin. The SKOV-3 cell lines were employed in the microculture tetrazolium (MTT) assay to gauge the cytotoxicity of the herbal composition. The outcomes of the current research tend to imply that diosgenin has a sizable cytotoxic impact on human ovarian cancer cells (IC50: 75.47 µg/ml). The article presents conclusive evidence that diosgenin is a promising compound that should be sought further in the quest for an anticancer medication.
Conclusion
The field of medicine is progressively placing a greater emphasis on plant sources due to the discovery and extraction of novel bioactive compounds. The aforementioned physical, chemical, and spectral data collectively indicate that the compound isolated from the ethanolic root extract of Coleus forskohlii is diosgenin. This phytosterol compound from this plant has never previously been documented. This article presents persuasive evidence that suggests diosgenin should be further studied in the development of an anticancer drug. The ever-increasing numbers of new cancer cases globally emphasize the need for safer and more effective cancer therapies, which might be accomplished via the identification and characterization of novel anticancer pharmaceuticals derived from naturally occurring compounds.
Acknowledgement
F.Virginia encompasses gratefulness to Dr. L. Cathrine, an assistant professor (SG) presently at Holy Cross College (Autonomous) in Tiruchirapalli, Tamil Nadu, for her consistent encouragement of this endeavor.
Conflict of Interest
There is no conflict of interest.
Data availability
The authors do not have permission to share data.
Declaration of competing Interest
The authors of this work completely condemn any competing interests. It hasn’t been released anywhere else. It has not been simultaneously submitted for publication in another journal. All writers consent by submitting their work to the journal.
Author Contribution
Each author imparted an equal participation in the manuscript.
References
- Yahya, E. B.; Alqadhi, A. M. Life Sciences. 2021, 269, 119087.
CrossRef - Bukowski, K.; Kciuk, M.; Kontek, R. International journal of molecular sciences. 2000, 21(9), 3233.
CrossRef - Cao, M.; Li, H.; Sun, D.; Chen, W. (2020). Cancer Communications. 2000, 40(5), 205-210.
CrossRef - Stewart, C.; Ralyea, C.; Lockwood, S. In Seminars in oncology nursing. 2019, 35(2), 151-156.
CrossRef - Ranjan, A.; Ramachandran, S.; Gupta, N.; Kaushik, I.; Wright, S.; Srivastava, S.; Srivastava, S.K. International journal of molecular sciences. 2019, 20(20), 4981.
CrossRef - Lu, Z.; Gao, Z.; Song, H.; Zhou, Y.; Yuan, W.; Wang, X.; Chang, C. Chemistry & Biodiversity. 2023, 20(7), e202300086.
CrossRef - Shahrajabian, M. H.; Sun, W.; Shen, H.; Cheng, Q. Pharmacognosy Communications. 2021, 11(1), 26-30.
CrossRef - Zhang, Y.; Tang, L.; An, X.; Fu, E.; Ma, C. Biochemical Engineering Journal. 2009, 47(1-3), 80-86.
CrossRef - Chaudhary, S.; Chaudhary, P. S.; Chikara, S. K.; Sharma, M. C.; Iriti, M. Notulae Botanicae Horti Agrobotanici Cluj-Napoca. 2018, 46(1), 22-31.
CrossRef - Arya, P.; Kumar, P. Journal of Food Biochemistry. 2022, 46(12), e14390.
CrossRef - Arya, P.; Kumar, P. Journal of Food Biochemistry. 2021, 45(12), e14005.
CrossRef - Cai, B.; Zhang, Y.; Wang, Z.; Xu, D.; Jia, Y.; Guan, Y.; Li, J. Oxidative medicine and cellular longevity. 2020.
CrossRef - Patel, K.; Gadewar, M.; Tahilyani, V.; Patel, D. K. Natural products and bioprospecting. 2012, 2, 46-52.
CrossRef - Gong, G.; Qin, Y.; Huang, W. Phytomedicine. 2011, 18(6), 458-463.
CrossRef - Liu, L.; Dong, Y. S.; Qi, S. S.; Wang, H.; Xiu, Z. L. Applied microbiology and biotechnology. 2010, 85, 933-940.
CrossRef - Jesus, M.; Martins, A. P.; Gallardo, E.; Silvestre, S. Journal of analytical methods in chemistry, 2016.
CrossRef - Huang, B.; Du, D.; Zhang, R.; Wu, X.; Xing, Z.; He, Y.; Huang, W. Bioorganic & medicinal chemistry letters. 2012, 22(24), 7330-7334.
CrossRef - Arya, P.; Munshi, M.; Kumar, P. Food Chemistry Advances. 2023, 2, 100170.
CrossRef - Khan B. A.; Akhtar N.; Anwar M.; Mahmood T.; Khan H.; Hussain I.; Khan K. A. Journal of Medicinal Plants Research. 2012, 6(34), 4832-4835.
- Alasbahi R. H.; Melzig, M. F. Planta medica. 2010, 76(07), 653-661.
CrossRef - Nivetha, A.; Stella, P. R.; Scleeva, P. I.; Keertha, D. Moroccan Journal of Chemistry. 2023, 11(04), 11-4.
CrossRef - Mir M. A.; Ashraf M. W.; Mir B. A. Trends in Biomaterials & Artificial Organs. 2021, 35(1), 65-69.
- Shaker K. H.; Yonus M. A.; Ibrahim M. A.; Kilany M.; Wiggers F. Current Bioactive Compounds. 2022, 18(1), 68-73.
CrossRef - Ciura K.; Dziomba S.; Nowakowska J.; Markuszewski M. J. Journal of Chromatography A. 2017, 1520, 9-22.
CrossRef - Rana P. S.; Saklani P.; Chandel C. Plant Biosystems-An International Journal Dealing with all Aspects of Plant Biology. 2022, 156(2), 323-329.
CrossRef - Takale N.; Wadibhasme S.; Ghule B.; Kotagale N. JPC–Journal of Planar Chromatography–Modern TLC. 2023, 1-10.
CrossRef - Wang L.; Hu Y.; Guo G.; Li J.; Fang X.; Zhao L. Biomass Conversion and Biorefinery. 2022, 1-11.
CrossRef - Ivanovic, M.; Islamcevic Razborsek, M.; Kolar, M. Plants. 2020, 9(11), 1428.
CrossRef - Pratiwi, R. A.; Nandiyanto, A. B. D. Indonesian Journal of Educational Research and Technology. 2022, 2(1), 1-20.
CrossRef - Gurning, K.; Haryadi, W.; Sastrohamidjojo, H. Rasayan Journal Chemistry. 2021, 14(1), 248-253.
CrossRef - Nisha, P.; John, N.; Mamatha, C.; Thomas, M. Materials Today: Proceedings. 2020, 25, 257-264.
CrossRef - Erdagi, S. I.; Yildiz, U. Journal of Molecular Structure. 2022, 1256, 132511.
CrossRef - Sharma, V.; Janmeda, P. Arabian Journal of chemistry. 2017, 10(4), 509-514.
CrossRef - Micalizzi G.; Alibrando F.; Vento F.; Trovato E.; Zoccali M.; Guarnaccia P.; Mondello L. Molecules. 2021, 26(6), 1588.
CrossRef - Babu V. S.; Radhamany P. M.; Surumi B.; Nair A. J. Steroids. 2023, 198(109270).
CrossRef - Yi, J.; Lin, Y.; Yicong, W.; Chengyan, L.; Shulin, Z.; Wenjun, C. Archives of Gynecology and Obstetrics. 2020, 302, 1009-1017.
CrossRef - Jerard C.; Michael B. P.; Chenicheri S.; Vijayakumar N.; Ramachandran R. Proceedings of the National Academy of Sciences, India Section B: Biological Sciences. 2020, 90, 515-522.
CrossRef - Aminkar, S.; Shojaeiyan, A.; Rashidi Monfared, S.; Ayyari, M. International Journal of Horticultural Science and Technology. 2018, 5(1), 103-109.
- Jesus, M.; Martins, A. P.; Gallardo, E.; Silvestre, S. Journal of analytical methods in chemistry. 2016.
CrossRef - Moodley, K.; Rarey, J.; Ramjugernath, D. The Journal of Chemical Thermodynamics. 2017, 106, 199-207.
CrossRef - Kharat, S. N.; Singh, R.; Mendhulkar, V. D. Der Pharmacia Lettre. 2015, 7(5), 236-244.
- Chavan, A. K.; Tatiya, A. U. Asian Journal of Pharmaceutical Research and Health Care. 2024, 16(1), 15-23.
CrossRef - Yi, T.; Fan, L. L.; Chen, H. L.; Zhu, G. Y.; Suen, H. M.; Tang, Y. N.; Chen, H. B. BMC biochemistry. 2014, 15, 1-6.
CrossRef - Erdagi, S. I.; Yildiz, U. New Journal of Chemistry. 2019, 43(17), 6622-6635.
CrossRef - Han, X. W.; Yu, H.; Liu, X. M.; Bao, X.; Yu, B.; Li, C.; Hui, Y. Z. Magnetic resonance in chemistry. 1999, 37(2), 140-144.
CrossRef - Xu, L.; Liu, Y.; Wang, T.; Qi, Y.; Han, X.; Xu, Y.; Tang, X. Journal of Chromatography B. 2009, 877(14-15), 1530-1536.
CrossRef - Chou, J. C.; Li, J. H.; Chen, C. C.; Chen, C. W.; Lin, H.; Wang, P. S. Integrative Cancer Therapies. 2021, 20, 15347354211002662.
CrossRef - Hanachi, P.; Fakhrnezhad, F. R.; Zarringhalami, R.; Orhan, I. E. International Journal of Cancer Management. 2021, 14(3).
CrossRef

This work is licensed under a Creative Commons Attribution 4.0 International License.
About The Author
![]()
A New Edition of Web of Science
Journal Impact Factor
2022: 0.5
Five Year: 0.8
Journal is Indexed in

Cabells Whitelist
![]()


