Finerenone API Estimation Using RP-HPLC Technique and LC-MS Characterization of its Degradation Products
 and Dinesh Rishipathak
Department of Pharmaceutical Chemistry, MET’s Institute of Pharmacy, Adgaon, Nashik, Maharashtra, India.
Corresponding Author E-mail: phdkps25@gmail.com
DOI : http://dx.doi.org/10.13005/ojc/410222
Download this article as:
![]()
Researchers developed an RP-HPLC method to measure finerenone (FIN) which exhibits specificity, accuracy, precision and sensitivity. The RP-HPLC instrument functioned through an Isocratic method using a 250 mm X 4.6 mm i.d., 5μm i.d. Phenomenex C18 reversed-phase column as its component. At 252 nm wavelength the detector selected Acetonitrile: water (50:50 v/v) for operation in its analytical procedures using the mobile phase. The programmed mobile phase moved at 1mL/min through the system. The time for FIN to retain in the system under examination amounting to 4.62. Between 80–120 μg/mL concentrations the method demonstrated linear performance with an r2 correlation coefficient value of 0.99995. Laboratory tests determined the quantitation limit at 1.634 and detection limit at 0.539 for the examined drug. All tests described in ICH Q2 (R1) guidelines were successfully completed by the analytical method. The analysis of degraded samples underwent enforced deterioration tests to identify potential degradation methods. The time it took for pure and deteriorated product drug peaks to elute differed significantly enough to enable separation between them. Studies demonstrated how the drug reacted negatively to all peroxide and acid and base hydrolysis processes. The process of mass spectral analysis determined the m/z values for the important degradation products. This developed analytical method provides suitable capabilities for stability analysis and regular quality control testing of FIN products.
KEYWORDS:Finerenone; Forced degradation; Mineralocorticoid receptor antagonist; RP-HPLC; Validation
Introduction
The BCS Class II classification describes Finerenone because it demonstrates low solubility but high permeability. The medicine called finerenone exists within a temperature range of 211-218oC and possesses molecular weight of 378 gm/mol. As an MRA medication the pharmaceutical compound (S)-4-(3-cyano-5-methoxyphenyl)-5-ethoxy-2,8-dimethyl-1,4-dihydro-1,6-naphthyridine-3-carboxamide treats Chronic Kidney Disease (CKD) in Type 2 Diabetes Mellitus (T2DM) patients.[1-2] Through its mechanism of action the substance prevents the production of hormones which normally lead to tissue damage in kidneys and heart components. Finerenone functions as a selective antagonist for mineralocorticoid receptor (MR) thus inhibiting adrenal gland hormone cortisol and adrenaline for gene transcription activity. The elevated presence of MR in the body results in inflammatory reactions and fibrosis formation. The therapy maintains control of both MR expression together with sodium reuptake activities in kidney epithelial cells as well as heart and blood vessel tissues.[3]
Few documented bioanalytical methods and few stability-adapted RP-HPLC measurements exist for finerenone in API or raw material according to a detailed literature review [4].
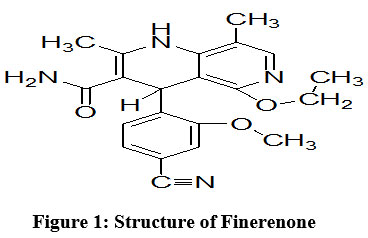 |
Figure 1: Structure of Finerenone |
The quality assessment of finerenone as both pure drug substance and pharmaceutical tablets utilized a spectrophotometric analytical method developed in literature studies. The authors performed no stability tests in their work.[5] The research by Imran SJ et al. determined FIN quantitation through RP-HPLC methods. Findings from force degradation studies established that peroxide and acid conditions independently heightened the deterioration of finerenone substance within tablets.[6]
Scientists at Arulselvan Murugesan et al. created an RP-HPLC method to study finerenone degradation by forced degradation studies. The researchers applied acidic, alkaline, oxidative, photolytic and thermal tests to FIN substance and it showed degradation in all examined environments.[7] The analyzed laboratory verified that RP-HPLC methodology meets requirements for measuring finerenone concentrations within bulk pharmaceutical products and commercial drugs. The researcher tested FIN under basic and thermal conditions and found it to be susceptible.[8]
Also, Forced degradation investigations were conducted by exposing finerenone to different stress conditions by Jyothi Mirjapuram et al. Here, Acid and basic solutions as well as UV light dissolve FIN and oxidation attacks the substance while thermal conditions make it vulnerable to change.[9]
A small number of the aforementioned reports lacked stability analyses. Furthermore, the identification and characterisation of degradation products have not been studied. Development goals focused on creating a precise and easy-to-use RP-HPLC analytical method which used mass spectrometry to identify degradation products and forced degradation testing to identify degradation products.
Materials and Methods
Instruments and Equipment
OpenLab EZ Chrome and OpenLab software programs enable the operation of Agilent 1260 Infinity II HPLC with its built-in UV detector and PDA detector. The Detection equipment functions through Jasco UV 550 Double Beam UV-Visible Spectrophotometer controlled by Spectra Manager software as its control system. The operations of weighing and sonication took place when the Aczet CY 224C Analytical Balance operated together with the Bio-technic Ultra -Sonicator.
Materials
Agents collected from Dr. Reddy’s Laboratories in Hyderabad India underwent analysis at digital HPLC through the use of HPLC grade water and acetonitrile from Siddhi Lab and methanol from Merck.
Methods
Chromatographic condition
The Agilent Infinity II 1260 instrument with the attached Phenomenex C18 column of dimensions (250 mm × 4.6 mm, 5 µm) used 50:50 v/v acetonitrile-water mobile phase for analysis. System stability was reached by the analytical instrument as it prepared to run tests under operating conditions which included a 252 nm UV detector and 1 mL/min flow rate. The run duration for fifteen minutes took place with the column oven functioning at 40 degrees Celsius.
Preparation of Stock Solution and wavelength selection
Stock solution preparation
A volumetric flask with 20mL volume received 10 mg of FIN as the solution absorbed 15 mL methanol. The medicine required 15 mL of methanol for sonication to dissolve. The researcher diluted the solution by adding methanol until the standard volume reached 500 μg/mL of stock solution concentration.
Solution for UV scan
A FIN stock solution at 500 μg/mL was diluted using 0.8 mL for the preparation of a 20 mL solution with methanol reaching 20 μg/mL FIN. The FIN medication solution together with methanol required analysis from 400 nm to 200 nm.
Validation
There has been a lot of focus in the field of pharmaceutical analysis on developing analytical techniques for drug identification, purity assessment, and quantification.[10]
According to ICH Q2 (R1), the recommended HPLC approach was evaluated for several parameters that included linearity, specificity, accuracy, precision, intermediate precision, robustness and system appropriateness.11
System suitability
The system suitability testing required creation of 100 μg/mL standard stock solution. Researchers performed five identical solution injections which enabled them to determine percentage relative standard deviation and theoretical plates in order to assess asymmetry.
Solution stability
The researchers measured this experiment at three time points starting with 0 hours followed by 12 hours and ending at 24 hours to determine the percent absolute change.
Specificity
In order to ensure specificity, the standard solution and the blank were injected together to determine whether the blank was interfering with the FIN during its retention period. The standard solution was also injected to ensure the FIN was at its peak purity.
Linearity
For the purpose of studying linearity, five working solution levels between 80 and 120 percent were developed. Slope, intercept, and correlation coefficient values were calculated after plotting a linearity graph.
Accuracy
The accuracy evaluation included three design parameters which were set at 80%, 100% and 120%. Preparations occurred at three different stages through the generation of three duplicate versions. The percentage of recovery was computed by comparing the recovered concentration at each of the three levels with the added concentration.
Precision
The Agilent Infinity II 1260 instrument with the attached Phenomenex C18 column of dimensions (250 mm × 4.6 mm, 5 µm) used 50:50 v/v acetonitrile-water mobile phase for analysis. The intermediate precision experiment involved six additional FIN solutions (each at about 100 μg/mL) that served as test samples. The precision investigation determined the percentage of assay while the RSD evaluated three factors: each of the six readings as well as the percentage of assay associated with the total reading combining precision and intermediate precision measurements.
Robustness
The outcome proves effective under minor alterations to the chromatographic process. The system showed wavelength compatibility at all measurement levels during both low and high flow rates along with temperature changes in the oven.
The method suitability evaluation consisted of testing measurement values for LOQ and LOD. Method LOD evaluation and LOQ assessment occurred through calculation procedures using ratios of 3.3*σ/S and 10*σ/S.
Forced Degradation Study
Evaluation of degradation products through forced degradation studies helps establish molecular stability patterns and processes alongside validating both analytical methods and system stability.[12-14] The scientists tested FIN with various stressors including temperature effects and oxidation and basic and acidic breakages and UV light exposure..
Acid Hydrolysis
An amount of 20.2 milligrams of finerenone API received weight measurement before being placed into a twenty-milliliter volumetric flask. The added 15 milliliters of methanol before dissolving the API with a sonicator followed by the addition of 2 mL 2 N HCl solution. The sample rested on the bench for a period of 20 minutes. The reaction required neutralization with 2 mL of 2 N NaOH solution after spending 20 minutes. Additional methanol diluted the solution to achieve a concentration of 1000 ppm (parts per million). The sample was then topped off to reach its required volume before the mobile phase addition to dilute the stock solution to 10 mL containing 100 ppm finerenone.
Alkali Hydrolysis
A 20.3 mg weight of finerenone API was placed within a 20 mL volumetric flask. A sonication method completed dissolving the API solution through addition of 15 milliliters of methanol. The mix received 2 mL of 1 N NaOH solution. The process received two milliliters of one Normal HCl solution following thirty minutes of bench top retention. The stock solution reached 1000 parts per million after diluting with methanol. Subsequently, mobile phase was added to make 1 mL stock solution into 10 mL (resulting in about 100 ppm of finerenone).
Oxidative Stress Degradation
Proceedings began with weighing 20.3 mg finerenone API followed by immediate addition to the 20 mL volumetric flask. API dissolving occurred through the combination of 15 milliliters methanol and sonication. We combined 2 milliliters of 30% hydrogen peroxide solution into the test tubes. The researcher maintained the sample at the bench for twenty minutes. The solution received supplemental methanol from Volume twenty minutes later. An amount of methanol equivalent to 1000 parts per million was added.
The home-made mobile phase solution became 100 ppm finerenone solution after diluting 1 mL of stock solution into 10 mL volume.
Thermal Degradation
Experimentation occurred when the hot air oven received a petri dish of API while the researchers covered it with aluminum foil before using a pointed object to puncture it. The hot air oven kept the specimen at 105º C temperature for a duration of three days. After preparing the 20 mg sample of thermally treated Finerenone API using proper methodology, scientists kept it under desiccation for 72 hours until reaching R.T. The solution required 15 milliliters of methanol to dissolve the API by sonicator operation. A volumetric calibration using methanol brought the mixture to the specified concentration (approximately 1000 parts per million). Execution of the study required adding mobile phase to the stock solution which resulted in 1ml diluted to 10ml to produce 100 ppm finerenone.
Photolytic Degradation
A petri dish received an appropriate amount of API followed by aluminum foil covering while a point was made with a pointed instrument. The petri dish containing the sample underwent exposure to sunlight over seven days. The researcher placed the extracted sample on the bench top until it reached room temperature following the sample preparation protocol. As part of the procedure they weighed 20 mg of Finerenone API that underwent thermal treatment before transferring it to a 20 mL volumetric flask. The API solution became fully dissolved through sonication of 15 milliliters methanol. Additional methanol was required to reach the specified concentration level (roughly 1000 parts per million). After that the solution received mobile phase dilution for a final solution of 10 mL (around 100 ppm of finerenone).
Degradation product characterization
Research samples from the different described conditions went through LC-MS testing. The experimental samples underwent analysis with positive electrospray ionization technique in MS spectrometer equipment. Structure elucidation activities used the obtained LC-MS findings.
Result and Discussion
Mobile Phase Optimization
The target of method development work was to create distinct peaks of the active pharmaceutical ingredient along with resolution greater than two and lower asymmetric factors. Acetonitrile together with water and methanol were used as mobile phases to obtain sharp drug peaks. During the work period laboratory researchers chose Acetonitrile: Water (50:50 % v/v) as their optimal mobile phase for achieving the best chromatographic results.
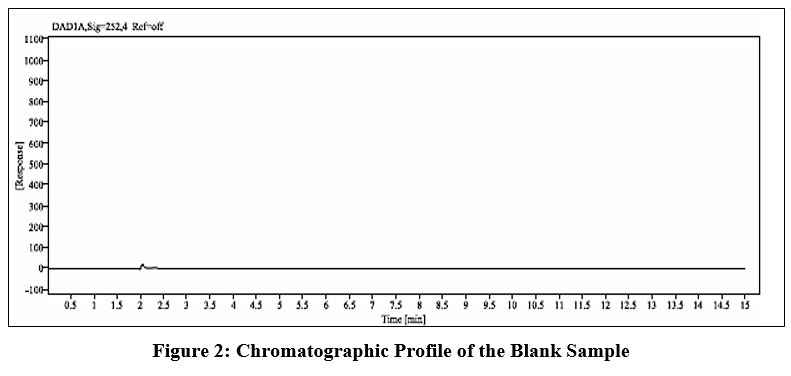 |
Figure 2: Chromatographic Profile of the Blank Sample |
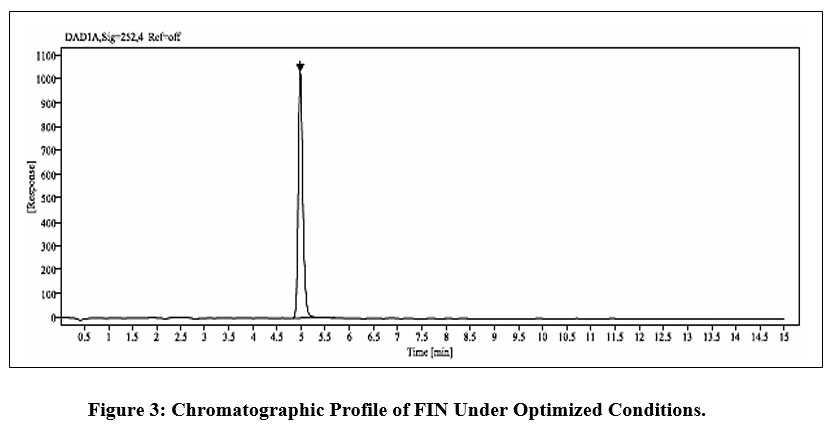 |
Figure 3: Chromatographic Profile of FIN Under Optimized Conditions. |
Method Validation
System suitability
The system evaluated showed two main characteristics. First, theoretical plates needed to exceed (NLT) 2000 and asymmetry needed to meet (NMT) 2.0 while the area of five standard solution replicates demonstrated percentage RSD not above (NMT) 2.0. The system suitability evaluation satisfies all established requirements.
Solution stability
The solution stability research showed a % absolute difference of not more than 2.0 for the three time points starting and ending at 12 hours and ending at 24 hours. It was therefore found that the usual solution held its stability for a full day.
Specificity
Following the injection of both the standard and blank solutions, the standard solution reached its maximal purity, and during the FIN retention period, the blank exhibited no interference. This developed chromatographic method demonstrated the necessary feature for specific identification.
Linearity
The development of calibration curves resulted from plotting peak area values against concentration range from 80–120 μg/mL with 0.99995 correlation coefficient.
Table 1: Linearity Data Analysis
| Level | Conc (µg/mL) | Area | Mean | STD DEV | % RSD |
| 80% | 80 | 84202908 | 84218346 | 16248.558 | 0.019 |
| 84235299 | |||||
| 84216831 | |||||
| 90% | 90 | 94497753 | 94440139 | 119689.292 | 0.127 |
| 94520126 | |||||
| 94302539 | |||||
| 100% | 100 | 104900370 | 104884957 | 46214.134 | 0.044 |
| 104921495 | |||||
| 104833006 | |||||
| 110% | 110 | 115368988 | 115373456 | 77041.232 | 0.067 |
| 115298746 | |||||
| 115452634 | |||||
| 120% | 120 | 125294749 | 125222649 | 74098.409 | 0.059 |
| 125146702 | |||||
| 125226495 |
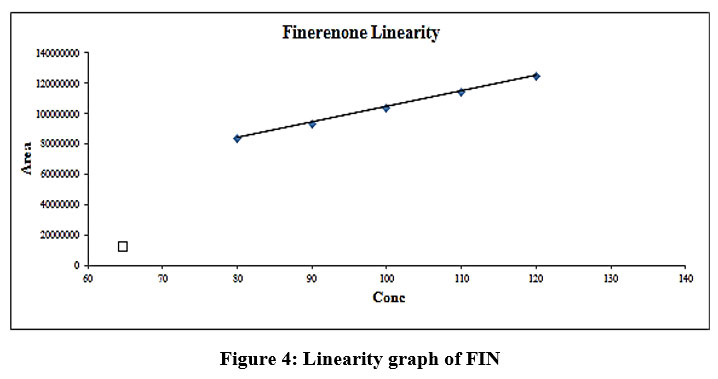 |
Figure 4: Linearity graph of FIN |
The linear regression model obtained an equation which described the relationship as y = 1029419.23 x + 1885986.4. The calculated regression coefficient remained inside the accepted area specified by the range parameters. The analysis reached LOD of 0.539 μg/mL while achieving LOQ at 1.634 μg/mL.
Accuracy
Multiple accuracy tests at 80% level of accuracy and 100% level of accuracy and 120% level of accuracy were prepared for each step. The recovery percentage based on added concentration and recovered concentration measurements resulted in acceptable results between 98.0 and 102.0 percent.
Table 2: Accuracy Data Analysis
| Level (50 %) | Area | Recovered conc | Added conc | % Recovery | Mean Recovery | % RSD |
| 80 | 85620419 | 81.540 | 81.000 | 100.67 | 100.21 | 0.409 |
| 84431266 | 80.408 | 80.500 | 99.89 | |||
| 85626527 | 81.546 | 81.500 | 100.06 | |||
| 100 | 105688497 | 100.652 | 100.500 | 100.15 | 99.68 | 0.522 |
| 104753029 | 99.761 | 100.000 | 99.76 | |||
| 105123041 | 100.113 | 101.000 | 99.12 | |||
| 120 | 125852942 | 119.855 | 121.500 | 98.65 | 99.12 | 0.490 |
| 126049510 | 120.043 | 120.500 | 99.62 | |||
| 126425973 | 120.401 | 121.500 | 99.10 |
Precision
Precision analysis used six test solutions made at about 100 μg/mL concentration of FIN. The precision test results indicated a percent RSD value below 2.0 across six samples tested. Besides that, individual assay values and mean measurement were within the allowable test range from 98.0 to 102.0 percent. The produced data exhibits reliable consistency.
Table 3: Precision of Area & % Assay
| Samples | Area | % Assay |
| 1 | 105321061 | 98.9 |
| 2 | 106024856 | 99.48 |
| 3 | 104352967 | 99.1 |
| 4 | 105020659 | 100.02 |
| 5 | 104763297 | 100.27 |
| 6 | 105249638 | 99.74 |
| Mean | 98.9 | |
| STD DEV | 0.653 | |
| % RSD | 0.656 | |
Intermediate precision
Another six samples were prepared for the future intermediate precision assessment. To establish calculations of both the percentage of assay average and RSD from twelve readings that comprised six precisions and six intermediate precision readings researchers determined six reading percentage of assay and overall precision RSD. Test results met established limits as the assay ranged from 98.0 to 102.0% while the %RSD stood at NMT 2.0.
Table 4: Intermediate precision of Area & % Assay
| Samples | Area | % Assay |
| 1 | 104562103 | 98.11 |
| 2 | 104765445 | 99.28 |
| 3 | 105036459 | 101.04 |
| 4 | 104856381 | 97.90 |
| 5 | 105500681 | 98.99 |
| 6 | 105264853 | 99.9 |
| Mean | 99.26 | |
| STD DEV | 1.2160 | |
| % RSD | 1.225 | |
| Precision and Intermediate Precision Analysis | Mean | 99.440 |
| STD DEV | 0.949 | |
| % RSD | 0.955 | |
Robustness
Table 5: Robustness of Tailing Factor
| components | Parameters | Tailing factor (NMT 2) | Theoretical plates (NLT 2000) |
| FIN | Wavelength: +2 nm | 1.18 | 16342 |
| Wavelength: -2 nm | 1.18 | 16367 | |
| Flow: +10% | 1.19 | 15891 | |
| Flow: -10% | 1.21 | 17674 | |
| Column tem: +2°C | 1.18 | 16728 | |
| Column tem: -2°C | 1.20 | 16480 |
Automation of chromatography worked efficiently under changing conditions for wavelength and mobile phase flow rates and column oven temperatures. The evaluated system appropriateness levels demonstrated acceptable values. The method shows resilience because of which we can draw this conclusion.
Forced Degradation Study
Acid hydrolysis experiments involving HCl solution at 2 N concentration resulted in 10.25% DEG production when performed at room temperature for 20 minutes on the benchtop surface. The generated degradation peaks occurred at R.T. 2.49, 3.77 and 6.84, as displayed in Figure 5.
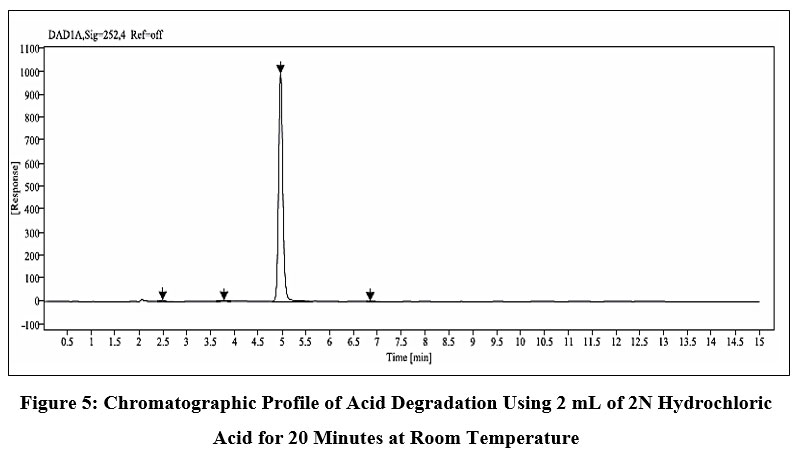 |
Figure 5: Chromatographic Profile of Acid Degradation Using 2 mL of 2N Hydrochloric Acid for 20 Minutes at Room Temperature |
The degradation of the compound reached 15.47% under base hydrolysis conditions using 1 N NaOH at room temperature resulting in four peaks at R.T. 2.48, 2.79, 3.81, 6.84 (figure 6).
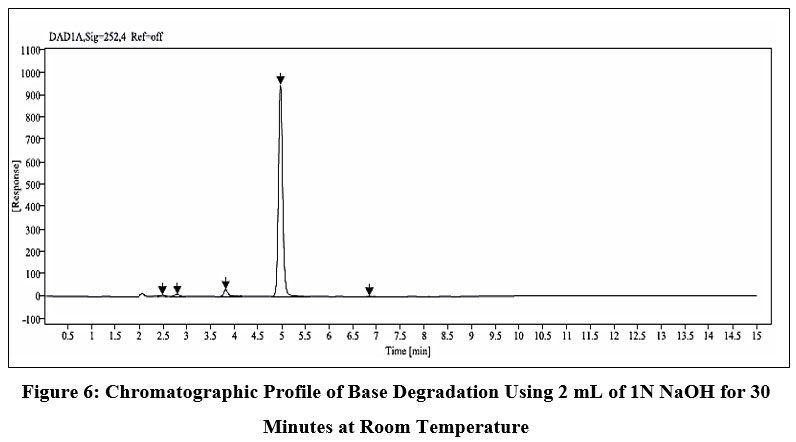 |
Figure 6: Chromatographic Profile of Base Degradation Using 2 mL of 1N NaOH for 30 Minutes at Room Temperature |
Finerenone degraded by 11.23% in the peroxide stress experiment after 20 minutes at room temperature with 2 mL of 30% H2O2. There were three degradation products identified in this instance, and as the figure 7 illustrates, their associated R.T. values were 3.58, 3.93, and 6.84.
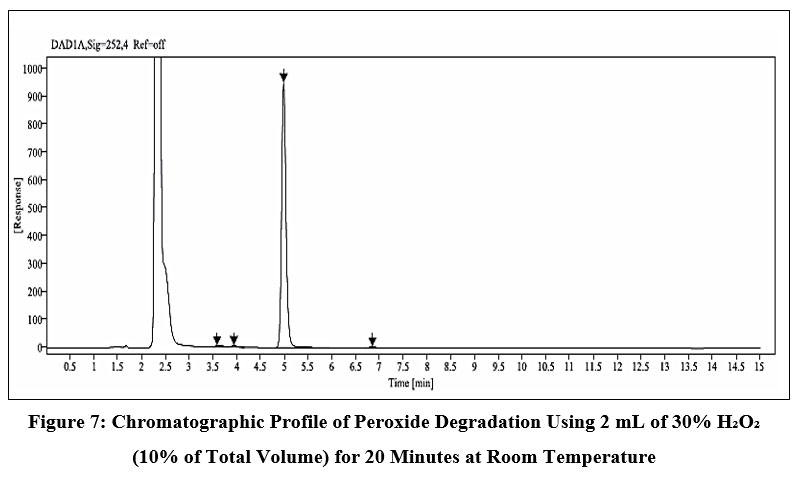 |
Figure 7: Chromatographic Profile of Peroxide Degradation Using 2 mL of 30% H₂O₂ (10% of Total Volume) for 20 Minutes at Room Temperature. |
The drug remained stable throughout operations triggered by thermal conditions along with photolytic events. Table 6 contains extra information about stability data.
Table 6: Forced Degradation Study Data
| Sample Name | Treatment | Trial No. | Exposure condition | % Assay | % Degradation |
| API | Sample as such | Trial No. 1 | NA | 100.00 | NA |
| Thermal | Trial No. 1 | 105°C for 72 Hours | 99.32 | 0.68 | |
| Photolytic | Trial No. 1 | Sunlight for 7 days | 99.87 | 0.13 | |
| Acid | Trial No. 1 | 2 mL of 5 N HCl for 24 Hours at R.T. | 0 | 100 | |
| Trial No. 2 | 1 mL of 0.1 N HCl for 15 minutes at R.T. | 99.51 | 0.49 | ||
| Trial No. 3 | 2 mL of 2 N HCl for 20 minutes at R.T. | 89.75 | 10.25 | ||
| Base | Trial No. 1 | 2 mL of 5 N NaOH for 24 Hour at R.T. | 8.11 | 91.89 | |
| Trial No. 2 | 2 mL of 1 N NaOH for 30 minutes at R.T. | 84.53 | 15.47 | ||
| Peroxide | Trial No. 1 | 2 mL of 30% H2O2 for 24 Hour at R.T. | 44.73 | 55.27 | |
| Trial No. 2 | 2 mL of 30% H2O2 for 10 minutes at R.T. | 93.52 | 6.48 | ||
| Trial No. 3 | 2 mL of 30% H2O2 for 20 minutes at R.T. | 88.77 | 11.23 |
Characterization of degradation Product by LC-MS
By employing mass spectral analysis, the column eluates were identified and studied.
Table 7: Forced Degradation Study Data by LC-MS
| Condition | Optimized trial no. | Treatment | % Assay | % Degradation | Analyte/Degredants | RT | M/Z |
| NA | NA | NA | NA | NA | Finerenone | NA | 378.00 |
| Acid treated | Trial No. 3 | 2 mL of 2 N HCl (10% of total volume) for 20 minutes at R.T. | 89.75 | 10.25 | DP-1 | 2.49 | 339.09 |
| DP-2 | 3.77 | 273.09 | |||||
| DP-3 | 6.84 | 303.46 | |||||
| Base treated | Trial No. 2 | 2 mL of 1 N NaOH (10% of total volume) for 30 minutes at R.T. | 84.53 | 15.47 | DP-1 | 2.48 | 316.38 |
| DP-2 | 2.79 | 360.66 | |||||
| DP-3 | 3.81 | 316.68 | |||||
| DP-4 | 6.84 | 315.85 | |||||
| Peroxide treated | Trial No. 3 | 2 mL of 30% H2O2 (10% of total volume) for 20 minutes at R.T. | 88.77 | 11.23 | DP-1 | 3.58 | 273.16 |
| DP-2 | 3.93 | 360.60 | |||||
| DP-3 | 6.84 | 316.22 |
Acid degradation
Three degradation peaks were displayed by FIN during acid exposure. The molecular ion peak for FIN, ADP-1, ADP-2, and ADP-3 was discovered at m/z 378, 339.09, 273.09, and 303.46, respectively, using the MS method for the acid-degradant sample.ADP-1 also showed fragments around 319 (C19H17N3O), 292 (C17H14N3O2), 273 (C17H11N3O), 217 (C15H9N2) and 216 (C15H8N2) .Similarly ADP-2 showed fragments around 272 (C17H10N3O) , 244 (C16H8N2O) and 228 (C16H8N2) and ADP-3 showed fragments around 272 (C16H8N4O) , 269 ( C18H11N3) and 245 (C15H7N3O). Mass spectra for ADP-1 and ADP-2 and ADP-3 follow each other successively through figures 8, 9, 10. The figure includes structural depictions of ADP-1 ADP-2 and ADP-3.
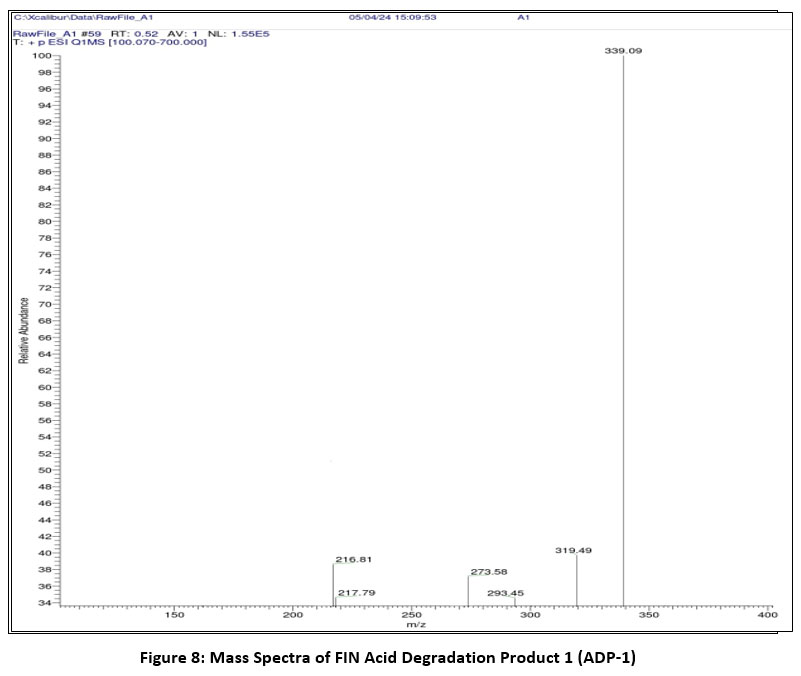 |
Figure 8: Mass Spectra of FIN Acid Degradation Product 1 (ADP-1). |
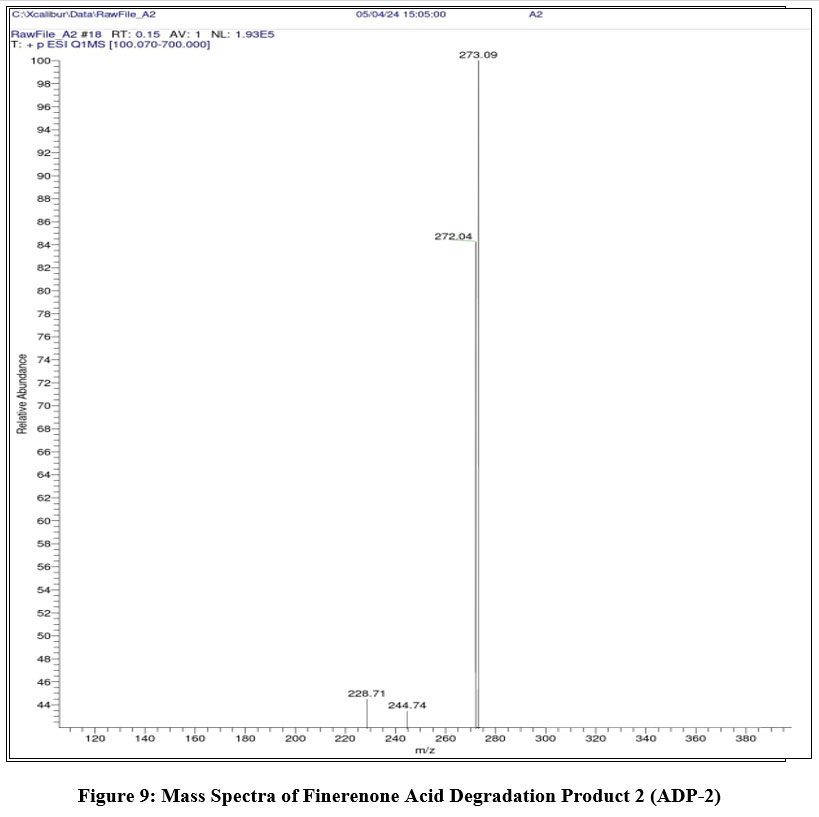 |
Figure 9: Mass Spectra of Finerenone Acid Degradation Product 2 (ADP-2). |
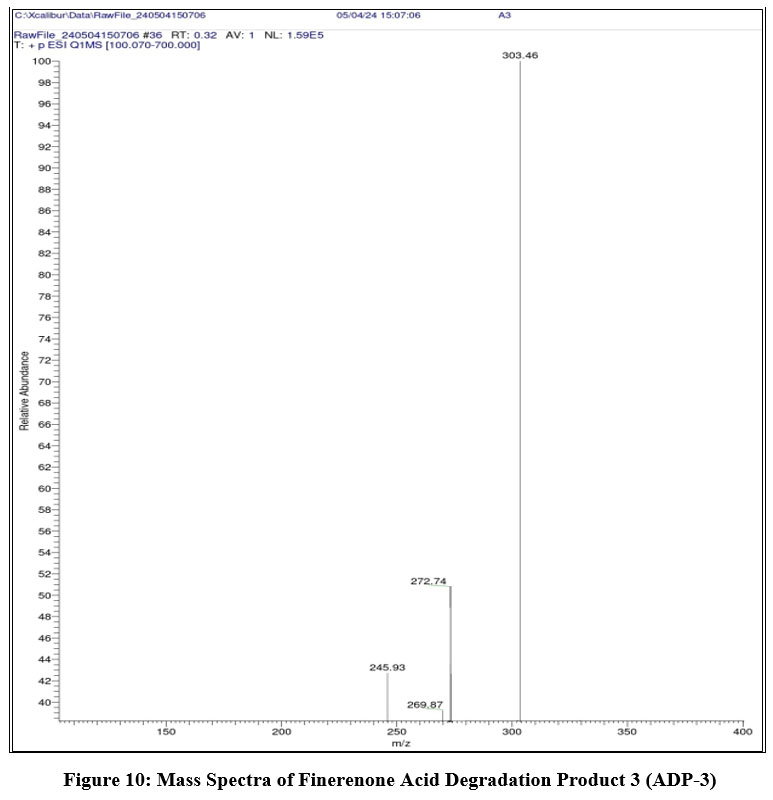 |
Figure 10: Mass Spectra of Finerenone Acid Degradation Product 3 (ADP-3). |
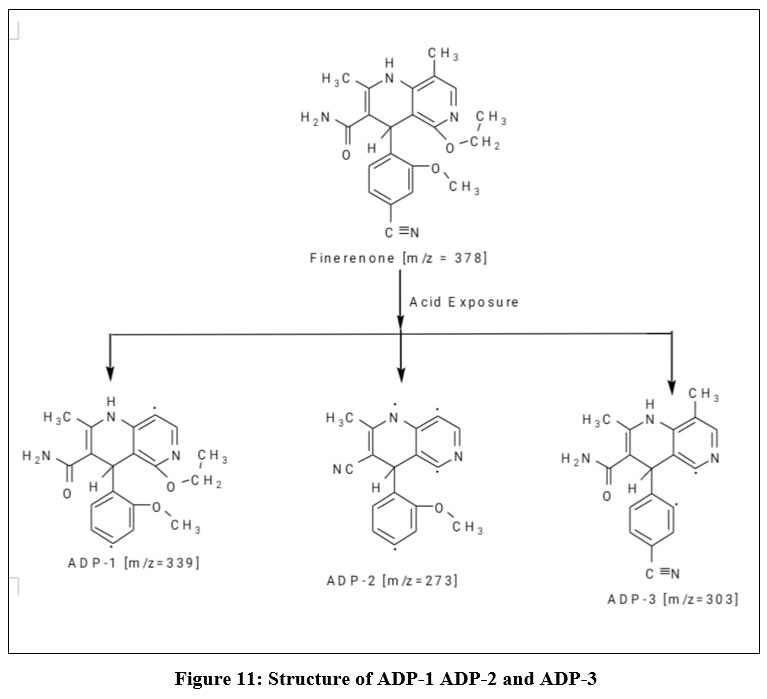 |
Figure 11: Structure of ADP-1 ADP-2 and ADP-3 |
Alkali degradation
Four degradation peaks were displayed by FIN during alkali exposure. The molecular ion peak for FIN, BDP-1, BDP-2, BDP-3 and BDP-4 was discovered at m/z 378, 316.38, 360.66, 316.68 and 315.85, respectively, using the MS method for the alkali-degradant sample.BDP-1 also showed fragments around 272.80 (C16H7N3O2), 272.34 (C17H10N3O) and 271 ( C17H9N3O).Similarly, BDP-2 showed fragments around 359 (C21H19N4O2) , 317 (C19H15N3O2), 316 ( C18H12N4O2), 273 (C16H7N3O2), 272 (C17H10N3O) and 229 (C16H9N2). BDP-3 showed fragments around 273 (C18H13N2O) and 272 (C16H6N3O2).BDP-4 showed fragments around 312.63 (C19H13N4O), 274 (C17H12N3O) and 273 (C17H11N3O). The analysis of BDP-1 through BDP-4 yields their results in mass spectra shown in Figures 12 through Figure 15. The figure 16 displays both the chemical structures of BDP-1 and BDP-2 and of BDP-3 and BDP-4.
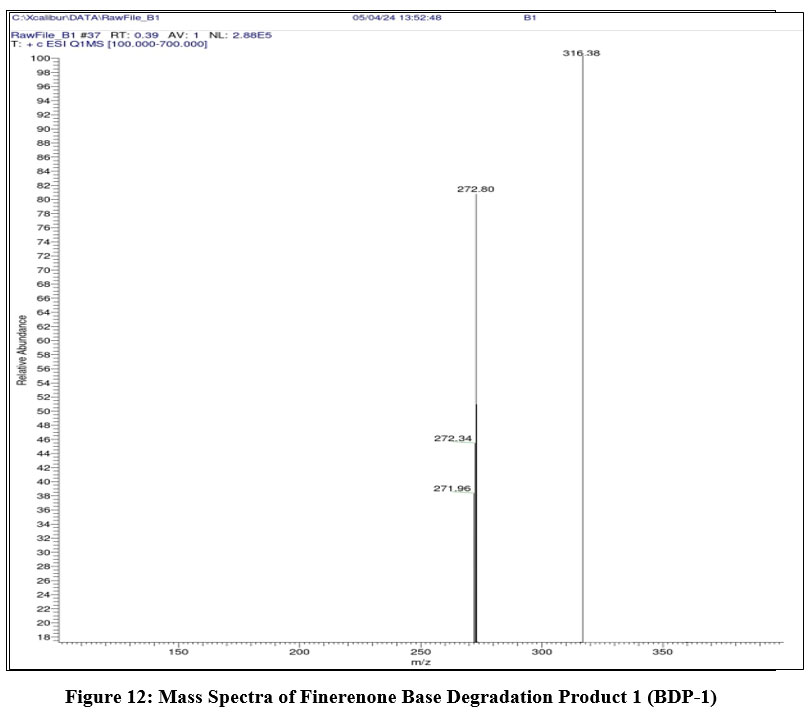 |
Figure 12: Mass Spectra of Finerenone Base Degradation Product 1 (BDP-1). |
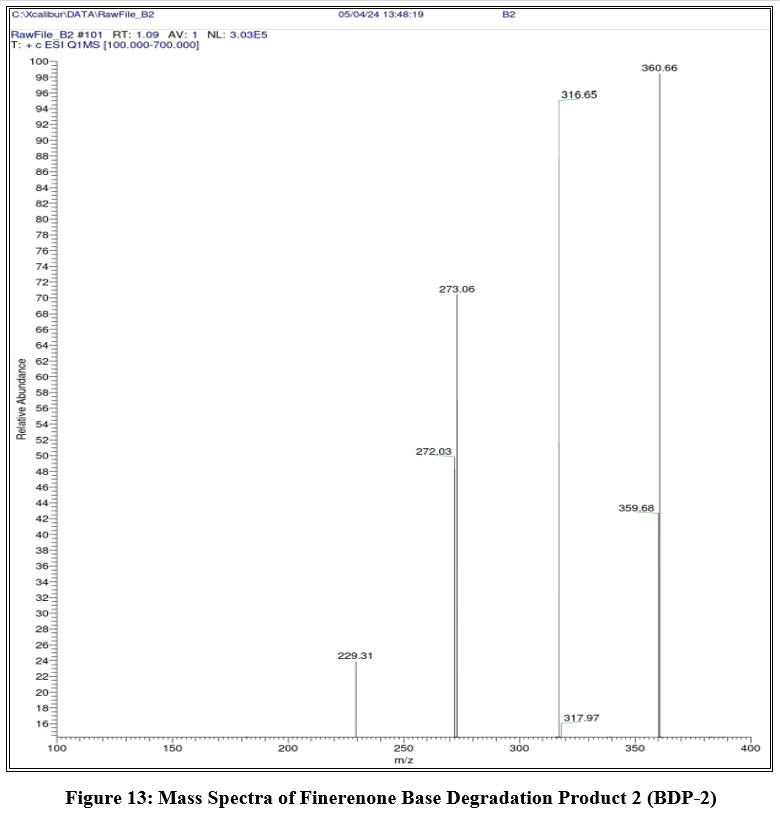 |
Figure 13: Mass Spectra of Finerenone Base Degradation Product 2 (BDP-2). |
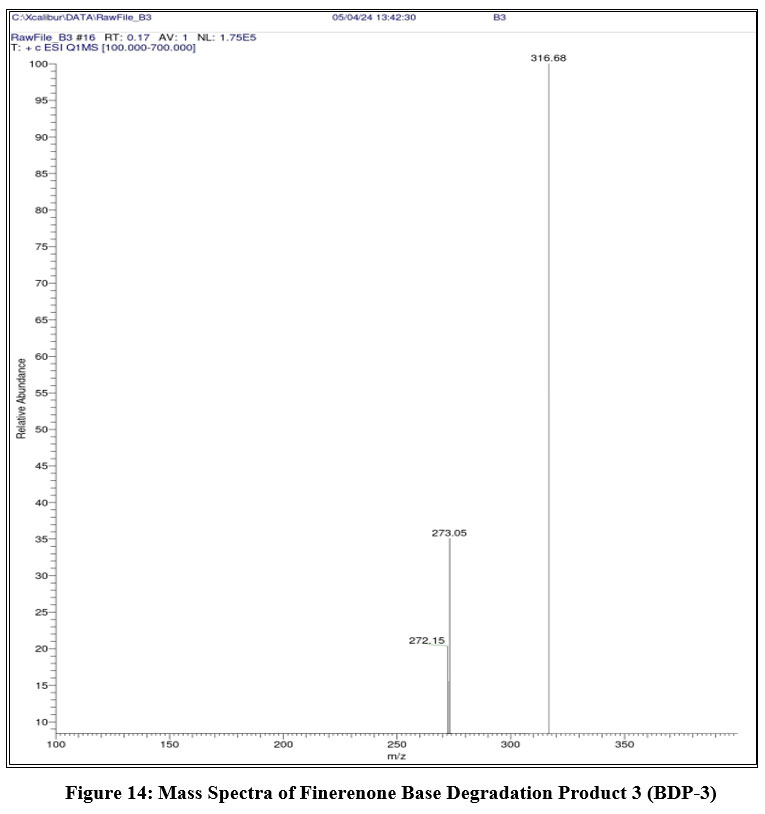 |
Figure 14: Mass Spectra of Finerenone Base Degradation Product 3 (BDP-3). |
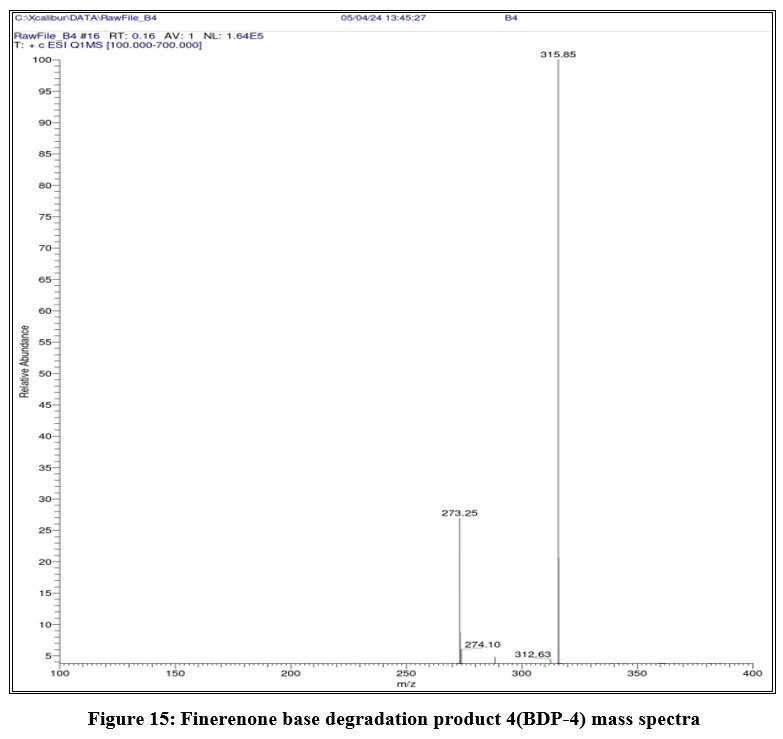 |
Figure 15: Finerenone base degradation product 4(BDP-4) mass spectra. |
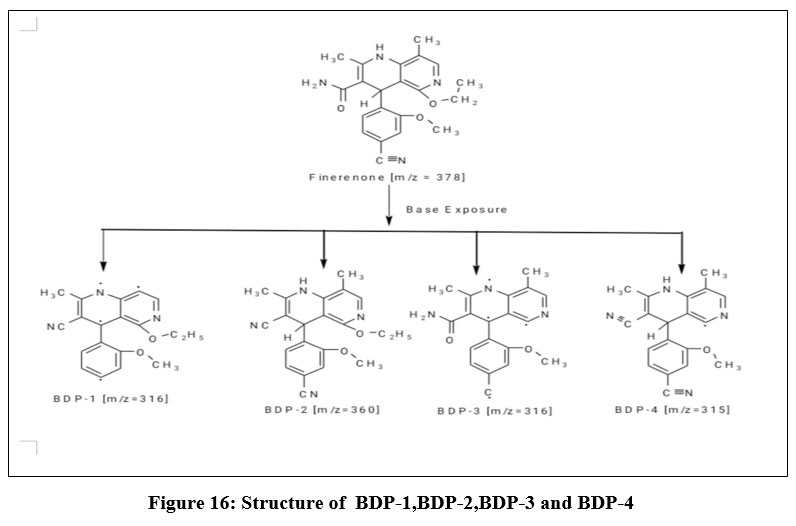 |
Figure 16: Structure of BDP-1,BDP-2,BDP-3 and BDP-4. |
Oxidative degradation
Three peaks appeared during FIN’s exposure to peroxides. The MS method used for peroxide-degradant analysis exposed m/z 273.16 as the molecular ion peak for FIN and m/z 360.60 for PDP-1 together with m/z 316.22 for PDP-2 and PDP-3. PDP-1 also showed fragments around 272 (C17H10N3O), 257 (C16H7N3O), 244 (C16H8N2O), 243 (C15H5N3O) and 213 (C15H5N2).Similarly, PDP-2 showed fragments around 343 (C20H15N4O2), 317 (C19H15N3O2), 316 (C18H12N4O2), 288 (C17H10N3O2), 273 (C16H7N3O2) and 270 (C16H6N4O). PDP-3 showed fragments around 303 (C18H12N3O2), 284 (C18H10N3O2), 273 (C18H13N2O), 272 (C16H6N3O2), 228 (C16H8N2) and 200 (C14H4N2). The PDP-1 and PDP-2 and PDP-3 mass spectral data appears in figures 17 through 19. The figure 20 depicts the structural representation of PDP-1 together with PDP-2 and PDP-3.
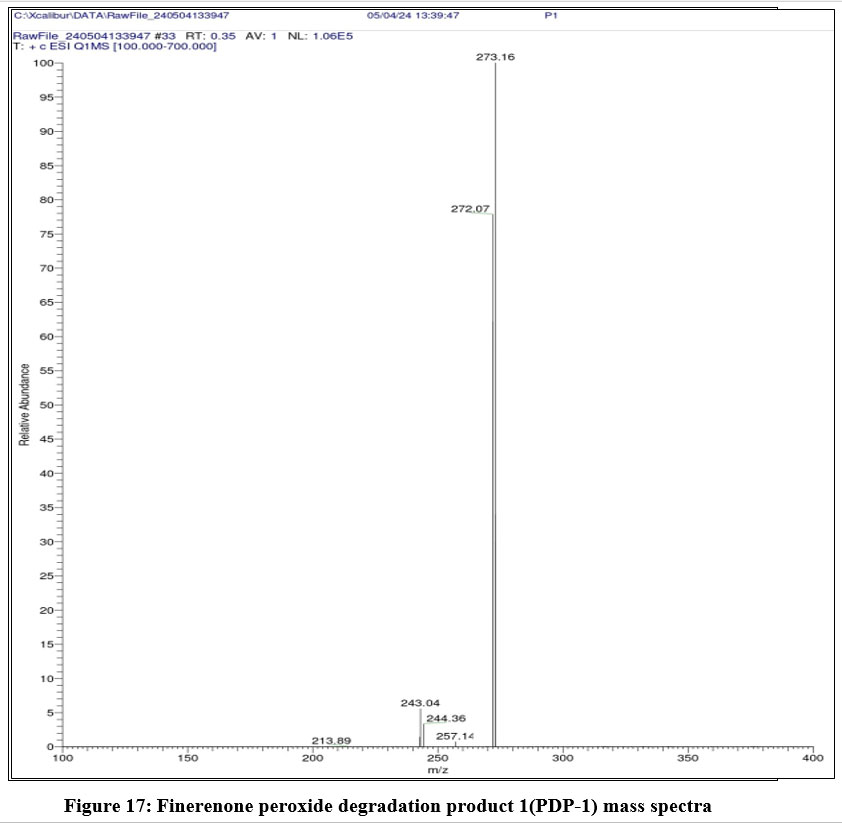 |
Figure 17: Finerenone peroxide degradation product 1(PDP-1) mass spectra |
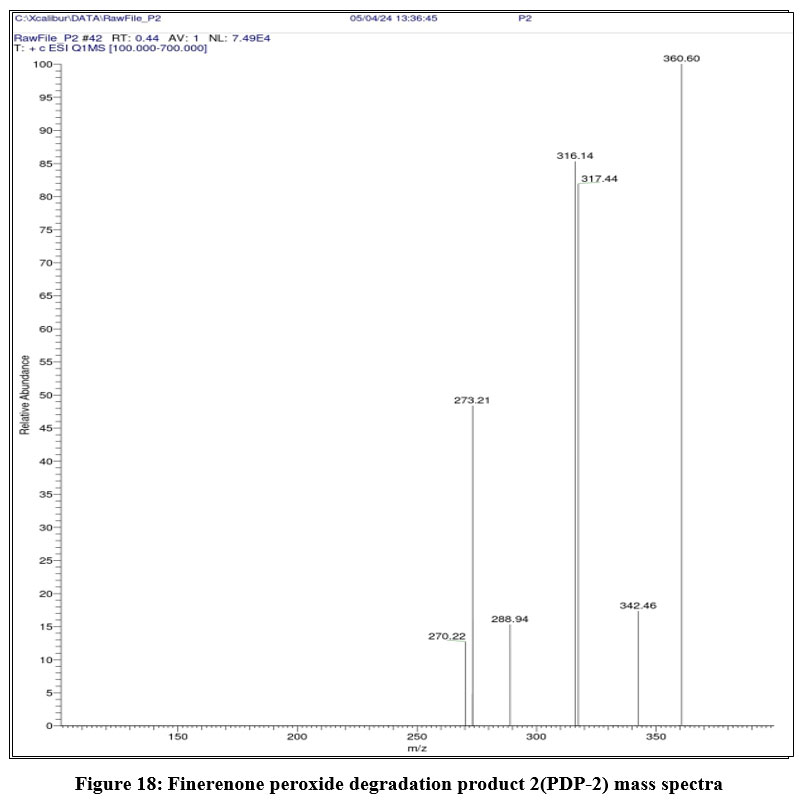 |
Figure 18: Finerenone peroxide degradation product 2(PDP-2) mass spectra. |
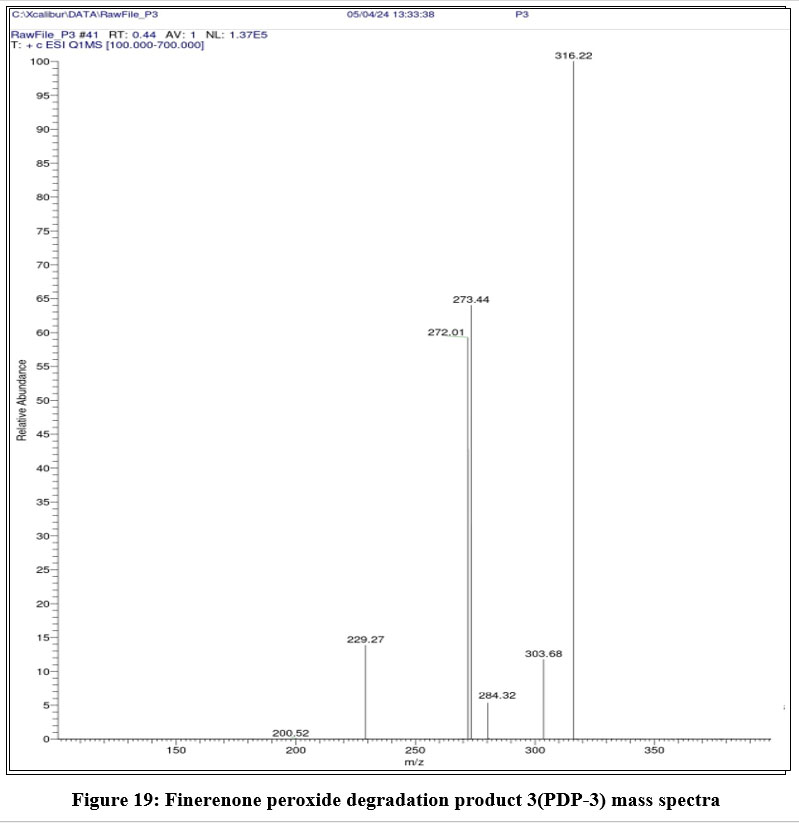 |
Figure 19: Finerenone peroxide degradation product 3(PDP-3) mass spectra. |
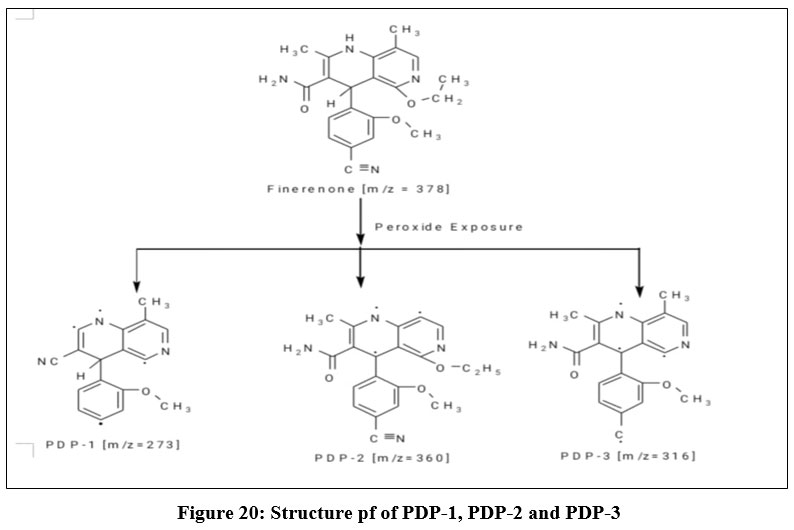 |
Figure 20: Structure pf of PDP-1, PDP-2 and PDP-3. |
Conclusion
RP-HPLC stability testing of the FIN API occurred by using a Phenomenex C18, (250 mm X 4.6 mm i.d., 5μm) column and implementing acetonitrile as a mobile phase: water (50:50 v/v) mobile phase combination for trial purposes. The scientists performed stability investigations on FIN by applying different stress conditions. The FIN product demonstrated resistance to dry heat and photolytic stress but demonstrated significant vulnerability to acid and peroxide and basic stress degradation. The validation process revealed that this method reached high performance standards regarding sensitivity alongside accuracy and precision and selectivity. Mass spectrometry analyzed the degradation product that appeared during the forced degradation assessment.
Acknowledgement
The authors are grateful to the principal, Dr. S.J. Kshirsagar, the management and trustees of Mumbai Educational Trust in Nashik, as well as Dr. Reddy’s Laboratories (Hyderabad, India) who gave a gift sample of FIN.
Funding Sources
The author(s) received no financial support for the research, authorship, and/or publication of this article.
Conflict of Interest
The author(s) do not have any conflict of interest.
Data Availability Statement
This statement does not apply to this article.
Ethics Statement
This research did not involve human participants, animal subjects, or any material that requires ethical approval.
References
- Prajapati S, Prajapati P, Gondaliya K. A comprehensive review article on finerenone.EPRA International Journal of Research and Development, 8(2):200-2. (2023).
- Heinig R, Eissing T. The Pharmacokinetics of the Nonsteroidal Mineralocorticoid Receptor Antagonist Finerenone. Clinical Pharmacokinetics, 62(12):1673-93, (2023).
CrossRef - Nyamagoud SB, Swamy AH, Hiremath J, BJ A, Raj S, Hegde M, Tikadar D, Kanavi RS, Veeresh RJ. Finerenone as a New Potent Resistant Hypertension Agent: A Review. International Journal of Pharmaceutical Investigation, 14(1), (2024).
CrossRef - Rohde G, Loewen S, Heinig R. Determination of finerenone–a novel, selective, nonsteroidal mineralocorticoid receptor antagonist–in human plasma by high-performance liquid chromatography-tandem mass spectrometry and its application to a pharmacokinetic study in venous and capillary human plasma. Journal of Chromatography B., 1172:1226-43. (2021).
CrossRef - Husnain F, Mahboob P, Khaleel M. Estimation and validation of finerenone in dosage form and in bulk drug by spectrophotometric method, 16(2):211-15, (2023).
CrossRef - Imran SJ, Kini SG, Kumar V, Sonawane B, Chaudhari J, Warde S. Validated stability indicating reversed-phase high-performance liquid chromatography (RP-HPLC) for the estimation of FINERENONE in Pharmaceutical tablet dosage form. IJIRT, 11(2)751-761, (2024).
CrossRef - Arulselvan M, Mathrusri A. Forced Degradation Studies for Estimation of Finerenone by RP-HPLC Method. Acta Scientific Pharmaceutical Sciences, 5(12): 25-31, (2023).
- Illendula S, Samiha S, Naik A,Suresh C,Rao K. Development And Validation Of A New Analytical Rp-Hplc Method For The Estimation Of Finerenone In Bulk And Marketed Formulation. World Journal of Pharmaceutical and Life Science, 10(2): 91-98, (2024).
- Mirjapuram J, sammaiah G. Development and validation of a new analytical RP-HPLC method for the quantitative estimation of finerenone in api form and marketed pharmaceutical dosage form. International Journal of Allied Medical Sciences and Clinical Research, 11(2):210-18, (2023).
- Bhardwaj SK, Dwivedia K, Agarwala DD. A review: HPLC method development and validation. International Journal of Analytical and Bioanalytical Chemistry, 5(4):76-81, (2015).
- ICH Harmonized Tripartite Guidelines, International Conference on Harmonization of Technical Requirements for Registration of Pharmaceuticals for Human Use, (2005).
- Alsante KM, Ando A, Brown R, Ensing J, Hatajik TD, Kong W, Tsuda Y. The role of degradant profiling in active pharmaceutical ingredients and drug products. Advanced drug delivery reviews, 59(1):29-37, (2007).
CrossRef - Sehrawat R, Maithani M, Singh R. Regulatory aspects in development of stability-indicating methods: a review. Chromatographia, 72:1-6, (2010).
CrossRef - Blessy MR, Patel RD, Prajapati PN, Agrawal YK. Development of forced degradation and stability indicating studies of drugs—A review. Journal of pharmaceutical analysis, 4(3):159-65, (2014).
CrossRef
Accepted on: 25 Mar 2025


![]()


