Viscometric Properties of Aqueous Sodium and Potassium Salt of L-Leucine
Mahendra Bapurao Dhande1* and Dipak Tukaram Tayade2
1Department of Chemistry, HPT Arts and RYK Science College, Nashik, India.
2Department of Chemistry, Government Vidarbha Institute of Science and Humanities, Amravati, India.
Corresponding Author E-mail: mahen_dhande@yahoo.co.in
DOI : http://dx.doi.org/10.13005/ojc/380523
Article Received on : 10 Aug 2022
Article Accepted on : 03 Oct 2022
Article Published : 12 Oct 2022
Reviewed by: Dr. Vishnuvardhan Tatri
Second Review by: Dr. V T Geetha
Final Approval by: Dr. Pounraj Thanasekaran
For capturing CO2 from flue gases after combustion, amino acid salt solutions are considered superior solvents over alkanolamine due to their certain advantages. In the present work, the viscosities measurements of aqueous sodium and potassium salt solutions of L-leucine were made at 298.15, 303.15, 308.15, and 313.15 K, and their concentrations range from 0.01 to 0.15 mol L-1. Thereafter, the Jones-Dole coefficient (B), temperature derivative of B i.e. (dB/dT), the free energy of activation, the enthalpy as well as the entropy of activation of viscous flow were derived from experimental data on viscosity.
KEYWORDS:CO2; Potassium Salt of L-Leucine; Jones-Dole Coefficient; Viscosity
Download this article as:| Copy the following to cite this article: Dhande M. B, Tayade D. T, Viscometric Properties of Aqueous Sodium and Potassium Salt of L-Leucine. Orient J Chem 2022;38(5). |
| Copy the following to cite this URL: Dhande M. B, Tayade D. T, Viscometric Properties of Aqueous Sodium and Potassium Salt of L-Leucine. Orient J Chem 2022;38(5). Available from: https://bit.ly/3SVZSRu |
Introduction
Global warming is the most alarming environmental problem. Excessive emissions of carbon dioxide (CO2) from several sources, including the burning of fuels, both human and other industrial activities, are the primary cause of global warming1,2. The reduction of CO2 from the flue gas is a vital step in many industrial activities required for economic and environmental aspects. There are many post- combustion capture technologies to separate CO2 from flue gas, before it enters the atmosphere. The goal is to collect pure CO2 channels that could be compressed and transported to a storage area. In general, this process is known as CO2 capture and storage(CCS).
For CO2 capture chemical absorption using alkanolamine absorbents have been extensively employed3. Some of the demerits associated with alkanolamines in CO2 capture process are their degradation in oxygen-rich atmosphere and corrosion in the process equipment4. These drawbacks of alkanolamine solvents limits their application for carbon dioxide capture procedures.
Recently, salts of amino acid have been investigated as good substitutes for amines and many researchers have examined their interaction with CO2 5,6. Amino acids resembles amines in their functional group and acts in similar manner in the CO2 capture process. Amino acids have certain unique advantages over alkanolamines like fast reaction kinetics, very low volatility, more stability towards oxidative degradation7, higher surface tension, and having a significant absorption capability8.
Physicochemical properties are essential in the simulation and design of gas-liquid contactors, heat exchangers, working of the equipment, process modelling, and for the evaluation of proper absorbents for CO2 capture9-12. These properties are also essential for the deduction of chemical reaction kinetics from CO2 absorption rate experiments13,14.
For aqueous sodium and potassium leucinate solutions, such properties still have not been described in the existing literature at a lower concentration range. Thus, we provided fresh experimental data on viscosity, thereafter Jones-Dole coefficient (B), temperature derivative of B i.e. (dB/dT), free energy of activation(Δ𝐺̅0#), the enthalpy and entropy of activation (Δ𝐻̅0# and Δ𝑆̅0#) for sodium and potassium salt solutions of above mentioned amino acid.
Experimental
Materials and preparation of salt amino acid
L-leucine (CAS No. 61-90-5, 99.0% purity) was supplied by LOBA CHEMIE PVT. LTD., NaOH (CAS No. 1310-73-2, GR, 98 % purity) and KOH (CAS No. 1310-58-3, GR, 98% purity) were bought from Merck. All chemicals were used as received.
The aqueous salt solutions of leucine were made by neutralizing leucine with an equimolar amount of NaOH and KOH in triply distilled water. Using the weight/weight method the solutions were made in dry, airtight glass bottles with stoppers. Electronic balance accurate to 0.1 mg was used to record the masses.
Structure of sodium and potassium salt of L-leucine
Viscosity measurements
Dynamic viscosity values of aqueous solutions of sodium and potassium salt of L-leucine were measured using Ubbelohde suspended-level viscometer15, 16 for concentrations range 0.01 to 0.15 m and at temperatures (298.15, 303.15, 308.15, and 313.15) K at atmospheric pressure. Triply distilled water and pure AR grade solvents were used to calibrated Viscometer. The viscometer was placed straight in a transparent glass water bath with a openings above the water level, and a thermostat was used to maintain the constant temperature at 0.01 K. a digital stopwatch that is electronic. The flow-time(t) measurements were performed using an electronic digital sport stopwatch with a precision of 0.01 s. Minimum three readings were recorded of each viscosity data point with a 0.05 s reproducibility and their averaged values were considered.
Results and Discussion
Dynamic viscosities (η) were determined via

where t, ρ, η, and to, ρo,ηo are flow time, density, and viscosity of solution and solvent, respectively.
The measured values of viscosity for aqueous solution of sodium and potassium salt of L-leucine at concentration range (0.01 to 0.15) m and temperatures at (298.15, 303.15, 308.15, and 313.15) K are placed in Table 1. It is observed that viscosity increases with concentration. Table 1, Figure 1, Figure 2 indicates that density increases with molality of the solutions and decreases with the increase in the temperature.
The viscosity data were analysed using the Jones-Dole equation17

𝐴 is a constant term that provides data on the strength of ion-ion interactions in a solution. Above equation can be modified as

Equation 3 resembles the straight line equation (y = mx + c) with 𝐵 as a slope and A as an intercept. The values of [(η /η 0)-1] /m0.5 presented in Table 2. Least square method was employed to obtain Jones-Dole coefficient (B). B values for sodium and potassium salt of leucine at (298.15, 303.15,308.15 and 315.15) K are presented in Table 3. B value of sodium and potassium salt of amino acid decreases with an increasing temperature.
Activation Free energy of solvent and activation free energy of solute can be calculated by the following equations,

where η0, 𝑁𝐴, and ℎ, are the viscosity of the solvent, Avogadro number and Planck’s constant, respectively.
The enthalpy and entropy of activation Δ𝐻̅0# and Δ𝑆̅0#, respectively are calculated by the following equation

Equation 4 is similar to the straight line equation (y = – mx + C) where intercept is equal to Δ𝐻̅0# and the slope is − Δ𝑆̅0#. Δ𝑆̅0#and Δ𝐻̅0# values were calculated using Least square method. Figure 5 and Figure 6 show the variation of Δ𝐺̅0# vs temperature.
Jones-Dole coefficient (B) and (Δ𝐺̅0#) values of sodium leucinate are found to be greater than potassium leucinate.
Table 1: Viscosities ( η ) of sodium and potassium leucinate at different temperatures.
|
m (kg.mol-1) |
η (m-1.kg.s-1) |
m (kg.mol-1) |
η (m-1.kg.s-1) |
||||||
|
298.15 K |
308.15 K |
308.15 K |
313.15 K |
298.15 K |
303.15 K |
308.15 K |
313.15 K |
||
|
sodium leucinate |
potassium leucinate |
||||||||
|
0.00000 |
0.8903 |
0.7975 |
0.7195 |
0.6535 |
0.00000 |
0.8903 |
0.7975 |
0.7195 |
0.6535 |
|
0.01002 |
0.8943 |
0.8018 |
0.7240 |
0.6582 |
0.01007 |
0.8937 |
0.8012 |
0.7234 |
0.6576 |
|
0.03050 |
0.9043 |
0.8110 |
0.7327 |
0.6665 |
0.03010 |
0.9023 |
0.8092 |
0.731 |
0.6648 |
|
0.05098 |
0.9147 |
0.8205 |
0.7414 |
0.6746 |
0.05014 |
0.9112 |
0.8172 |
0.7385 |
0.6717 |
|
0.06973 |
0.9242 |
0.8291 |
0.7493 |
0.6819 |
0.07199 |
0.9210 |
0.8262 |
0.7467 |
0.6792 |
|
0.08976 |
0.9345 |
0.8385 |
0.7578 |
0.6896 |
0.09103 |
0.9297 |
0.8339 |
0.7538 |
0.6857 |
|
0.10979 |
0.9448 |
0.8478 |
0.7662 |
0.6974 |
0.11007 |
0.9382 |
0.8418 |
0.7608 |
0.6921 |
|
0.13074 |
0.9558 |
0.8575 |
0.7750 |
0.7055 |
0.12977 |
0.9473 |
0.8498 |
0.7681 |
0.6988 |
|
0.15169 |
0.9667 |
0.8674 |
0.7839 |
0.7133 |
0.14947 |
0.9561 |
0.8579 |
0.7751 |
0.7054 |
Table 2: [(h/hₒ)-1]/m 0.5 values for sodium and potassium leucinate in water at different temperatures.
|
m (kg.mol-1) |
[(η /ηₒ)-1]/m 0.5 |
m (kg.mol-1) |
[(η /ηₒ)-1]/m 0.5 |
||||||
|
298.15 K |
308.15 K |
308.15 K |
313.15 K |
298.15 K |
303.15 K |
308.15 K |
313.15 K |
||
|
sodium leucinate |
potassium leucinate |
||||||||
|
0.01002 |
0.04488 |
0.05386 |
0.06248 |
0.07185 |
0.01007 |
0.03806 |
0.04623 |
0.05402 |
0.06252 |
|
0.03050 |
0.09004 |
0.09693 |
0.10505 |
0.11391 |
0.0301 |
0.07769 |
0.08456 |
0.09213 |
0.09967 |
|
0.05098 |
0.12138 |
0.12773 |
0.13481 |
0.14300 |
0.05014 |
0.10484 |
0.11032 |
0.11793 |
0.12438 |
|
0.06973 |
0.14420 |
0.15005 |
0.15685 |
0.16457 |
0.07199 |
0.12852 |
0.13413 |
0.14090 |
0.14657 |
|
0.08976 |
0.16571 |
0.17160 |
0.17768 |
0.18438 |
0.09103 |
0.14668 |
0.15128 |
0.15801 |
0.16331 |
|
0.10979 |
0.18475 |
0.19035 |
0.19589 |
0.20274 |
0.11007 |
0.16217 |
0.16743 |
0.17302 |
0.17804 |
|
0.13074 |
0.20347 |
0.20807 |
0.21333 |
0.22007 |
0.12977 |
0.17773 |
0.18205 |
0.18751 |
0.19243 |
|
0.15169 |
0.22033 |
0.22504 |
0.22981 |
0.23495 |
0.14947 |
0.19117 |
0.19590 |
0.19988 |
0.20542 |
Table 3: (B), (A), dB/dT, (ΔG), (ΔH), and (ΔS) values for sodium and potassium leucinate in water at different temperatures.
|
Parameter |
298.15 K |
308.15 K |
308.15 K |
313.15 K |
298.15 K |
303.15 K |
308.15 K |
313.15 K |
|
sodium leucinate |
potassium leucinate |
|||||||
|
B |
0.60587 |
0.59228 |
0.5784 |
0.56508 |
0.5339 |
0.52163 |
0.50942 |
0.49762 |
|
A |
-0.01572 |
-0.00597 |
0.00429 |
0.01531 |
-0.0148 |
-0.00591 |
0.00392 |
0.01308 |
|
dB/dT |
-0.0027244 |
-0.0024522 |
||||||
|
ΔG |
104.6072 |
104.1042 |
103.4897 |
102.9127 |
96.2864 |
95.8459 |
95.3761 |
94.8414 |
|
ΔH |
138.6106 |
124.9556 |
||||||
|
ΔS |
-0.11396 |
-0.09608 |
||||||
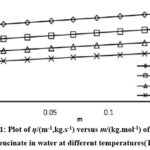 |
Figure 1: Plot of η/(m-1,kg.s-1) versus m/(kg.mol-1) of sodium leucinate in water at different temperatures (T). |
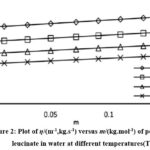 |
Figure 2: Plot of η/(m-1,kg.s-1) versus (m/kg.mol-1)0.5 of potassium leucinate in water at different temperatures (T) |
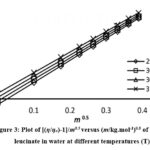 |
Figure 3: Plot of [(η/ηo)-1]/m0.5 versus (m/kg.mol-1)0.5 of potassium leucinate in water at different temperatures (T) Click here to View figure |
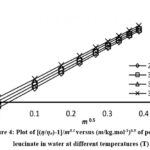 |
Figure 4: Plot of [(η/ηo)-1]/m0.5 versus (m/kg.mol-1)0.5 of potassium leucinate in water at different temperatures (T) |
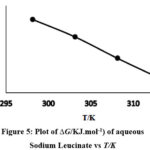 |
Figure 5: Plot of ∆G/KJ.mol-1) of aqueous Sodium Leucinate vs T/K |
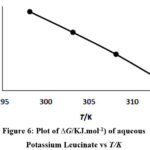 |
Figure 6: Plot of ∆G/KJ.mol-1) of aqueous Potassium Leucinate vs T/K |
The observations of above Tables and Figures shows that
Viscosity of aqueous solution of sodium and potassium salt of leucine increases with increase in the concentration of sodium and potassium of salt amino acid.
Viscosity decreases with an increase in the temperature. Temperature increases cause thermal energy to rise, which causes the breakdown of amino acid salt/water aggregates.
Conclusion
B value for sodium and potassium salt of leucine decreases as the temperature rises. The positive B and ΔG values indicate strong water and amino acid salt interactions. The negative value of (dB/dT) for investigated amino acid salt -water systems confirms structure making behavior of studied amino acid salts. As a result, it can be said that sodium and potassium salt of leucine is a water structure maker.
Reported data and the related parameters presented in this work may be helpful in the design, improvement, and evaluation of techniques and processes that use the amino acid salt systems for CO2 capture.
Acknowledgment
Author wants to thank the Director of Government Vidarbha Institute of Science, and Humanities, Amravati for permission for the research facility and the Principal, HPT Arts and RYK Science College of Nashik for his kind support.
References
- Alcalde, J.; Flude, S.; Wilkinson, M.; Johnson, G.; Edlmann, K.; Bond, C. E.; Haszeldine, R. S. Nature communications, 2018, 9(1), 1-13.
CrossRef - Olivier, J. G. J.; Peters, J. A. H. W. Trends in global CO2 and total greenhouse gas emissions. PBL Netherlands Environmental Assessment Agency: The Hague, The Netherlands, 2020.
- Ping, T.; Dong, Y.; Shen, S. ACS Sustainable Chemistry & Engineering, 2020, 8(49), 18071-18082.
CrossRef - Vitillo, J. G.; Smit, B.; Gagliardi, L. Chemical Reviews, 2017, 117(14), 9521-9523.
CrossRef - Liu, M.; Gadikota, G. Fuel, 2020, 275, 117887.
CrossRef - Xu, X.; Myers, M. B.; Versteeg, F. G.; Adam, E.; White, C.; Crooke, E.; Wood, C. D. Journal of Materials Chemistry A, 2021, 9(3), 1692-1704.
CrossRef - Chang, Y. T.; Leron, R. B.; Li, M. H. The Journal of Chemical Thermodynamics, 2015, 83, 110-116.
CrossRef - Garcia, A. A.; Leron, R. B.; Soriano, A. N.; Li, M. H. The Journal of Chemical Thermodynamics, 2015, 81, 136-142.
CrossRef - Meng, X.; Duan, C.; Xu, C.; Fang, D. Chemical Thermodynamics and Thermal Analysis, 2022, 5, 100025.
CrossRef - Mondal, B. K.; Samanta, A. N. Chemical Engineering Journal, 2020, 386, 121462.
CrossRef - Guo, H.; Li, H.; Shen, S. Energy and Fuels, 2018, 32(6), 6943-6954.
CrossRef - Garg, S.; Shariff, A. M.; Shaikh, M. S.; Lal, B.; Aftab, A.; Faiqa, N. Chemical Engineering Research and Design, 2016, 113, 169-181.
CrossRef - Li, H.; Shen, S. Industrial & Engineering Chemistry Research, 2019, 58(23), 9875-9882.
CrossRef - Li, H.; Guo, H.; Shen, S. The Journal of Chemical Thermodynamics, 2020, 150, 106237.
CrossRef - Einfeldt, J. Metrologia, 2001 38(5), 459.
CrossRef - Wankhede, D. S.; Lande, M. K.; Arbad, B. R. Journal of Chemical & Engineering Data, 2005, 50(1), 261-263.
CrossRef - Jones, G.; Dole, M. Journal of the American Chemical Society, 1929, 51(10), 2950-2964.
CrossRef

This work is licensed under a Creative Commons Attribution 4.0 International License.


