Optical Parameters of Amorphous Ge-Te-Se Films from Ellipsometric Measurements
Sultan Alomairy
Department of physics, Faculty of Science, Taif University, Taif 888, KSA
Corresponding Author E-mail: s.alomairy@tu.edu.sa
DOI : http://dx.doi.org/10.13005/ojc/360112
Article Received on : 23 Dec 2019
Article Accepted on : 25 Jan 2020
Article Published : 06 Feb 2020
In present work, Variable Angle Spectroscopic Ellipsometer (VASE) is used to determine the optical properties of thermally evaporated thin films Se15Te62.5Ge22.5 and Se10Te67.5Ge22.5 from 0.8 to 5.1 eV. The experimental data of VASE parameters were fit using two group of models to extract the dielectric function. First group consist from mixtures of several Gaussian, and one Tauc–Lorentz (TL group ). The other group is a mixed from several Gaussian and one Cody-Lorentz dispersion functions (CL group). The models’ factors such as resonance, optical band gap, Urbach energies, oscillator's amplitude and width for both Se15Te62.5Ge22.5 and Se10Te67.5Ge22.5 films were estimated. Extinction coefficients and refractive indices as function of photon energy of the films were calculated. Both models perform very equally and precisely adequate to the experimental data. However the CL model shows a good accuracy in recounting dielectric function at the beginning absorption area.
KEYWORDS:Cody-Lorentz; Oscillator's Amplitude; Optical Band Gap; Thin Films; Tauc–Lorentz; Variable Angle Spectroscopic Ellipsometer.
Download this article as:| Copy the following to cite this article: Alomairy S. Optical Parameters of Amorphous Ge-Te-Se Films from Ellipsometric Measurements. Orient J Chem 2020;36(1). |
| Copy the following to cite this URL: Alomairy S. Optical Parameters of Amorphous Ge-Te-Se Films from Ellipsometric Measurements. Orient J Chem 2020;36(1). Available from: https://bit.ly/2unPD2g |
Introduction
Chalcogenide semiconducting glasses have an interesting optical properties. These properties include high linear, nonlinear refractive index, broad infrared transparency and low photon energies [1]. Accordingly, many technological applications emerges, including data storage, fiber optics, memory devices, flexible phase change and other optoelectronic applications [2 -6].
To the author knowledge, most of optical investigations are carried out by spectrophotometer technique (ST). The data obtained by ST usually analyzed by means of Swanpole method [7, 8]. The Swanpole’s method is frequently used in connection with Cauchy equation [9]. The Cauchy equation itself is an experimental formula which recounts the refractive index to the photon energy through some factors that have physical meaningless. Moreover, this equation cannot be considered as Kramers-Kroning (KK) consistent. It should be mentioned that in the KK consistent models, the refractive index cannot be estimated without the extinction coefficient value is identified.
Alternatively, spectroscopic ellipsometry (SE) emerges as effective tools for examining the optical properties of films. The ellipsometric devices are rapid, nondestructive tools. Moreover it is actual subtle to the occurrence of surface sheets and it grip advanced precision for resolving of the optical properties and thickness of thin film in contrast to the spectrophotometric technique [10, 11]. To acquire precise factors from SE, choosing a suitable dispersion model is essential. For amorphous materials Tauc–Lorentz (TL) and Cody–Lorentz (CL) models, which are KK consistent, are proper for inspecting SE results [12-15].
Selenium and tellurium are used in several electronic applications. Although telluride based glassy compositions deal as IR transmission and display optical phase recording, the glass forming ability is very low. Similarly, selenium is a proper glass former but shows low glass stability. Therefore, Se-Te alloys has been exposed to be improved properties in terms of crystallization, transmittance, hardness, ageing, than the pure form of Se and Te. [16-27]. Se-Te -based chalcogenide glasses is supposed to be a stimulating glass due to its important applications nevertheless, it has low sensitivity and small lifetime consequently numerous researchers have engaged definite additives such as Ge, Bi and Sn. The adding of the third element might increase thermal stability, generate topological and chemical disorder in Te–Se alloys[28, 29].
The addition of Ge to Se-Te medium overwhelms the disadvantages of the binary Se-Te alloy. Ge cross-links with the Se chain alter the bonds, then enhances the glass formation region. Furthermore, the size and the electronegativity of Ge-Se-Te medium elements are well-matched and therefore, outcomes in high-quality established melts [30, 31]. In this work, the optical parameters of the prepared thin films of Se15Te62.5Ge22.5 and Se10Te67.5Ge22.5 were obtained using variable angle spectroscopic ellipsometry (VASE) method. Furthermore, summation of a number of dispersion equations were employed to designate the optical parameters over the measured spectral range.
Theory
Spectroscopic Ellipsometry (SE) treaties with the variation light polarization that is reflected or transmitted through a film. The polarization variation is designated by phase difference (Δ) and amplitude ratio, (Ψ), between light concerned with in the p- and s- directions relative to the film surface:
![]()
where rs and rp characterize the complex Fresnel quantities for p- and s- polarizations, respectively. A common relation between the SE results (Ψ,Δ) and a (real and imaginary) dielectric function [10] is following formula:

where Φa is the incident light angle and εa (≈ 1) is the dielectric function of the ambient. It should be mentioned that the refractive (n) index and extinction coefficient (k) can be obtained from the real and imaginary part of the dielectric function via the subsequent relations


The values of absorption coefficient α (E) and normal- incident reflectivity R(E) of the films can be obtained by


Experimental
Glasses of the Se15Te62.5Ge22.5 and Se10Te67.5Ge22.5 were fabricated as bulk using the melt-quenching method. Elements (Se, Te and Ge) with purity (5N) were used to produce the bulk glasses. The total weight of mixture for both samples was 8 gm and placed in silica tubes and the tubes were evacuated of the order of 10-5 Torr. Then the tubes were transferred into a furnace at 1000°C for 4 h through continuous shaking. The tubes were suddenly lay in cold water (at 0ºC) to produce bulk glass.
Thin films were arranged from the obtained bulk configurations using a thermal evaporation method. Ground bulk samples were evaporated from a molybdenum boat and deposited on BK7 glass substrates at room temperature. One evaporator source Edwards E306A have been employed at pressure <10-6 Torr.
Optical functions were measured via Woollam Variable Angle Spectroscopic Ellipsometer (VASE) system. Measured quantities were obtained in the range of wavelength from 245nm to 1500 nm, at 55º, 65º and 75ºangle of incidence at room temperature. The accrued data from VASE was analyzed using the WVASE32 software [32]. In the current investigation, merely the mean squared error (MSE) is employed as reference to validate the variance between the experimental data and the model anticipated results. The lowest MSE’s value the superior correct is acquired. The dielectric data is explained by a summation of optical dispersion oscillators.
Results and Discussion
The X-ray diffraction (XRD) technique was employed in order to examine the amorphous nature of Se15Te62.5Ge22.5 and Se10Te67.5Ge22.5. films. Note that the occurrence of peaks on XRD pattern are denoted to incident beam reflection from the lattice planes. Fig. 1 displays the XRD pattern of as-deposited Se15Te62.5Ge22.5 and Se10Te67.5Ge22.5 films. The nonappearance of peaks for present samples approves the non-crystalline nature of the films.
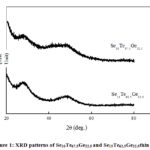 |
Figure 1: XRD patterns of Se10Te67.5Ge22.5 and Se15Te62.5Ge22.5thin films. |
Figs. 2 and 3 characterizes the VASE results of Ψ and Δ (open circles) for Se15Te62.5Ge22.5 and Se10Te67.5Ge22.5. thin films, respectively. The results designate almost entirely absorbed incident light on the films in the range of wavelengths below 715 nm and 773 nm for Se15Te62.5Ge22.5 and Se10Te67.5Ge22.5, respectively. Transmission is found to be occurs beyond the stated wavelengths where typical fluctuation occurs in the Ψ and Δ Curves.
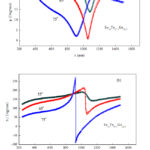 |
Figure 2: (a, b) VASE data points (open circles) and modeled (solid curves) |
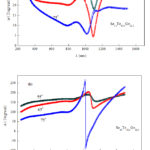 |
Figure 3: (a, b) VASE data points (open circles) and modeled (solid curves) |
The experimental data of the dielectric function spectra (ε1 and ε2) represented in Figs 4 and 5 of an as-deposited Se15Te62.5Ge22.5 and Se10Te67.5Ge22.5 thin films, respectively. The data is shown as open circles. It can be noted from these figures that both ε1 and ε2 spectrum are composed from number of dissimilar wide peaks. This characterization of ε1 and ε2 spectrum is tough to appropriate by single desperation model. Accordingly it appearances to be sensible to designate the dielectric function of the current films by mixture of several oscillator functions.
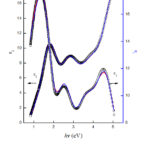 |
Figure 4: Validation of model fits to measured dielectric function data |
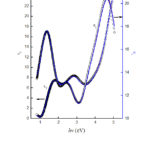 |
Figure 5: Validation of model fits to measured dielectric function data |
It should be mentioned that the imaginary part of the dielectric function, ε2, is assumed to be as the multiplying variable band edge function by Lorentz oscillator. The variable band edge functions for semiconductors were proposed by Tauc–Lorentz (TL) [12, 13] and Cody–Lorentz (CL) [14, 15] were exposed to be proper to account of optical responses in disordered semiconductors. The expression of the ε2, according to TL given as:


where, E0,and Eg are the peak transition energy and optical band gap energy. On the other hand A, and C are Amplitude and width of Lorentz oscillator. However, for CL model is given as


where Et, is a change energy between the band-to-band and Urbach tail transitions, Eu signifies the range of enlargement and Ep an alteration energy that splits the absorption beginning manners from the Lorentzian manners.
The summation of dispersion functions employed at this point contain one TL function with several Gaussian -formed functions or one CL function with several Gaussian -formed functions. Above statement can be expressed as follows.


The eqs. 11 and 12 will be denoted as TL-group and CL-group, respectively. In Figs. 4 and 5, the data point of imaginary and real parts of dielectric functions of Se15Te62.5Ge22.5 and Se10Te67.5Ge22.5 were fit by means of grouping of one TL (CL) and three Gaussian functions. It can be noted that the TL and CL oscillators functions were active to fit the essential band gap whereas the Gaussian functions were working to represent the molecular and lattice vibrations or in the infrared and ultraviolet sections.
In Figs.4 and 5, the dashed and solid curves signifies fitting via TL-group and CL-group. It is clear from these figures that a plausible fitting between experimental data and constricted oscillators group for dielectric function acquired for the two groups labeled beforehand. The surface roughness and thicknesses of the Films are the same for the TL and CL group. The oscillators parameters for as-prepared Se15Te62.5Ge22.5 and Se10Te67.5Ge22.5 films by both groups are given in Table 1.
Table 1: Oscillator coefficients for present samples where, E0, Eg are the peak transition energy and optical band gap energy. A, and C are Amplitude and width of oscillator.
|
PARAMETER |
CL+nG for Se15Te62.5Ge22.5 |
TL+nG for Se15Te62.5Ge22.5 |
CL+nG for Se10Te67.5Ge22.5 |
TL+nG for Se10Te67.5Ge22.5 |
|
MSE |
2.962 |
2.989 |
5.885 |
6.164 |
|
Roughness. (nm) |
2.41 |
2.35 |
1.83 |
1.79 |
|
Film thickness (nm) |
283.63 |
284.82 |
134.95 |
134.84 |
|
A1 |
24.47 |
45.2 |
24.01 |
21.5 |
|
C1 (eV) |
1.325 |
1.25 |
1.093 |
1.95 |
|
Eo1(eV) |
1.652 |
1.67 |
1.705 |
1.93 |
|
Eg1(eV) |
0.886 |
0.93 |
0.698 |
0.51 |
|
Ep1(eV) |
0.986 |
– |
1.106 |
– |
|
Et1(eV) |
0 |
– |
0.349 |
– |
|
Eu1(eV) |
2 |
– |
0.063 |
– |
|
A2 |
1.63 |
1.60 |
1.73 |
4.57 |
|
C2(eV) |
0.489 |
0.66 |
0.7251 |
0.71 |
|
Eo2(eV) |
0.541 |
0.41 |
1.211 |
1.72 |
|
A3 |
4.28 |
4.82 |
4.38 |
4.93 |
|
C3(eV) |
0.85 |
0.88 |
0.87 |
0.903 |
|
Eo3(eV) |
2.86 |
2.88 |
2.71 |
2.73 |
|
A4 |
6.56 |
4.84 |
6.62 |
6.47 |
|
C4(eV) |
1.64 |
1.13 |
1.41 |
1.28 |
|
Eo4(eV) |
4.14 |
3.9 |
3.8 |
3.8 |
|
Amp5 |
23.81 |
25.68 |
16.10 |
15.44 |
|
Br5(eV) |
1.26 |
1.44 |
1.24 |
1.16 |
|
En5(eV) |
5.27 |
5.27 |
5.17 |
5.11 |
When the model fits the experimental results as closely as possible, the value of MSE displays a minimum value. We note from Table I that the values of MSE CL- group for the two films are sound and lesser than its corresponding of TL-group. Therefore, we can consider CL- group as more appropriate to model the present films than TL- group. The data measured by SE is fairly sensitive to surface constructions thus it should be combine surface roughness in the data analysis optical model. The effective medium approximation (EMA) fairly represent surface roughness. In examining surface roughness using EMA, it is essential that the surface roughness be fewer than λ /10 of the wavelength.
The resulting fit to pesodielectric functions using the preceding oscillators groups leads to fits Δ and Ψ. The solid curves in Figs.2 and 3 signify the fitting using CL group. It would be stated that the linear summation from some equations have been employed with obvious productively to fit the dielectric spectra for some amorphous films [33-35].
For industrial functions, the extinction coefficient (k) and the refractive index (n) obtained by the above mentioned analysis of VASE data are greatly important. The wavelength dependence of n and k for the as-prepared Se15Te62.5Ge22.5 and Se10Te67.5Ge22.5 thin films be present in Figs. 6 and 7. It should be mentioned that the Cauchy equation could be designated optical functions in the transparent region properly. For the present samples, simple Cauchy model can be only suitable for wavelength above 850 and 920 nm for Se15Te62.5Ge22.5 and Se10Te67.5Ge22.5, respectively. The estimated values of the absorption coefficient typically to CL group as a function of photon energy for Se10Te67.5Ge22.5 and Se15Te62.5Ge22.5films are shown in Fig. 8. Similar behavior can be noted in the onset absorption edge.
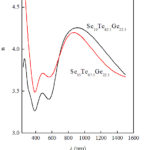 |
Figure 6: Refractive index (n) as function in wavelength (l) |
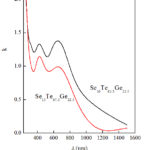 |
Figure 7: Extension coefficient (k) as function in wavelength |
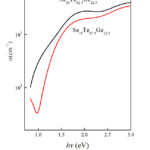 |
Figure 8: Variation of the estimated value of absorption coefficient based on |
The essential energy gap Eg of the films can be also estimated from the variation of the absorption coefficient with the incident photon energy (hv) using the relation [36]

where B is an energy independent constant and r is an exponent which can be expected to have several values depend on the origin of electronic shift. For amorphous semiconductors, the exponent r is equal 2. Fig. 9 displays the variation of (ahv)1/2 with photon energy for as-prepared Se15Te62.5Ge22.5 and Se10Te67.5Ge22.5 films. The essential energy gap Eg can be achieved from the intercept of the prolonged straight lines with the hv axes i.e, (ahv)1/2 =0. Both Eg and constant B estimated and found to be 0.95 eV and 6.64 x102 cm-1eV-1 for Se15Te62.5Ge22.5 however for Se10Te67.5Ge22.5 are 0.62 eV and 4.63 x102 cm-1eV-1.
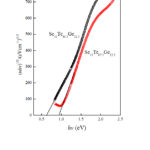 |
Figure 9: Absorption coefficient plotted as (αhv)1/2 against photon energy |
Conclusion
In conclusion, we investigate the optical parameters of Se15Te62.5Ge22.5 Se10Te67.5Ge22.5 using variable angle spectroscopic ellipsometry. The films were prepared using thermal evaporation method. The outcomes described in present paper showed that the amorphous nature of the prepared films that was confirmed through X-ray diffraction. To fit the ellipsometry data linear summation from Cody-Lorentz (Tacu- Lorentz) with further Gaussian oscillators were employed to calculate the optical parameters. It was found that the values of band gap energy 0.95 eV and 0.62 eV for Se15Te62.5Ge22.5 and Se10Te67.5Ge22.5, respectively.
Acknowledgements
This study was funded by the Deanship of Scientific Research, Taif University, KSA [research project number 1-438-5991].
References
- Seddon, A.B. Non-Cryst. Solids. , 1995, 184, 44-50.
CrossRef - Nermec, P.; Frumar, M.; Jedelsky,J; Jelinek, M.; Lancok,J.; Gregora,I. Non-Cryst. Solids. , 2002, 302, 1013.
CrossRef - Kamboj, M.S.; Kaur, G.; Thangaraj, R. Thin Solid Films. , 2002, 350, 420.
CrossRef - Tanaka, K. Current Opinion in Solid State & Materials Science. , 1996, 1, 567.
CrossRef - Zakery, A.; Elliott, S.R. Non-Cryst. Solids. , 2003, 330, 1–12.
CrossRef - Kolobov, A.V, Photo-Induced Metastability in Amorphous Semiconductors,Wiley-VCH., 2003.
CrossRef - Swanepoel, R. Phys. E: Sci. Instrum., 1983, 16, 12142.
CrossRef - Swanepoel. R, Phys. E: Sci. Instrum., 1984, 17, 896.
CrossRef - Abdel-Wahab, F.; Ali karar, N.N.; El Shaikh, H.A.; Salem, R.M. Physica B., 2013, 422, 40.
CrossRef - Azzam, R.V.A.; Bashara, N.M. Ellipsometry and Polarized Light (North-Holland, Amsterdam, 1977). , 1977, p. 269.
CrossRef - Ward, L. Appl. Phys., 1984, 17, 1781.
CrossRef - Jellison, G. E. and Modine, F. A. Phys. Lett. ,1996, 69, 371
CrossRef - Jellison, G. E and Modine, F. A. Phys. Lett. ,1996, 69, 2137.
CrossRef - Cody, G. D. in Semiconductors and Semimetals. , 1984, 21B, 11.
CrossRef - Ferlauto, A. S.; Ferreira, G. M.; Pearce, J. M.; Wronski, C. R.; Collins, R. W.; Deng. X. M.; Ganguly, G. Appl. Phys., 2002, 92, 2424.
CrossRef - Ležal, D.; Kašik, J.; Gotz. J. Non-Cryst. Solids. , 1987, 90, 557.
CrossRef - Trnovcova, V.; Pažurova, T.; Šramkova. T.; Ležal, D. Non-Cryst. Solids. , 1987, 90 561.
CrossRef - Adam, J.L. Rev., 2002, 102, 2461.
CrossRef - Zavadil, J.; Kostka, P.; Pedlikova, J.; Zdansky, K.; Kubliha, M.; Labas, V.; Kaluzny, J. Non-Crystalline Solids. , 2009, 355, 2083–2087.
CrossRef - Xin Jiang, Animesh Jha, Sensors and Actuators B., 2015, 206, 159–169.
CrossRef - Cheruvalath, A.; Sebastian, I.; Sebastian, M.; Nampoori, V.P.N.; Thomas, S. Optical Materials., 2017, 72, 265.
CrossRef - Wang, G.; Nie, Q.; Wang, X.; Dai, S.; Xu, T.; Shen, X.; Zhang, X. Physica B., 2010, 405, 4424–4428.
CrossRef - Kubliha, M.; Kostka. P.; Trnovcova, V.; Zavadil, J.; Bednarcik, J.; Labaš, V.; Pedlikova, J.; Dippel, A.;-Ch, Liermann. H.; Psota, J. All. Comp., 2014, 586, 308.
CrossRef - Mohamed, M.; Abdel-Rahim, M.A. Sci. Semic. Proces. , 2014, 27, 288.
CrossRef - Černošek, Z.; Černošková, E.; Hejdová, M.; Holubová, J.; Todorov, R. Journal of Non-Crystalline Solids. , 2017, 460, 169–177.
CrossRef - Vinod, E.M.; Sangunni, K.S. Thin Solid Films. , 2014, 550, 569–574.
CrossRef - Rao, V.; Mehta, N.; Dwivedi, D. Res. Innov., 2019, 23, 141-148.
CrossRef - Abdel-Wahab, F. Physica B., 2011,406, 1053–1059.
CrossRef - Wang, G.; Nie, Q.; Wang, X.; Dai, S.; Xu, T.; Shen, X.; Zhang, X. Physica B.,2010, 405, 4424.
CrossRef - Yin, N.; Xu, J.; Chang, F.; Jian, Z.; Gao, C. Infrared Phys. Technol., 2019, 96, 361-365.
CrossRef - Hosseinkhani, A.; Tavoosi, M.; Ghasemi, A. Infrared Phys. Technol., 2017,85, 421- 430.
CrossRef - Guide to Using WVASE 32, J.A. Woollam Co., Inc., Lincoln NE.
CrossRef - Abdel-Wahab, F.; Merazga, A.; Rasheedy, M.S.; Montaser, A.A. Optik., 2016, 127, 3871.
CrossRef - Abdel-Wahab,F.; Badawi, A.; Alatibi, M.S.; Alomairy, S.E.; Ashraf, I.M.; Ahmed, E.M. , 2017,147, 59.
CrossRef - Abdel-Wahab, F.; Ashraf, I.M.; Alomairy, S.E. Physica B, . 2018,530, 300.
CrossRef - Tauc, J. Tauc (Ed.), Amorphous and Liquid Semiconductors, Plenum, New York. , 1974, p. 159.
CrossRef

This work is licensed under a Creative Commons Attribution 4.0 International License.


