Phenolic Analysis and Characterization of Palm Sugar (Arenga Pinnata) Produced by the Spray Dryer
Department of Chemical Engineering, Universitas Sultan Ageng Tirtayasa Jl. Jendral Sudirman km.3 Cilegon, Indonesia.
Corresponding Author E-mail: jayanudin@untirta.ac.id
DOI : http://dx.doi.org/10.13005/ojc/350116
Article Received on : 13-12-2018
Article Accepted on : 05-01-2019
Article Published : 14 Feb 2019
The effect of spray dryer inlet temperature on characterization and total phenolic content of palm sugar has been studied. The spray dryer operating conditions used were 160 ̶ 220°C inlet temperature with a feed flow rate of 2 L/hour, while for outlet temperature was 85°C. The high inlet temperature produced a higher crystallinity of sucrose and did not agglomerate and not sticky. However, the high temperature of the spray dryer inlet produced palm sugar that was browner than the low temperature one. The effect of increasing temperature of spray dryer produced irregular total phenolic. The total phenolic at 220°C was higher than 200°C. Likewise, the temperature of 180°C generated total phenolic was higher than the temperature of 160°C. The total phenolic of palm sugar analyzed in this study was quite large within the range of 49 ± 0.01 to 63.6 ± 0.01 mg of GAE/100 g samples.
KEYWORDS:Palm Sap; Palm Sugar; Spray Dryer; Total Phenolic
Download this article as:| Copy the following to cite this article: Jayanudin J, Kurniawan T, Kustiningsih I. Phenolic Analysis and Characterization of Palm Sugar (Arenga Pinnata) Produced by the Spray Dryer. Orient J Chem 2019;35(1). |
| Copy the following to cite this URL: Jayanudin J, Kurniawan T, Kustiningsih I. Phenolic Analysis and Characterization of Palm Sugar (Arenga Pinnata) Produced by the Spray Dryer. Orient J Chem 2019;35(1). Available from: https://bit.ly/2S1rJ2b |
Introduction
Arenga pinnata contains the sap that has a sweet and pleasant taste. The sweet taste of palm sap because of the high sugar content (93 g/100 g of dry matter) such as sucrose, glucose, fructose, and maltose. In addition, the palm sap contains protein (5 g/100 g dry matter basis) and mineral elements.1 Palm sap is also beneficial for health, palm juice contains phenolic compounds of 246 mg of gallic acid/100 g. Phenolic compounds in juice are useful for preventing several chronic diseases, such as cancer, Parkinson’s disease, heart disease, etc.1 The weakness of palm juice is easily damaged and deteriorated due to Saccharomyces cerevisiae contamination. Lime and jackfruit tree bark is traditionally added to preserve the palm sap from deterioration. Arenga palm sap is widely used as a material for palm sugar production using traditional methods. The palm sap is crystallized in a pan with direct heating. The phenolic compounds in palm sugar can be destroyed due to open heating with high temperatures.2 Sugar processing requires proper technology to minimize the loss of bioactive components from the palm sap.
Traditional palm sugar processing by using open pan evaporator produced sugar with brown color because of high temperature and long heat treatment which favored browning and Maillard reactions.3,4 Another disadvantage is that it leads to higher sucrose inversion and hydroxy methyl furfural formation with less glucose and fructose. A vacuum evaporator that uses lower temperatures could reduce the sucrose inversion. Every technology used to produce palm sugar has advantages and disadvantages. The choice of technology to produce palm sugar depends on its purposes. Palm sugar produced with open pan evaporator and vacuum evaporator may not be suitable for pharmaceutical requirements because of low phenolic content. One technology that can be used is spray dryer. Palm sugar produced using spray drying technology is able to produce a higher total phenolic than a vacuum evaporator. This total phenolic value correlates positively with antioxidant activity. The higher total phenolic content leads to the greater the antioxidant activity.
Spray dryer technology has the advantage of being able to maintain the antioxidant content starting from palm sap to the crystallized palm sugar form. Temperature changes in producing palm sugar can affect the phenolic content of palm sugar. The study reported by Aeimsard et al,5 increased the evaporator temperature from 40°C to 60°C causing the phenolic content decrease from 16.29 ± 0.53 to 4.04 ± 0.58 (mg of gallic acid/100 g). The phenolic content of palm sugar using spray drying method was 57.43 ± 3.4 to 63.72 ± 4.7 (mg of FAE/100 g of sap) using a temperature of 136.36°C–203.64°C.1 Although using a higher temperature the phenolic content of palm sugar with a spray dryer is still higher. This is because of the contact between the palm sap droplet with hot air occurs very quickly which minimize the loss of phenolic content in sugar. The temperature of the spray dryer could affect phenolic contents in palm sugar. In addition, the temperature of the spray dryer also affects the characteristics of palm sugar, such as the color of sugar, crystallization of sucrose, and the morphology of palm sugar. This study aims to determine the characterization of palm sugar and phenolic content on the temperature effect of spray dryers.
Materials and Methods
Materials
Palm sap was obtained from local palm sugar farmer in Mancak, Banten Province–Indonesia, methanol was provided from Merck, Folin–Ciocalteu reagent was obtained from Merck (Darmstadt, Germany) used to the analysis of the total phenolic content of palm sugar and used to a standard calibration curve was prepared using different concentrations of gallic acid in methanol. The spray dryer set up was manufactured in Chemical Engineering Unit Operations Laboratory, Universitas Sultan Ageng Tirtayasa as seen in Figure 1.
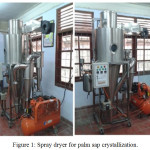 |
Figure 1: Spray dryer for palm sap crystallization. |
Production of Palm Sugar using Spray Dryer Technology
Palm sap obtained from a farmer was then filtered to remove insects and other impurities. Palm sugar was put into the spray dryer feed tank. The initial stage was flowing air and contact with a heater which was set at 140°C for the inlet temperature of a spray dryer and the outlet temperature was 85°C. Palm sap was flowed at 2 L/hour from the feed tank to the nozzle to be atomized and contacted with hot air. The powder of palm sugar formed was stored in the product tank. The same step was used to produce sugar with the inlet temperature were 160°C, 180°C, 200°C, and 220°C. The palm sugar formed was analysed for changes in phenolic content and characterized using SEM, FTIR, and XRD.
Characterization of Palm Sugar
X–Ray Diffraction (XRD) Analysis
Sugar crystallinity samples were studied by using powder X–ray diffraction (XRD, Shimadzu 7000 Maxima–X). Radiation of Cu–Kalpha was used for the sample analysis. The scanning rate was 2°C/min from 2θ of 2°C to 90°C with a step size 0.02°C.
Fourier Transform Infrared Spectroscopy (FTIR) Analysis
Functional group analysis of palm sugar was analysed by Fourier transform infrared spectroscopy (FTIR) from spectrophotometer Shimadzu IR, KBr Pellet: Absorbance of IR by Solid samples are measured in KBr pellets, which is prepared by pressing mixture of 1:100 solid sample: KBr, wave number operated with a range between 400 and 4000 cm-1.
Scanning Electron Microscope (SEM)
Morphological analysis of palm sugar was used a scanning electron microscope (SEM) with JEOL JSM–6510 LV type. Palm sugar powder coated with platinum, acceleration voltage: 0.5 to 30 kV, with a high resolution of high vacuum mode: 3.0 nm at 30 kV and low vacuum mode: 4.0 nm (30 kV).
Analysis of Total Phenolic Palm Sugar
Analysis of total phenolic palm sugar referred to the study reported by Maurya and Singh6 and Abdelhady et al.7 The Folin–Ciocalteu reagent was used to analysis total phenolic of palm sugar. Gallic acid used as a standard and total phenolic was expressed as mg gallic acid equivalent/g sample (mg GAE/g sample). Palm sugar was prepared in methanol and each sample was put into a test tube and mixed with 2.5 mL of a 10–fold dilute Folin–Ciocalteu reagent and 2 mL of 7.5 % sodium carbonate. The test tube was closed and let stand for 30 min. at room temperature. The samples were analysed using a UV–vis spectrophotometer with a wavelength of 760 nm. The Folin–Ciocalteu reagent was sensitive to polyphenol content resulting in a blue color during a reaction. The blue colour was measured spectrophotometrically and total phenolic content can be determined.
Results and Discussion
Effect of Spray Dryer Temperature on the Colour of Palm Sugar
The discoloration of palm sugar caused by the temperature difference of the spray dryer can be seen Figure 2.
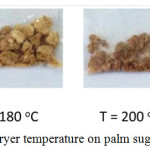 |
Figure 2: The Effect of spray dryer temperature on palm sugar colour. |
Figure 2 showed that the temperature of the spray dryer 220°C produces palm sugar which was darker than at temperatures of 160°C, 180°C, and 200°C. It could be concluded that increased the spray dryer temperature made the colour of palm sugar browner. Maillard reaction is reaction between reducing sugars and especially free amino acids and peptides (usually proteins) when heated. Maillard reaction is complex reactions that depend on factors such as pH and temperature. Illustration of Maillard reaction can be seen in Figure 3.
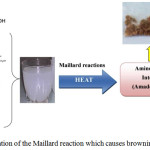 |
Figure 3: Illustration of the Maillard reaction which causes browning of palm sugar. |
High temperatures and long heat treatment cause higher inversions of sucrose formation and furfural hydroxymethyl with little glucose and fructose
Maillard browning caused a decrease in the quality of the original protein structure (primary, secondary and tertiary) and hence reduces functionality (such as solubility). Browning with Maillard reactions occurs faster in alkaline than in acid conditions and also at intermediate water activity. Maillard browning produces browning of the sugar, and loss of essential amino acids, lysine, digestibility, and solubility.8,9
Palm sugars produced from the spray dryer temperature were 160°C, 180°C, and 200°C stick together and form large lumps. While at a temperature of 220°C it produced palm sugar powder that did not stick together as shown in Figure 2. Cohesion–adhesion properties that cause the palm sugar powder to become sticky. Cohesion is an internal property that leads to the formation of large lumps caused by the attraction between particles (particle–particle stickiness). Adhesion is an interfacial property and the tendency of particles to stick with the spray dryer wall. Adhesion–cohesion force factors are a consideration in designing spray dryers to overcome the stickiness problem. Other factors that cause stickiness in the production of sugar using spray dryers are high hygroscopicity, thermoplasticity and low glass transition temperature (Tg) from low molecular weight substances.10
Another factor that caused palm sugar to stick was amorphous glass state. In the drying process, the viscosity and surface tension become very high around the level of critical water activity which depended on composition and temperature. The state of high viscosity/high surface tension was referred to as a rubbery state. Further drying leads to the presence of solid glass that is not sticky. There is a region between rubbery and non–sticky states called the glass transition region. The problem of stickiness in spray drying between the powder and equipment surface was related to the glass transition state, or sometimes called the plastic state.11 The high–temperature of spray dryer was needed to produce powdered palm sugar that non–sticks together but could cause browning and reduce its phenolic content.
Characterization of Palm Sugar from A Spray Dryer
FTIR Analysis
FTIR analysis was performed to determine the chemical structure of palm sugar from a spray dryer. Palm sugar analysed was from a spray dryer that used temperatures of 180°C and 220°C. This difference was used to determine the chemical structure changes as a result of increased temperature. Figure 4 presented analysis of FTIR for palm sugar from spray dryer and compared with commercial palm sugar which was traditionally processed.
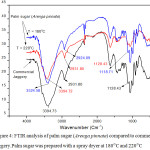 |
Figure 4: FTIR analysis of palm sugar (Arenga pinnata) compared to commercial jaggery. Palm sugar was prepared with a spray dryer at 180°C and 220°C. |
Analysis of Fourier Transform Infra–Red (FTIR) Spectrophotometer was used to determine the difference in peak absorbance of functional groups from palm sugar resulting from the difference of spray dryer inlet temperature and compared with commercial jaggery as shown in Figure 4. Peak absorbance of palm sugar functional groups from 220°C spray dryer temperature was the same as commercial jaggery. The peak absorbance of palm sugar was produced from a spray dryer at 180°C which has a shift in the peak absorbance of the functional group. The peak absorbance of functional groups produced from palm sugar at a temperature of 180°C, 220°C, and commercial jaggery can be shown in Table 1.
The main functional groups of sucrose were OH, C–H sp3 and C–O. This functional group is also found in palm sugar as shown in Table 1.
Table 1: FTIR analysis for palm sugar prepared from spray dryers at inlet temperatures of 180°C and 200°C, and also compared with commercial jaggery.
|
Fuctional groups |
Wavenumber (cm–1) |
||
|
Palm sugar |
Commercial jiggery |
||
|
|
T = 180°C |
T = 220°C |
|
|
O–H |
3524.58 |
3394.72 |
3394.73 |
|
C–H sp3 (alkane) |
2924.09 |
2931.08 |
2931.08 |
|
C–O |
1118.71 |
1128.41 |
1128.41 |
X–Ray Diffraction Analysis
The XRD patterns in Figure 5 show that the sugar produced by spray dryer was mainly sucrose (Card No. 24–1977). The XRD patterns were similar with XRD pattern of the pure sucrose reported in literature.12,13
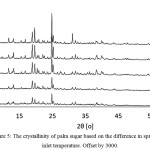 |
Figure 5: The crystallinity of palm sugar based on the difference in spray dryer inlet temperature. Offset by 3000. |
The sucrose XRD pattern implied that the spray dryer produced was crystalline sucrose not the amorphous one. Relatively high temperature operations (140–220°C) lead to crystalline sucrose. Morrow et al14 investigated that amorphous sucrose was formed by using spray dryer at very low temperature 65°C. The main peaks of crystalline sucrose were indicated by 2θ = 8.4°C, 11.8°C, 13.2°C, 18.8°C, 19.7°C, 31.1°C, 32.1°C. The impurities peaks were also detected in the XRD patterns of the spry dried sugar i.e., at 2θ = 9. 9°C which was observed at temperature 180°C and 200°C. It most likely the reducing sugars such as glucose and fructose were presence in the spray dried sugar as the impurities. The form of reducing sugar due to the acidity of palm sugar is high because of the fermentation process during tapping sap and waiting for the spray dryer processing.15 It can be seen clearly from Figure 5 that the spry dryer temperature significantly affected the crystallinity of sucrose. Lower temperature favored low crystallinity of sucrose as suggested by the XRD pattern of spray dried sucrose at T = 140°C which showed the lowest intensity peaks. The sucrose crystallinity was gradually increased as the temperature getting higher. It is most likely moisture content of sugar produced by low temperature was still high lead to the low crystalline sucrose. The sugar relative crystallinity was determined by calculating area under the main peaks 2θ within the range of 8–30°C.
![]()
Table 2: Relative crystallinity of spray dried samples.
| No | Temperature (°C) | Relative crystallinity |
| 1 | 140 | 92% |
| 2 | 160 | 93% |
| 3 | 180 | 97% |
| 4 | 200 | 98% |
| 5 | 220 | 100% |
Table 2 presented the relative crystallinity of spray dried sucrose with respect to the highest intensity of XRD peaks at temperature 220°C. The crystallinity of temperature 140°C and 160°C was not much different. The sucrose crystallinity noticed increase significantly at temperature 180°C. This finding is in agreement with Imtiaz–Ul–Islam and Langrish16 who introduced the concept of stickiness barrier by using commercial sucrose pure grade. They found that the Spray dryer yielded less crystallized sucrose at temperature between 105–165°C because of stickiness barrier which is related to the difference between the operation temperatures and the glass–transition temperatures of sucrose. It is worthen to know that the glass temperature of sucrose was 60°C and could be predicted by molecular dynamic simulation.17 The higher operating temperature was supported the high yield and crystallinity.
Scanning Electron Microscope (SEM) Analysis
The SEM image of samples on various spray dryer temperature could be seen in Figure 6. It showed the palm sugar generally had rectangular shaped especially in Figure 6A. This result was different from previous researchers. Morrow et al14 reported that spray dryer method obtained palm sugar with spherical particles with a generally smooth surface and the particles sticking together.
![Figure 6: SEM Images of palm sugar on various temperature of spray drier: [A] 160°C, [B] 180°C, [C] 200°C, and [D] commercial jaggery.](http://www.orientjchem.org/wp-content/uploads/2019/02/Vol35No1_Phe_Jay_fig6-150x150.jpg) |
Figure 6: SEM Images of palm sugar on various temperature of spray drier: [A] 160°C, [B] 180°C, [C] 200°C, and [D] commercial jaggery. |
This rectangular shaped was almost same with morphology of commercial jaggery at Figure 6. However, Figure 6C shows a sticky and agglomerated product instead of powder. The agglomeration is most likely occurred due to caramelization. Khuenpet et al18 reported the caramelization occurred when the sucrose with high remaining moisture was exposed to heat. It indicated that the spray dryer temperature plays an important role on the change in shape and morphology of palm sugar.
Effect of Spray Dryer Temperature on the Total Phenolic Content of Palm Sugar
Phenolic content is the main antioxidant that could be found in plants and fruits. This phenolic content is very beneficial for health and safe from adverse side effects. Phenolic content has a variety of biological activities to protect against various diseases such as cancer, diabetes, inflammation, arthritis, and cardiovascular disease. However, phenolic content is easily eroded during the process, especially those that use heating, so it can reduce its quality.19 Table 3 showed the effect of the temperature of the spray dryer on the total phenolic content of palm sugar.
Table 3: The effect of temperature on total phenolic in palm sugar.
| Temperature (°C) | Total Phenolic in palm sugar (g GAE/g sample) |
| 160 | 53.7±0.01 |
| 180 | 63.6±0.01 |
| 200 | 48±0.01 |
| 220 | 52.6±0.01 |
Mean ± SD, n = 2
Table 3 showed an increase in inlet temperature of the spray dryer produced irregular total phenolic. The total phenolic from the spray dryer inlet temperature of 180°C was higher than 220°C. This result was different from that reported by Lasekan,1 the total phenolic content was generally reduced by 10 % at a high inlet temperature of 203.64°C. The spray dryer inlet temperature used was 136.3°C to 203.64°C and produced total phenolic of 57.43 ± 3.4 to 63.72 ± 4.7 mg of GAE/100 g sample. The irregular total phenolic value was probably caused by the sample of palm sap used for different days of sap tapping from the palm tree. The time of taking different palm sap could vary the total phenolic content in palm sugar.
Nevertheless, the total phenolic value produced in this study was almost the same as the research conducted by Lasekan1 even though this research was used a higher temperature spray dryer. The total phenolic of palm sugar produced in this study was still higher than the palm sugar using a vacuum drying method. Although, the temperature used was lower at 40–60°C and the total phenolic that resulted from 2.14 ± 0.19 to 16.29 ± 0.53 mg of GAE / 100 g of sample5. This showed that the spray drying method was more effective than the direct heating method or the vacuum drying method.
Conclusion
Spray drying was an effective method to avoid the browning effect on palm sugar and was able to minimize the loss of phenolic content in palm sugar. Increased temperature of spray dryer caused a browning effect on palm sugar as evidenced by the spray dryer inlet temperatures of 200°C and 220°C which produce palm sugar which was darker than the temperatures of 160°C and 180°C but at this temperature, palm sugar became an agglomeration and sticky. While at 220°C produced palm sugar in the form of powder and not sticky. The total phenolic produced was irregular because of increasing the spray dryer temperature. Total phenolic values obtained from 48 ± 0.1 to 63.6 ± 0.01 mg of GAE/100g sample. The total phenolic of palm sugar from the spray dryer was higher than the vacuum drying method even though the temperature was lower. This showed that the spray dryer method was more effective with regard to the total phenolic content than vacuum dryers.
Acknowledgements
The authors would like to acknowledge The Islamic Development Bank (IDB) – Universitas Sultan Ageng Tirtayasa (UNTIRTA) for providing grant project no.593/UN43.9/PL/2018.
Conflict of Interest
There is no conflict of interest.
References
- Lasekan, O. Dry. Technol, 2014, 32, 398–407.
- Tomomatsu, A.; Itoh, T.; Wijaya, C.H.; Nasution, Z.; Kumendong, J.; Aklra, M. Japanese J. Trop. Agric. 1996, 40, 175–181.
- Ho, C.W.; Aida, W.M.W.; Maskat, M.Y.; Osman, H. Food Chem, 2007, 102, 1156–1162.
CrossRef - Apriyantono, A.; Aristyani, A.; Nurhayati; Lidya, Y.; Budiyanto, S; Soekarto, S.T. Int. Congr. Ser. 2002, 1245, 275–278.
CrossRef - Aeimsard, R.; Benjawan, T.; Rattakorn, J; Lekhavat, S. J. Food Sci. Agric. Technol. 2015, 1, 126–130.
- Maurya, S.; Singh, D. Int. J. PharmTech Res. 2010, 2, 2403–2406.
- Abdelhady, M.I.S.; Motaal, A.A.; Beerhues, L. Am. J. Plant Sci. 2011, 847–850.
- Manley, D. Sugars and syrups as biscuit ingredients. In: Manley’s Technology of Biscuits, Crackers and Cookies: Fourth Edition. Woodhead Publishing Limited. 2011.
- Intipunya, P.; Bhandari, B.R. Chemical deterioration and physical instability of food and beverages. Chapter 22. In: Skibsted L, Risbo J, Andersen M (eds). Chemical deterioration and physical instability of food and beverages. Woodhead Publishing. 2010. pp. 665–697.
- Muzaffar, K.; Nayik, G.A.; Kumar, P. J. Nutr. Food Sci. 2015, S12, 1–3.
- O’callaghan, D.; Hogan, S. Dairy Sci. Technol. 2013, 93, 331–346.
- Lee, T.; Chang, G.D. Cryst. Growth Des, 2009, 9, 3551–3561.
- Kawakami, K.; Miyoshi, K.; Tamura, N.; Yamaguchi, T.; Ida, Y. J. Pharm. Sci. 2006, 95, 1354–1363.
CrossRef - Morrow, E.A.; Terban, M.W.; Thomas, L.C.; Gray, D.L.; Bowman, M.J.; Billinge, S.J.L.; Schmidt, S.J. J. Food Eng. 2019, 243, 125–141.
CrossRef - Hebbar, K.; Pandiselvam, R.; Manikantan, M.; Arivalagan, M.; Shameena, B.; Chowdappa, P. Sugar Tech. 2018, 20, 621–634.
CrossRef - Imtiaz–Ul–Islam, M.; Langrish, T.A. Food Bioprod. Process, 2009, 87, 87–95.
- Simperler, A.; Kornherr, A.; Chopra, R.; Bonnet, P.A.; Jones, W.; Motherwell, W.D.S.; Zifferer, G. J. Phys. Chem. B. 2006, 110, 19678–19684.
CrossRef - Khuenpet, K.; Nutcha, C.; Sasarose, J.; Supha, A.; Weerachet, J. Agric. Nat. Resour. J, 2016, 50, 139–145.
- Chong, S.Y.; Wong, C.W. Int. Food Res. J. 2017, 24, 2543–2548.

This work is licensed under a Creative Commons Attribution 4.0 International License.


