Experimental Determination of the Kinetic Rate Law for the Oxidation of Acetone in Aqueous Environment by Potassium Permanganate and Sulfuric Acid at 25°C and Proposed Mechanism for the Reaction
Thermodynamic Research Laboratory, Department of Physical Chemistry, Faculty of Chemistry, University of Kashan, Kashan, Iran.
Corresponding Author E-mail: Rasa@Kashanu.ac.ir
DOI : http://dx.doi.org/10.13005/ojc/350142
Article Received on : 16-10-2018
Article Accepted on : 05-12-2018
Article Published : 19 Jan 2019
This research paper aims to determine of the rate equation for the reaction that is described in this article. Experiments carried out by using iodometric method for determine the concentration of potassium permanganate at different times. The results are very similar to the results of the UV-Visible spectrophotometric method. These results showed that order of reaction for acetone, potassium permanganate and sulfuric acid were 1, 1 and 1, respectively. Therefore, the rate equation is according to the chemical equation. In addition, it was demonstrated that there was no relationship between products concentration and rate of reaction. A suitable mechanism is also suggested. Thus, the reaction rate law implies a complicated reaction mechanism with low acetone concentrations. In addition, elevated temperature and reactants concentrations are required for a fast acetone oxidation. A reaction mechanism in good consistent with the kinetic results will be suggested and discussed.
KEYWORDS:Iodometric Method; Mechanism; Potassium Permanganate; Rate Equation; Spectrophotometric Method
Download this article as:| Copy the following to cite this article: Rasa S. H, Badri M. T. Experimental Determination of the Kinetic Rate Law for the Oxidation of Acetone in Aqueous Environment by Potassium Permanganate and Sulfuric Acid at 25°C and Proposed Mechanism for the Reaction. Orient J Chem 2019;35(1). |
| Copy the following to cite this URL: Rasa S. H, Badri M. T. Experimental Determination of the Kinetic Rate Law for the Oxidation of Acetone in Aqueous Environment by Potassium Permanganate and Sulfuric Acid at 25°C and Proposed Mechanism for the Reaction. Orient J Chem 2019;35(1). Available from: https://bit.ly/2DZ1mGp |
Introduction
Acetone is a clear, colorless, volatile and flammable liquid with a characteristic odor described as pungent or fruity. It is primarily used as an industrial solvent and chemical intermediate. Acetone is also found in paints, varnishes and lacquers and is used as a solvent for cements in the leather and rubber industries. Because acetone does not adsorb to soil strongly and is highly water soluble, acetone-containing wastes released to soil will tend to leach to groundwater. The odor threshold for acetone in water is reported to be 20 parts per million (ppm); the reported odor threshold in air is in the range of 13 to 20 ppm. Acetone is a natural metabolism product of both plants and animals, including humans. Those who fast, consume a high fat, low carbohydrate diet and do exercise strenuously have uncontrolled diabetes and are likely to produce higher than usual levels. Acetone is quickly absorbed by ingestion, inhalation, and dermal exposure. In two experiments with humans, inhalation absorption was in the 70 to 80 percent range. There is no data for the other routes. Absorbed acetone is almost entirely eliminated from the body within a day after exposure. Mild nervous system effects such as eye and respiratory irritation, mood swings, and nausea that abated soon after exposure ended were seen in humans breathing high concentrations of acetone. Accidental poisonings report similar nervous system effects of sluggishness and drowsiness that were not long lasting. There is only one animal study that investigated the effects of acetone exposure by ingestion. Rats were given drinking water containing acetone for 18 weeks. The only effect observed in the rats was weight loss, which may be attributed to decreased food consumption. Humans exposed to high levels of acetone by inhalation experienced eye and nasal irritation. Exposure to somewhat lower concentrations did not cause any adverse health effects. In another study, groups of students were exposed by inhalation to acetone for six hours. At the higher concentrations, eye, nose and throat irritation were observed. Workers exposed by inhalation to acetone for three hours per day for seven to 15 years complained of respiratory tract irritation, dizziness, and loss of strength. In animals exposed to very high doses of acetone in drinking water, effects on the blood indicating an anemic condition were reported. Male rats exposed to very high concentrations of acetone in drinking water had increases in malformed sperm and reduced sperm movement. Whether these effects would impair reproductive ability is not known.1-9 Potassium permanganate is selected as an oxidizing agent for our present study because; it is an economically low-cost material. It has high oxidation potential [E0 = 1.51 V], it can oxidize wide variety of substances and it is effective over wide range of pH. There are various oxidation states of Mn like (+II, + III, +IV, +V, +VI and + VII). Hence, it become very complicated to find out the exact species involved in it.10
Recently, environmental problems persuaded researchers to pay attention to acetone oxidation in gaseous and aqueous media for optimizing the process. In the gaseous medium the process has been proceeded in presence of different catalysts such as platinum, palladium and oxides of chromium, cobalt, copper, nickel and manganese. The transition metals have been supported on different metal oxides such as Al2O3, MgO and ZrO2 supports.11-14 In liquid medium, oxidation of organic compounds in presence of potassium permanganate has been investigated widely. Aqueous acetone oxidation also has been performed in presence of Potassium permanganate with different conditions.
Our extensive studies in dealing with acetone environmental remediation acetone has resulted in the use of potassium permanganate as its oxidation agent. In the present paper we report our kinetics studies of potassium permanganate oxidation of acetone. Our extensive research indicated that the reaction rate law for this process is: Reaction Rate Law = k[(CH3)2CO]1 [KMnO4]1 [H2SO4]1 [MnSO4]0[CH3CHOOH]0[HCOOH]0 and related data for reactant concentrations versus time extracted and diagrams of [reactant]-1, and ln[reactant] versus time were plotted with the hope that a linear relationship to be found. 15-24 The reaction rate law is significant information that has an important role to understand the mechanism. Reaction kinetics determines the best way to achieve desirable products in the least possible time as well as optimum temperature, pressure, concentrations and quantity and quality of catalyst.25-32
Materials and Methods
Sulfuric acid 98%, acetone, Potassium permanganate, potassium iodide and sodium thiosulfate were purchased from Merck. To determine order of reaction based on Re. 1 and Eq. 1, the concentration of each reactant was concerned much less than others. Reaction was carried out in 25oC and atmospheric pressure. Designated volumes of homogeneous solution were sampled at different times and the potassium permanganate concentration was detected with iodometric method and UV-Vis spectroscopy at 526 nm wavelength. The Figure 1 shows the UV-Vis spectrum of Potassium permanganate solution using double distilled water and acetone. In chemistry, a calibration curve, also known as a standard curve, is a general method for determining the concentration of a substance in an unknown sample by comparing the unknown to a set of standard samples of known concentration. See table 1 and refer to figure 2.
Re.1: 5(CH3)2CO+6KMnO4+9H2SO4→ 3K2SO4+6MnSO4+5CH3COOH+5HCOOH+9H2O
Eq.1: Rate= k [KMnO4] 1 [H2SO4]1[(CH3)2CO]1[MnSO4]0[CH3CHOOH]0[HCOOH]0
To find a probable linear relationship between time and concentration, diagrams of [reactant], [reactant]-1 and ln[reactant] versus time and [product], [product]-1 and ln[product] versus time were plotted.
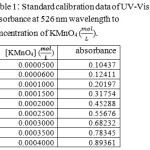 |
Table 1: Standard calibration data of UV-Visible absorbance at 526 nm wavelength to concentration of KMnO4 (mol/L). |
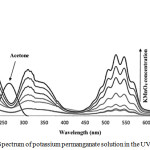 |
Figure 1: Spectrum of potassium permanganate solution in the UV-Visible region.Click here to view figure |
(Spectral band (200 – 600 nm) in the oxidation of acetone with permanganate ion in aqueous solutions.)
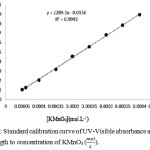 |
Figure 2: Standard calibration curve of UV-Visible absorbance at 526 nm wavelength to concentration of KMnO4 (mol/L). |
![Table 2: KMnO4 concentration (mol.L-1) and - In [KMnO4] at different times in reactions.](http://www.orientjchem.org/wp-content/uploads/2019/01/Vol35No1_Exp_Say_tab2-150x150.jpg) |
Table 2: KMnO4 concentration (mol.L-1) and – In [KMnO4] at different times in reactions. |
![Table 3: acetone concentration (mol.L-1) and - In [acetone] at different times in reactions.](http://www.orientjchem.org/wp-content/uploads/2019/01/Vol35No1_Exp_Say_tab3-150x150.jpg) |
Table 3: Acetone concentration (mol.L-1) and – In [acetone] at different times in reactions. |
Results
Determining Rate Laws and the Order of the Reaction
In fact, stainless steel constant temperature bath at 25.0 have been used for the following aqueous solutions and all experiments. It is important to make a distinction between order with respect to concentration and order with respect to time. The order with respect to concentration can be obtained from experiments in which initial rates are measured at a series of initial concentrations. The order with respect to time is determined from measurements of reactant concentration as a function of time of reaction. The order with respect to time will be the same as the order with respect to concentration if the reaction goes to completion and the rate is unaffected by products. To find the order of the reaction for Potassium permanganate, a solution was prepared using acetone, Potassium permanganate and sulfuric acid with concentrations of 0.206, 0.00486 and 0.36 M, respectively. Data was collected and diagrams were plotted. As shown in figure 3a, there is a linear relationship between logarithm concentration of Potassium permanganate and time. So, the obtained order of the reaction for potassium permanganate was 1. To find the order of the reaction for acetone, a solution was prepared using acetone, potassium permanganate and Sulfuric acid with concentrations of 0.0267, 0.0101 and 0.36 M, respectively. Data was collected and diagrams were plotted. As shown in figure 3b, there is a linear relationship between logarithm concentration of acetone and time. So, the obtained order of the reaction for acetone and potassium permanganate was the same. To determine the order of the reaction for sulfuric acid, 10 solutions with sulfuric acid, concentrations of 0.36, 0.50, 0.75, 1.00, 1.25, 1.50, 1.75, 2.00, 2.25 and 2.50 molar together with constant concentrations of acetone and potassium permanganate were prepared. Data was collected and diagrams were plotted. See table 4 and refer to figure 4. There was a linear relationship between concentration of sulfuric acid and reaction rate. So, the obtained order of the reaction for sulfuric acid was one. Figure 4 shows diagrams related to the order of the reaction for Sulfuric acid.
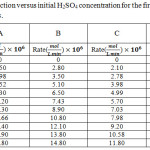 |
Table 4: The rate of reaction versus initial H2SO4 concentration for the first (A) 25, (B) 50, (C) 75 and (D) 100 minutes. |
![Figure 3: Linear relationship between (a) -ln[KMnO4], (b) -ln[acetone] and time.](http://www.orientjchem.org/wp-content/uploads/2019/01/Vol35No1_Exp_Say_fig3-150x150.jpg) |
Figure 3: Linear relationship between (a) -ln[KMnO4], (b) -ln[acetone] and time. |
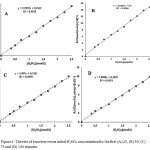 |
Figure 4: The rate of reaction versus initial H2SO4 concentration for the first (A) 25, (B) 50, (C) 75 and (D) 100 minutes. |
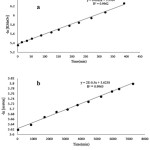 |
Figure 5 |
Order of Reaction for Products
It was observed that there is no relationship between products’ concentration and rate of reaction. Solutions with constant concentrations of [Acetone]=0.206 mol. L-1, [KMnO4] =0.00350 mol. L-1 and [H2SO4] = 1.00 mol. L-1 and different MnSO4 concentrations were prepared as reaction medium. The potassium permanganate concentration was detected at the same reaction times and results were shown in table 5. As shown in this table, there is no relationship between MnSO4 concentration and reaction rate. To find reaction rate dependence on K2SO4 concentration, similar experiment was designed and KMnO4 concentrations were evaluated at different reactions times. Data on table 6 shows that there is no dependence between reaction rate and K2SO4 concentration. Solutions with constant concentrations of [Acetone]=0.206 mol. L-1, [KMnO4] = 0.00500 mol. L-1‑ and [H2SO4] = 1.00 mol. L-1 and different acetic acid concentrations were prepared as reaction medium. The KMnO4 concentration was detected at the same reaction times and results were shown in table 7. The table suggests that there is no relationship between acetic acid concentration and reaction rate. To find reaction rate dependence on formic acid concentration, similar experiment was designed and KMnO4 concentrations were evaluated at different reactions times. Data on table 8 shows that there is no dependence between reaction rate and formic acid concentration. In other words, the rate of the reaction do not vary with increasing nor decreasing products concentrations. Therefore, the reaction rate law is appeared as Eq. 1
Rate= k[KMnO4] [H2SO4] [(CH3)2CO]
Table 5: KMnO4 concentration (mol.L-1) at different times in reactions with different initial concentrations of MnSO4.
| Time (min) | [MnSO4] 0.00250mol.L-1 | [MnSO4] 0.00500mol.L-1 | [MnSO4] 0.01000mol.L-1 | [MnSO4] 0.01500mol.L-1 |
| 10 | 3.300×10⁻³ | 3.301×10⁻³ | 3.301×10⁻³ | 3.302×10⁻³ |
| 20 | 2.950×10⁻³ | 2.950×10⁻³ | 2.950×10⁻³ | 2.950×10⁻³ |
| 30 | 2.801×10⁻³ | 2.800×10⁻³ | 2.802×10⁻³ | 2.803×10⁻³ |
| 40 | 2.602×10⁻³ | 2.602×10⁻³ | 2.604×10⁻³ | 2.601×10⁻³ |
| 50 | 2.581×10⁻³ | 2.580×10⁻³ | 2.580×10⁻³ | 2.580×10⁻³ |
| 60 | 2.550×10⁻³ | 2.550×10⁻³ | 2.554×10⁻³ | 2.553×10⁻³ |
| 70 | 2.463×10⁻³ | 2.460×10⁻³ | 2.465×10⁻³ | 2.460×10⁻³ |
| 80 | 2. 410×10-3 | 2. 411×10-3 | 2. 411×10-3 | 2. 410×10-3 |
| 90 | 2.380×10⁻³ | 2.380×10⁻³ | 2.380×10⁻³ | 2.380×10⁻³ |
| 100 | 2.321×10⁻³ | 2.320×10⁻³ | 2.322×10⁻³ | 2.323×10⁻³ |
| 110 | 2.240×10⁻³ | 2.240×10⁻³ | 2.241×10⁻³ | 2.242×10⁻³ |
| 120 | 2.141×10⁻³ | 2.140×10⁻³ | 2.142×10⁻³ | 2.140×10⁻³ |
Table 6: KMnO4 concentration (mol.L-1) at different times in reactions with different initial concentrations of K2SO4.
| Time(min) | [K2SO4] 0.00250 mol.L-1 | [K2SO4] 0.00500 mol.L-1 | [K2SO4] 0.01000 mol.L-1 | [K2SO4] 0.01500 mol.L-1 |
| 10 | 3.302×10⁻³ | 3.301×10⁻³ | 3.300×10⁻³ | 3.301×10⁻³ |
| 20 | 2.950×10⁻³ | 2.950×10⁻³ | 2.950×10⁻³ | 2.950×10⁻³ |
| 30 | 2.803×10⁻³ | 2.800×10⁻³ | 2.801×10⁻³ | 2.802×10⁻³ |
| 40 | 2.601×10⁻³ | 2.602×10⁻³ | 2.602×10⁻³ | 2.604×10⁻³ |
| 50 | 2.580×10⁻³ | 2.580×10⁻³ | 2.581×10⁻³ | 2.580×10⁻³ |
| 60 | 2.553×10⁻³ | 2.550×10⁻³ | 2.550×10⁻³ | 2.554×10⁻³ |
| 70 | 2.460×10⁻³ | 2.460×10⁻³ | 2.463×10⁻³ | 2.465×10⁻³ |
| 80 | 2. 410×10-3 | 2. 411×10-3 | 2. 410×10-3 | 2. 411×10-3 |
| 90 | 2.380×10⁻³ | 2.380×10⁻³ | 2.380×10⁻³ | 2.380×10⁻³ |
| 100 | 2.323×10⁻³ | 2.320×10⁻³ | 2.321×10⁻³ | 2.322×10⁻³ |
| 110 | 2.242×10⁻³ | 2.240×10⁻³ | 2.240×10⁻³ | 2.241×10⁻³ |
| 120 | 2.140×10⁻³ | 2.140×10⁻³ | 2.141×10⁻³ | 2.142×10⁻³ |
Table 7: KMnO4 concentration (mol.L-1) at different times in reactions with different initial concentrations of acetic acid.
| Time (min) | [CH3COOH] 0.0100 mol.L-1 | [CH3COOH] 0.0150 mol.L-1 | [CH3COOH] 0.0200 mol.L-1 | [CH3COOH] 0.0400 mol.L-1 |
| 10 | 4.400×10⁻³ | 4.400×10⁻³ | 4.400×10⁻³ | 4.400×10⁻³ |
| 20 | 3.840×10⁻³ | 3.844×10⁻³ | 3.842×10⁻³ | 3.841×10⁻³ |
| 30 | 3.620×10⁻³ | 3.622×10⁻³ | 3.620×10⁻³ | 3.623×10⁻³ |
| 40 | 3.384×10⁻³ | 3.385×10⁻³ | 3.386×10⁻³ | 3.385×10⁻³ |
| 50 | 3.340×10⁻³ | 3.341×10⁻³ | 3.340×10⁻³ | 3.343×10⁻³ |
| 60 | 3.162×10⁻³ | 3.162×10⁻³ | 3.161×10⁻³ | 3.161×10⁻³ |
| 70 | 2.960×10⁻³ | 2.961×10⁻³ | 2.962×10⁻³ | 2.961×10⁻³ |
| 80 | 2.800×10⁻³ | 2.800×10⁻³ | 2.800×10⁻³ | 2.800×10⁻³ |
| 90 | 2.721×10⁻³ | 2.720×10⁻³ | 2.719×10⁻³ | 2.720×10⁻³ |
| 100 | 2.480×10⁻³ | 2.480×10⁻³ | 2.480×10⁻³ | 2.480×10⁻³ |
| 110 | 2.400×10⁻³ | 2.400×10⁻³ | 2.400×10⁻³ | 2.400×10⁻³ |
| 120 | 2.311×10⁻³ | 2.312×10⁻³ | 2.310×10⁻³ | 2.311×10⁻³ |
Table 8: KMnO4 concentration (mol.L-1) at different times in reactions with different initial concentrations of formic acid.
| Time (min) | [HCOOH] 0.0100 mol.L-1 | [HCOOH] 0.0150 mol.L-1 | [HCOOH] 0.0200 mol.L-1 | [HCOOH] 0.0400 mol.L-1 |
| 10 | 4.400×10⁻³ | 4.400×10⁻³ | 4.400×10⁻³ | 4.400×10⁻³ |
| 20 | 3.844×10⁻³ | 3.841×10⁻³ | 3.840×10⁻³ | 3.842×10⁻³ |
| 30 | 3.622×10⁻³ | 3.623×10⁻³ | 3.620×10⁻³ | 3.620×10⁻³ |
| 40 | 3.385×10⁻³ | 3.385×10⁻³ | 3.384×10⁻³ | 3.386×10⁻³ |
| 50 | 3.341×10⁻³ | 3.343×10⁻³ | 3.340×10⁻³ | 3.340×10⁻³ |
| 60 | 3.162×10⁻³ | 3.161×10⁻³ | 3.162×10⁻³ | 3.161×10⁻³ |
| 70 | 2.961×10⁻³ | 2.961×10⁻³ | 2.960×10⁻³ | 2.962×10⁻³ |
| 80 | 2.800×10⁻³ | 2.800×10⁻³ | 2.800×10⁻³ | 2.800×10⁻³ |
| 90 | 2.720×10⁻³ | 2.720×10⁻³ | 2.721×10⁻³ | 2.719×10⁻³ |
| 100 | 2.480×10⁻³ | 2.480×10⁻³ | 2.480×10⁻³ | 2.480×10⁻³ |
| 110 | 2.400×10⁻³ | 2.400×10⁻³ | 2.400×10⁻³ | 2.400×10⁻³ |
| 120 | 2.312×10⁻³ | 2.311×10⁻³ | 2.311×10⁻³ | 2.310×10⁻³ |
Discussion
It has been established that in acidic medium the stable reduction product of potassium permanganate is Mn2+ion. Therefore, the below mechanism was proposed based on the kinetic results and spectral analyses carried out. Based upon the above results a suitable mechanism for the oxidation of acetone can be suggested as follows. The permanganic acid react with enol form of acetone to form complex A. This complex finally gives Acetic acid and formaldehyde. We propose the simplified mechanism below for the oxidation of acetone by potassium permanganate in acidic medium.
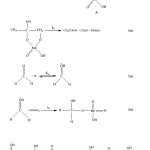 |
Figure 6 |
A suitable rate expression in consistent with above observation can be formulated as follows:
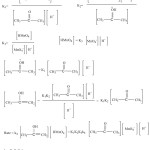 |
Figure 7 |
Above equation supported the proposed mechanism.
Conclusion
Kinetics of acetone oxidation were investigated in an aqueous solution of potassium permanganate in sulfuric acid environment. The findings indicated reaction order of 1 for acetone and potassium permanganate and sulfuric acid, so the reaction rate law was determined as: Rate = k[(CH3)2CO].[KMnO4].[H2SO4]. The reaction rate law suggests a complicated reaction mechanism that occurs even in lower acetone concentrations. Moreover, increasing temperature and reactants concentrations are necessary for a fast acetone oxidation. A reaction mechanism in good consistent with the kinetic results was suggested and discussed.
Acknowledgements
This work was financially supported by a research grant from University of Kashan.
References
- Klaassen, C. D. Casarett and Doull’s 2013 In Toxicology: The Basic Science of Poisons, 8th edn. McGraw-Hill Publishing Co., Inc., New York. 2013, 866-916, 1123-1140.
- Atlanta, G. A. ATSDR. 1994, 1-86.
- Haggard, H. W.; Greenberg, L.A.; Turner, J.M. J. Ind. Hygiene Toxicol. 1994, 26, 133-151.
CrossRef - Forsyth, C. 2003 U.S. EPA, Office of Solid Waste and Emergency Response, p. 22-32.
CrossRef - Baltroke, I. M.; Sadeghi, M. M.; Mahmoodi, N.; Kharesh, B. Indian J. Chem. 1997, 36, 438.
- Dinesh, P.; Dilsha, K. M.; Seema, K. J. Indian Chem Soc. 2006, 86, 816.
- Dilsha, K. M.; Kothari, S. Prog. Reac. Kinet. Meach. 2007, 32, 119.
- Kothari, S. Goyal, A., Banerji, K. K. J. Chem. Res. 2002, 363, 863-878.
CrossRef - Seema, K.; Kathari, A.; Banerji, K. K. Indian J. Chem. 2000, 39, 734.
CrossRef - Abdul aziz, saeed.; Awn, N.; Farooqui, M. Int. J. Chem. Sci. 2013, 11, 1401-1406.
- Likhodii, S.S.; Serbanescu, I.; Cortez, M.A.; Murphy, P.; Snead, O. C.; Burnham, W. M. . Ann Neurol. 2003, 54, 219–226.
CrossRef - Spivey, J.J.; Webb, G. Complete Oxidation of Volatile Organics, Catalysis. The Royal Society of Chemistry, Cambridge. 1989, 26, 2165-2180.
CrossRef - Prasad, R.; Kennedy, L. A.; Ruckenstein, E. Catal. Rev. Sci. Eng. 1984, 26, 1-58.
CrossRef - Zwinkels, M. F. M.; Järås, S. G.; Menon, P. G.; Griffin, T. A. Catal. Rev. Sci. Eng. 1993, 35, 319.
CrossRef - Noordally, E.; Richmond, J. R.; Tahir, S. F. Catal, Today. 2003, 17, 359.
CrossRef - Manivannan, G.; Maruthamuthu, P. J. Chem. Soc, Perkin Trans 2. 1986, 4, 565.
CrossRef - Latona, D. F. Carib. J. SciTech. 2016, 4, 939-947.
- Radhakrisnamurti, P.S.; Rao, M. D. P. Indian J. Chem. Sect. A. 1977, 15, 524.
- Nath, P.; Banerji, K. K. Indian J. Chem. Sect. A. 1976, 14, 660.
CrossRef - Nath, M. P; Banerji, K. K. Aust. J. Chem. 1976, 29, 1939.
- Sen, P. K.; Mukhopadhyay, G.K.; Sen Gupta, K. Transition Met. Chem. 1998, 23, 577.
CrossRef - Wiberg, K. B.; Geer, R. D. J. Am. Chem. Soc. 1965, 87, 5202.
CrossRef - Lee, D. G. APA. The Oxidation of Organic Compounds by Permanganate Ion and Hexavalent Chromium. Open Court: La Salle. 1980.
- Ja´ky, M.; Szammer, J.; Simon-Trompler, E. J. Chem. Soc. Perkin Trans. 2000, 2, 1597-1602.
CrossRef - Freeman, F.; Chang, L.Y.; Sumarta, L. J. Org. Chem. 1987, 52, 1460.
- Carrington, A.; Symons, M. C. R. Cem. Rev. 1963, 63, 443-460.
CrossRef - Freeman, F. React. Species Chem. React. 1976, 1, 179-226.
- Cotton, F.A.; Wilkinson, G. 1980 Advanced Inorganic Chemistry, John Wiley and Sons, 738- 748.
- Dash, S.; Patel, S.; Mishra, B. K. Tetrahedron. 2009, 65, 707–739.
CrossRef - Hussain, S. Oriental J.CHEMISTRY. 2011, 27, 1729-1734.
- Seema, K. Banerji, K. K. Oxidn. Commun. 2003, 23, 93.
CrossRef - Levine IN 2009 Physical chemistry, sixth edn. New York, 515-579.

This work is licensed under a Creative Commons Attribution 4.0 International License.


