HPLC Method of Analysis for Determination and Standardization of Luteolin and Vanillic Acid in Dry Extract of Paronychia Argentea Lam.
Hasan Y. Muti1 and Suleiman Olimat2
1Faculty of Pharmacy and Medical Sciences, Al-Ahliyya Amman University, Amman–Jordan.
2Faculty of Pharmacy, Jordan University of Science and Technology, Irbid–Jordan.
Corresponding Author E-mail: h.muti@ammanu.edu.jo
DOI : http://dx.doi.org/10.13005/ojc/340605
Article Received on : 03-10-2018
Article Accepted on : 31-10-2018
Article Published : 04 Nov 2018
The main objective of this study was to establish a chromatographic method for analysis, determination and standardization of the two main components vanillic acid and luteolin as major components in Paronychia argentea Lam dry extract. This analytical method was designed to be a simple and fast with an appropriate separation of the two main components of the extract. High pressure liquid chromatography (HPLC) method of analysis was developed to quantitatively determine, identify and standardize the two main active constituents in the pharmaceutical dry extract against luteolin and vanillic acid as primary reference standards as it is the major active constituents of the dry extract of P. Argentea, where the linearity obtained was higher than R2 = 0.99981 and 0.99908 respectively. Although the method was proven to be suitable, further specific analysis validation was conducted to include the following: linearity, precision, range, limit of detection, limit of quantitation and filter compatibility. The luteolin and vanillic acid were completely separated from the other components in the herbal dry extract with an Rf value of 1.3 and 5.7 minutes respectively. The concentration of Luteolin is 0.4% while vanillic acid content is 0.1% in the dry extract.
KEYWORDS:Analysis; Extract; Paronychia Argentea; HPLC; Linearity; Luteolin; Precision and Repeatability; Quantitation; Validation; Vanillic Acid
Download this article as:| Copy the following to cite this article: Muti H. Y, Olimat S. HPLC Method of Analysis for Determination and Standardization of Luteolin and Vanillic Acid in Dry Extract of Paronychia Argentea Lam. Orient J Chem 2018;34(6). |
| Copy the following to cite this URL: Muti H. Y, Olimat S. HPLC Method of Analysis for Determination and Standardization of Luteolin and Vanillic Acid in Dry Extract of Paronychia Argentea Lam. Orient J Chem 2018;34(6). Available from: http://www.orientjchem.org/?p=52046 |
Introduction
Paronychia argentea Lam. (Locally known as Rijl El Hamameh) is a perennial herb, distributed widely throughout in Jordan.1 Several studies showed that Paronychia argentea has hypoglycemic activity,2-4 and it has been proved to be useful as gastric analgesic, bladder, prostate, abdominal ailments treatment, and stomach ulcers treatment.5 It also showed significant alpha amylase6 and acetyl cholinesterase (AChE) enzyme inhibitory activity,7 the plant extract of Paronychia argentea showed antioxidant activity.8 Other in vivo and in vitro studies on different extracts from Paronychia argentea revealed the immunomodulating activity of the plant.9 Many chemical compounds have been identified and isolated from Paronychia argentea as: jaceosidin, tricin, nepetin, octadecanoic acid, 1- docosanol, glycerol octadecanoate monoester, β- sitosteryl glucoside, β-sitosterol, and luteolin-3- methyl ether, ethyl-α- D- galacto-pyranoside, D-pinitol(Pinitol is cyclitol) and vanillic acid, luteolin.10 Vanillic acid and luteolin are considered as the major’s active constituent of Paronychia argentea responsible for its biological activity.11
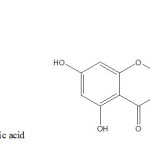 |
Scheme 1 |
Material and Methods
Materials
Plant material of P. argentea, aerial part, was collected on April 2016 from Ajloun area, Jordan. The dried plant material (600g) was grounded and soaked in ethanol (90%) for three weeks with frequent agitation, the alcohol solution was and then filtered and evaporated using Rota Vapor to obtain a solid residue (48 g).
Standard luteolin Primary Reference Standard, batch number HWI01784 was purchased from HWI Pharma services GmbH – Germany. Standard vanillic acid Primary Reference Standard, lot number STBD6012Vwas purchased from Sigma Aldrich – Germany, Distilled water, Acetonitrile HPLC grade, Methanol HPLC grade, Acetic acid % HPLC grade 99%.
Methods
High Pressure Liquid Chromatographic Analysis
Preparation of Mobile phase
Distilled water, methanol and acetic acid were mixed at a ratio of (700:300:10) ml respectively then passed through a nylon membrane filter having a pore size of 0.45µm and sonicate to degas.
Preparation of Reference Standards
3.0 mg of Luteolin RS were accurately weighed and transferred to a 5 ml volumetric flask then 3 ml of mobile phase were added and sonicate for 10 minutes. Mobile phase was added to complete the volume to 5ml (Final Concentration 0.60 mg/ml). In a similar way vanillic acid RS solution using was prepared.
Accurately weighed a 20 mg of Vanillic acid RS and transferred to a 50-ml volumetric flask then 30 ml of mobile phase was added, and the solution was sonicated for 10 minutes and made up to volume with the mobile phase(Final Concentration 0.4 mg/ml).
Chromatographic Condition
All analyses were performed using an HPLC HITACHI Chromaster (5160 HPLC pump) & (5410, dual λ UV absorbance detector), HPLC column ODS-3 (150X4.6) mm, (5µm) and 5310 column oven and auto sampler 5260 were used during the HPLC analysis.
Standard solutions were injected using equal volumes of 20ml of at a flow rate of 1.0ml\minute and a wavelength of 260 nm.
To calculate the percentage of both vanillic acid and luteolin in the sample taken of the dry extract, the following formula was used:

Where
AUC sample : area of sample.
AUCSTD : area of standard.
CSTD : Concentration standard taken (µg/ml).
P : Potency of Luteolin standard (91.82%)
P : Potency of Vanillic acid (97%)
C sample : Concentration of Sample taken (µg/ml).
Sample Preparation for HPLC Analysis
4.0 g of dry extract were transferred to a 25 ml volumetric flask, and 15 ml diluent (mobile phase) was added and sonicated for 20 minutes. The volume was completed with diluent (mobile phase) and filtered through 0.45 µm Nylon filter.
Method Validation
The analytical method used for the quantification of Luteolin and Vanillic acid in the P. argentea extracts was validated for linearity, LOD and LOQ, precision, as previously described.
Results and Discussion
Optimization of Chromatographic Conditions
The HPLC conditions were optimized for the mobile phase composition, column temperature, wavelength, and flow rate (Table below). Detection wavelengths were set according to the ultraviolet (UV) absorption maxima of the compounds (260 nm).
| Chromatographic conditions | |
| Column | ODS-3 (150X4.6) mm, 5 µm |
| Column Oven | 30°C |
| Flow rate | 1.0 ML/min. |
| Injection volume | 20 µl |
| Wavelength | 260 nm |
| Flushing solution | Methanol and distilled water at a ratio of 1:1 |
| Runtime | 15 minutes |
Peak of Luteolin and Vanillic acid standard preparations appear at retention time of 1.3 and 5.7 min respectively as shown in figure 5 and figure 6 respectively, and a sample preparation was injected into the chromatograph and two peaks appear at retention times of 1.6 min, 5.7 min respectively as shown in figure 7.
Determination of Major Components in Paronychia Argentea Lam Dry Extract
It was found that the Luteolin content is 0.4% while vanillic acid content is 0.1%
Method Validation
Linearity
The linearity of the assay method of vanillic acid was determined in the range from 25, 40, 50,60,75, 85 and100%, proportional to the concentration relative to the prescribed standard concentration 0.4 mg/ml and the curve was linear over a this large number of concentration and exhibited a linear regression (R2 = 0.99981) and slope of 201133.9864.
Statistical analysis are shown in table1 and a plot of area under the curve versus concentration can be seen in Fig. 1.The standard curve was plotted and evaluated for linearity.
The obtained equation for the standard curves was: Equation: Y = AX – B, Where B is the intercept with Y-axis and A is the slope.
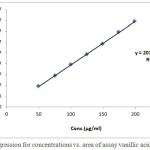 |
Figure 1: Regression for concentrations vs. area of assay vanillic acid standard. |
Table 1: Standard curve of assay vanillic acid standard. (Nominal concentration= 0.4 mg/ml).
| Injection(µL) | Concentration (µg/ml) | Area | Average | RSD |
| 100 | 199.0000 | 39927850 | 39775006 | 0.54 |
| 39622161 | ||||
| 85 | 174.1250 | 34480770 | 34505485 | 0.10 |
| 34530200 | ||||
| 75 | 149.2500 | 29111735 | 29310849 | 0.96 |
| 29509963 | ||||
| 60 | 124.3750 | 24543949 | 24472215 | 0.41 |
| 24400481 | ||||
| 50 | 99.5000 | 19482803 | 19495800 | 0.09 |
| 19508796 | ||||
| 40 | 74.6250 | 14549070 | 14537364 | 0.11 |
| 14525657 | ||||
| 25 | 49.7500 | 9651494 | 9662163 | 0.16 |
| 96722831 | ||||
| R2 = 0.99981 | Slope= 201133.9864 | |||
| Intercept = -479056.6964 | ||||
Table 2: Standard curve of assay of Luteolin. (Nominal concentration= 0.6 mg/ml).
| Injection(µL) | Concentration(µg/ml) | Area | Average | RSD |
| 20 | 572.9568 | 129915 | 129473 | 0.48 |
| 129030 | ||||
| 17.5 | 501.3372 | 105752 | 105666 | 0.12 |
| 105580 | ||||
| 15 | 429.7176 | 88067 | 87943 | 0.20 |
| 87818 | ||||
| 12.5 | 358.0980 | 69181 | 69222 | 0.08 |
| 69262 | ||||
| 10 | 286.4784 | 49206 | 49530 | 0.92 |
| 49853 | ||||
| 7.5 | 214.8588 | 30157 | 30336 | 0.83 |
| 30514 | ||||
| 5 | 143.2392 | 10214 | 10224 | 0.14 |
| 10234 | ||||
| R2= | 0.99908 | Slope= | 272.6805 | |
| Intercept= | -28733.2679 | |||
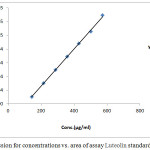 |
Figure 2: Regression for concentrations vs. area of assay Luteolin standard. |
Precision
System Repeatability
In this test, system repeatability tests were examined and standard solutions containing Vanillic acid were Prepared, and injected 10 times into the HPLC system. Average of peak areas and % RSD values were calculated and shows to be within acceptable limits of 0.98%. The resulting areas and RSD values shown in Table 3.
Table 3: System precision for vanillic acid standard.
| Area under the curve for 10 replicate injections | |
| Injection # | Standard area of Vanillic Acid |
| 1 | 110246472 |
| 2 | 111954152 |
| 3 | 109265151 |
| 4 | 110448955 |
| 5 | 112542944 |
| 6 | 111111762 |
| 7 | 110796209 |
| 8 | 108973254 |
| 9 | 111229759 |
| 10 | 110073105 |
| Average | 110664176.3 |
| RSD | 0.98 |
Analysis Repeatability
For the determination of the repeatability of the extract, six samples obtained from multiple sampling of extract were analyzed, in a single laboratory on a single day. Assay percentage, and RSD values were calculated. The results obtained are listed in Table 4.
Table 4: Analysis repeatability extract.
| Dry Extract | Sample # | Assay% of Vanillic Acid | Assay % of Luteolin |
| 1 | 0.13 | 0.43 | |
| 2 | 0.13 | 0.42 | |
| 3 | 0.14 | 0.47 | |
| 4 | 0.13 | 0.42 | |
| 5 | 0.14 | 0.46 | |
| 6 | 0.13 | 0.41 | |
| Average | 0.13 | 0.44 | |
| RSD % | 3.5 | 5.1 |
Range
Range is the concentration interval between the upper and lower concentration of analyte for which is shown that the method has suitable level of linearity. Range for determination is extended from 25% to 100% vanillic acid.
Limit of Detection
Limit of detection (LOD) is the lowest concentration of analyte in a sample, which can be detected, but not necessary quantified, under the stated experiment conditions.
For vanillic acid it is estimated by extrapolation of regression line through Y axis from standard curve at low concentration as in the following expression:
The LOD was found to be 0.40 (µg/ml) for vanillic acid which is equivalent to 0.2% and 1.2(µg/ml) which is equivalent to 0.6% of nominal value of Luteolin respectively.
Limit of Quantitation
The limit of quantitation (LOQ) is the lowest concentration of analyte in a sample, which can be determined with an acceptable accuracy and precision detected.
For Vanillic acid is estimated by extrapolation of regression line through Y axis from standard curve at low concentration as in the following expression (Fig. 3 and 4).
The LOQ was found to be 1.2 (µg/ml) for vanillic acid which is equivalent to 0.6% of nominal value and 9.7(µg/ml) which is equivalent to 4.8% of nominal value of Luteolin respectively (Tables 6, 7 and 8).
Table 5: Standard solution of vanillic acid prepared for calculation of LOD and LOQ.
| Injection(µL) | Concentration (µg/ml) | Area | Average | RSD |
| 10 | 99.5000 | 19482803 | 19495800 | 0.09 |
| 19508796 | ||||
| 7.5 | 74.6250 | 14549070 | 14537364 | 0.11 |
| 14525657 | ||||
| 5.0 | 49.7500 | 9651494 | 9662163 | 0.16 |
| 9672831 | ||||
| R2= 0.99998 | Slope= 197661.0452 | |||
| Intercept = -185347.0000 | SD of Intercept = 24027.8748 | |||
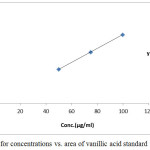 |
Figure 3: Regression for concentrations vs. area of vanillic acid standard for LOD and LOQ. |
Table 6: LOD and LOQ of vanillic acid estimation results.
| Parameter | Concentration | Percentage from Nominal |
| LOD | 0.40 (µg/ml) | 0.2% |
| LOQ | 1.2 (µg/ml) | 0.6% |
Table 7: Standard solution of luteolin prepared for calculation of LOD and LOQ.
| Linearity of Luteolin for LOD & LOQ | ||||
| Injection (µL) | Concentration (µg/ml) | Area | Average | RSD |
| 10 | 286.4784 | 49206 | 49530 | 0.92 |
| 49853 | ||||
| 7.5 | 214.8588 | 30157 | 30336 | 0.83 |
| 30514 | ||||
| 5 | 143.2392 | 10214 | 10224 | 0.14 |
| 10234 | ||||
| R2=0.99982 | Slope= 274.4046 | |||
| Intercept =-28928.5833 | SD of intercept = 264.8594 | |||
| LOD Conc.= 3.19 | LOD %= 1.6 | |||
| LOQ Conc.=9.7 | LOQ%=4.8 | |||
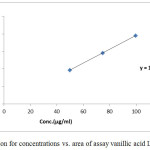 |
Figure 4: Regression for concentrations vs. area of assay vanillic acid Luteolin standard. |
Table 8: LOD and LOQ of Luteolin estimation results.
| Parameter | Concentration | Percentage from Nominal |
| LOD | 3.19 (µg/ml) | 1.6% |
| LOQ | 9.7 (µg/ml) | 4.8% |
Filter compatibility
Variation of the filter type is described below and the results are reported in Table 9.
Table 9: Filter compatibility results.
| Vanillic acid | ||
| Filter type | Area of Standard | Change % from unfiltered |
| Unfiltered | 110448955 | – |
| 0.45µm Glass | 112401742 | 101.8 |
| 0.45 µm Nylon | 111021145 | 100.5 |
| 0.45µm PTFE | 112251423 | 101.6 |
Several attempts were used to develop a reverse phase HPLC method of analysis for the separation of the two main components luteolin and vanillic acid available in dry extract of Paronychia.
A suitable mobile phase was established to separate the two major compounds of the extract in one run with a suitable and reasonable time, where both vanillic acid and luteolin were detected at a wavelength of 260 nm, and a sample preparation was injected into the chromatograph and two peaks appear at retention times of 1.3 min, 5.7 min respectively and a runtime of 15 minutes and at a flow rate of 1.0 ml\min using ODS-3 (150X4.6) mm, 5 µm.
A baseline resolution was obtained under the testing of the analysis conditions, as well as the chromatograms of the standards and samples preparation are shown in Fig. ( 5, 6 and 7). this method has been validated as per ICH guidelines for linearity, precision, limit of detection and limit of quantitation for both main active components, and a linear relationship was noticed for the two compounds and the correlation coefficient was R2 = 0.9998. With such results of the precision, repeatability LOD, LOQ and filter compatibility, it can be concluded that the method developed and used is precise, sensitive accurate and reproducible, and facilitate quantitative determination of this extract and will accomplish the objective of this study and consequently utilizing a local Jordanian plant since the active materials in the extract are variable. The concentration of luteolin and vanillic acid in the dry extract was 0.4 and 0.1% respectively.
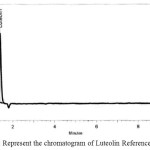 |
Figure 5: Represent the chromatogram of Luteolin Reference Standard. Click here to View figure |
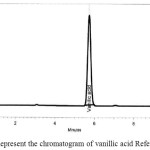 |
Figure 6: Represent the chromatogram of vanillic acid Reference Standard. |
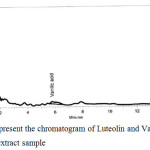 |
Figure 7: Represent the chromatogram of Luteolin and Vanillic Acid in dry extract sample. |
Table 10: Rf values, areas under the curve and percentage of the area for Luteolin and Vanillic acid.
| Peak Number | Ingredient name | Rf | Area | Theoretical plates | Asymmetry | Area% |
| 1 | Luteolin | 1.3 | 33798868 | 1903 | 1.2 | 79.0 |
| 2 | Vanillic acid | 5.7 | 8971344 | 511 | 3.1 | 21.0 |
Conclusion
The two major peaks of Luteolin and Vanillic acid were simultaneously separated and determined successfully from the other components in the Paronychia argentea Lam dry extract collected form the plant located in Jordan and was found that the Luteolin content is 0.4% while vanillic acid content is 0.1% using a validated chromatographic method of analysis. These two compounds are considered as a standardized reference of the plant material.
Conflict of Interest
There is no conflict of interest.
Acknowledgments
The Authors acknowledged the technical support of Cargil and its team during analysis of Paronychia argentea Lam in the dry extract and Dr. Isra Dmour for her assistance, and wishes to thank the Deanship of Scientific Research of Al-Ahliyya Amman University. Amman – Jordan for Financial support.
References
- Al Rawashdeh, I.and Al Rawashdeh, N. Biology Agriculture healthcare, 2016,6, 128.
- Al-Khalil, S.. International Journal of Pharmacognosy, 1995,33, 317.
CrossRef - Ahmed, S.: Mallick I. and Hasan, M. J. Pharmacogn. Phytochem., 2017, 6: 1780-1787.
- Afifi, F.: Al-Khalidi, B. and Khalil, E. J Ethnopharmacol. 2005,100(3):314-8.
CrossRef - Hamdan, I. and Afifi F. J Ethnopharmacol. 2004, 93(1):117-21.
CrossRef - Ali-Shtayeh M.; Yaniv, Z. and Mahajna J. J Ethnopharmacol. 2000,73(1-2):221-32.
CrossRef - Ferreira, A.; Proença, C.; Serralheiro, M.; Araújo, M. J Ethnopharmacol. 2006, 108(1):31-7.
CrossRef - Tawaha, K.; Alali, F. Q.; Gharaibeh, M.; Mohammad, M.; El-Elimat, T. Food Chemistry, 2007; 104, 1372.
CrossRef - Szallasi, A. Drug Aging., 2001, 18, 561.
CrossRef - Baqi, Y. N. H., University of Jordan. MSc Thesis, 2003.
- Vriens, J.; Appendino, G.; Nilius, B.Molecular Pharmacology, 2009; 75, 1262.
CrossRef

This work is licensed under a Creative Commons Attribution 4.0 International License.


