Synthesis, Spectral and Biochemical Studies of New Complexes of Mixed Ligand Schiff Base and Anthranilic Acid
Saba H. Mahdi and Lekaa K. Abdul Karem
Department of Chemistry, College of Education for Pure Sciences, Ibn -Al-Haitham, University of Baghdad, Adhamiyah, Baghdad, 10001, Iraq.
Corresponding Author E-mail: dr.likaakhalid@gmail.com
DOI : http://dx.doi.org/10.13005/ojc/340349
Article Received on : March 17, 2018
Article Accepted on : May 27, 2018
Article Published : 01 Jun 2018
In this rescrch,new mixed ligand Schiff base complexes of Mn(II),Co(II),Ni(II),Cu(II), Cd(II), and Hg(II) are formulated from the Schiff base( L)resulting from o-phathalaldehyde(o-PA) with p-nitroaniline(p-NA)as a primary ligand and anthranilic acid as a subordinate ligand. Diagnosis of prepared Ligand and its complexes is done by spectral methods mass spectrometer;1H -NMR for ligand Schiff base FTIR, UV-Vis, molar conductance, elemental microanalyses, atomic absoption and magnetic susceptibility. The analytical studies for the all new complexes have shown octahedral geometries. The study of organicperformance of ligand Schiff base and its complexes show various activity agansit four type of bactria two gram (+) and two gram (-) .
KEYWORDS:Biological Activity; Ligand Schiff Base; Microanalyses
Download this article as:| Copy the following to cite this article: Mahdi S. H, Karem L. K. A. Synthesis, Spectral and Biochemical Studies of New Complexes of Mixed Ligand Schiff Base and Anthranilic Acid. Orient J Chem 2018;34(3). |
| Copy the following to cite this URL: Mahdi S. H, Karem L. K. A. Synthesis, Spectral and Biochemical Studies of New Complexes of Mixed Ligand Schiff Base and Anthranilic Acid. Orient J Chem 2018;34(3). Available from: http://www.orientjchem.org/?p=46367 |
Introduction
Schiff base stands for an imperative type of ligand in chemical coordinating to find comprehensive enforcement in diverse domains as biological, inorganic, analytical, and artificial chemistry branches.1,2 Schiff bases are derived from aromatic-carbonyl compounds, and they have been more studied in linkage with metal ion.3 Tetra dentate schiff bases (L1-L3), which drevied from the reaction of o-phthalaldehyde with 2-amino benzyl alcohol, 2-amino-2-methyl-1-propanol, and 2-aminobenzohydrazine,have been reacted with [RuCl2(DMSO)4]. The prepared ligand and their complexesare characterized by spctroscopic methods.4 Macrocyclic Schiff Basic metal complexes, derived from o-pathalaldehyde, have recently been reported by Shaker and et al., through Template method.5 New three complexes are prepared from o-phthalaldrhde with coblt(II), nickel(II) acetate and perchlorate salts VO(II). The complexes are diagnosed by physiochemical instrument molar conductivity, FTIR, and elemantal analysis.6 Studies towards synthesis of new coordination compounds and their catalytic activities have been continued. Ponnusamy and co-works synthesized (N4 and N2O2) tetradentate ligands of the o-pathalaldehyde (o-PA) by the non-mould method, and Co, pd and Ru complexes.7 Schiff base ligand is derived from the concentration of o-phthalaldehyde with the glycyl glycine amino acid. The data have been described using analytical, spectral, thermal, and magnetic data. Furthermore, these mineral complexes have also been applied as potential antibacterial agents.8 Synthesis and catalytic applications of the schiff base ligand with metal (II) transition are derived from o-pthalaldehyde.9 In this work, we have prepared and characterized new complexes with mixed ligand schiff base and anthranilicacid with some metal ions.
Materials and Devices
All chemicals, used in laboratory work,are of highest purity that does not need any further purity, and they have been purchased from distigushed sources. Melting points are carried out via Stuart Melting Point Kit. Elemental micro analysis of the ligand is conducted by Euro (EA 3000) instrument. 1H NMR spectra are obtained using Brucker DRX system (400 MHz). UV-Vis spectra are performed on a Shimadzu UV- 160A Ultra Violet-Visible Spectrophotometer in KBr discs on (4000-400) cm-1 range. The IR-spectra are verifiedby FTIR- 8400S Spectrophotometer. Metal contents (A.A.S) of the complexes are carried out, using atomic absorption methodby means of AA 620G Shimadzu spectrophotometer. The Chloride substances of compounds are specifiedby testing all complexes and decomposed with Nitric acid, and diluted with water. Results of the magnetic measuresare found out by using Bruker BM6 instrument at room temperature and the Faraday’s method.
Synthesis of (N,N’E,N,N’E)-N,N’-(1,2-phenylenebis(methan-1-yl-1-ylidene))bis(4-nitroaniline) (L)
A solution of 4-nitroaniline (0.276g ,2mol) in 10 ml ethanol has beeninserted to a mixture solution of o-phthalaldehyde (0.134g, 1 mol) in 5ml ethanol and three drops of glacial acetic acid, and the product combination has been refluxed for 4h.10 The resulted brown solid is composed by filtration, recrystallisation from aceton absolute, and dried under m.p (189°C), yield 87% Schem-1.
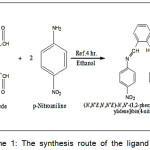 |
Scheme 1: The synthesis route of the ligand L |
Synthesis of the Mixed Ligand Complexes
A solution of schiff base ligand (0.374g, 1mmol) in 5ml absolute ethanol, (anthranilic acid 0.274g and NaOH 0.08g) 2 mmol are added to stirred (1 mmol of metal chlorid) in 10 ml ethanol;0.126g Mn(II)chloride, 0.237g Co(II) chlorid.6H2O,0.237g Ni(II) chloride.6H2O, 0.17Cu(II) chlorid.2H2O,0.201g Cd(II) chlorid.H2O, and 0.272 g Hg(II) chlorid. The product mixture is stirred for sixty minutes and, then, the result is filtered and dried through anhydrous CaCl2. The physical properties of schiff ligand and new compounds have been presented in table-1.
Biological Activity
The Schiff base and their metal compounds are investigated with four bacteria psuedomonas aruginosa, Escharia coli, Staphylococcus aureus and Streptococcus pyogenes by disc diffusion technique.The chemical solutions, used in the biological study, are prepared by using dimethyl sulfoxide (DMSO) as solvent, and they are provided as a single concentration of 1×10⁻³ M. The dishes are incubated at room temperature for 24 h. The inhibition zones (IZ) in mm is formed after 24h as a criterion for the intensity of the synthetic chemical compound effect on the outgrowth of cultivated specific bacteria strains.
![Figure 1: The synthesis route of [L1(M)(Anth)2] complexe](http://www.orientjchem.org/wp-content/uploads/2018/06/Vol34No3_Syn_Lek_fig1-150x150.jpg) |
Figure 1: The synthesis route of [L1(M)(Anth)2] complexe Click here to View figure |
Result and Discussion
Generally, all the complexes are soluble in DMSO and DMF but insoluble in water. The CHN analysis and the sensible features of the compounds are listed in table-1. The complexes can be symbolized as [M (L)(Anth)2] when M=metal(II) ions, (L=Schiff base ligand), and (Anth= anthranilic acid).
Table 1: The details of Schiff ligand and new compounds
|
Complexes |
code |
M.wt |
M.P oC |
Color |
Theoretical ( Calc.) |
||||
|
|
C |
H |
N |
O |
M |
||||
|
C20H14N4O |
L |
347.35 |
187 – 189 |
Brown |
64.17 |
3.77 |
14.97 |
17.10 |
—– |
|
Mn (L)(Anth)2 C34H26MnN6O8 |
C1 |
701.54 |
250 |
Pail – brown |
58.21 |
3.74 |
11.98 |
18.24 |
7.83 (7.03) |
|
Co(L)(Anth)2 C34H26CoN6O8 |
C2 |
705.54 |
270 |
Brown |
57.88 |
3.71 |
11.91 |
18.14 |
8.35 (7.32)
|
|
Ni (L)(Anth)2 C34H26NiN6O8 |
C3 |
705.30 |
250 |
Pail-brown |
57.90 |
3.72 |
11.92 |
18.15 |
8.32 (7.03) |
|
Cu(L)(Anth)2 C34H26CuN6O8 |
C4 |
710.15 |
230 |
Orange |
57.50 |
3.69 |
11.83 |
18.12 |
8.95 (7.96) |
|
Cd(L)(Anth)2 C34H26CdN6O8 |
C5 |
759.02 |
250 |
Pail-brown |
53.80 |
3.45 |
11.07 |
16.86 |
14.81 (13.57) |
|
Hg( L)(Anth)2 C34H26HgN6O8 |
C6 |
847.20 |
170 – 172 |
Dark brown |
48.20 |
3.09 |
9.92 |
15.11 |
23.68 (22.23) |
Mass Spectrum
Mass Spectrum of Schiff base ligand is carried out to determine its molecular weight and fragmentation pattern as explained in Figure-2 and table-2.11,12
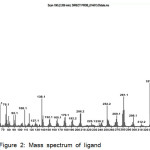 |
Figure 2: Mass spectrum of ligand |
Table 2: The fragmentation data for the (L)
|
L |
Assignments |
Peak m/z |
|
M= (C20H14N4O2) |
373 |
|
|
M- N2O4 = M1 |
281 |
|
|
M1 – C6H4 = M2 |
206 |
|
|
M2 – N=CH = M3 |
179 |
|
|
M3 – C7H5N = M4 |
76 |
1H-NMR Spectral Data of L
The 1H-NMR spectrums of the synthesized Schiff base ligand (L) in DMSO-d6are shown in Fig-3 and table -3. The singlet signal appeared at (δ= 2.45 ppm) can be assigned to the solvent DMSO. The multiple signals, ranged between (δ= 6.55-8.36), are assigned to the aromatic protons of the phenyl, and the doublet signal at (δ= 8.44) is attributed to the azomethine proton (HC=N) .13, 14
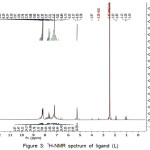 |
Figure 3: 1H-NMR spctrum of ligand (L) |
Table 3: 1H-NMR Spectral data for measured Land chemical shift in ppm
|
Ligand |
Functional group |
δ(ppm) |
|
L |
DMSO-d6 |
2.45 |
|
Ar-H |
6.55 – 8.36 (12H, m) |
|
|
N=C-H |
8.44(2H, s) |
FTIR Spectra
The FTIR spectrum of (L) is in KBr disc in range of (4000-400) cm-1. Figure-4 shows the weak absorption band at 3111 cm-1 which has been consigned for the (C-H) aromatic stretching vibration. The medium band at 1622 cm-1 is assigned to the (HC=N) stretching vibration, and the band at 1577 cm-1 is allocated for the (C=C) stretching vibration.15 The FTIR spectrum of Anthranilic acid shows bands of υ(O-H),υ(NH2), υas (COO), and υs (COO) at (3390) and (3324,3240), 1679, and 1486 cm-1 respectively.16 In complexes, υ(O-H) is disappeared, and υ(NH2) is shifted to higher frequencies for all complexes without C1 and C2, making NH2 in an active location of coordinate. The bands of υas and υs(COO) in all these complexes shifted to higher frequencies for υasy (COO), and lower frequencies for υsym (COO).Therefore,the difference between Δas-s is equal to (235-247) cm-1 that indicates the carboxlate ion coordination with the metal ions, and it is considered as mono dentatedonor.17,18 New spectra have been appeared in the bands of all compounds in the regions (559-570) cm-1 which refer to υ(M-O) mode.19 The bands at (486-489) cm-1 refer to υ(M-N) mode.20,21
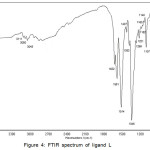 |
Figure 4: FTIR spectrum of ligand L |
Table 4: FTIR details of cm-1 free ligands and its compounds
|
Comp. |
υ(O-H) |
υ(N-H) |
υ(C-H) arom. |
υ(COO) as & s |
Δ as-s |
υ(C=N) |
υ(M-N) |
υ(M-O) |
|
L1 |
—- |
—- |
3111 |
—- |
—- |
1622 |
—- |
—-
|
|
Anth |
3390 |
3321 3210 |
2586 |
1679 1486 |
—– |
—— |
—- |
—- |
|
C1 |
— |
3305 3232 |
3143 3082 |
1693 1454 |
239 |
1654 |
559 536 |
489 |
|
C2 |
—- |
3303 3224 |
3136 3086 |
1693 1458 |
235 |
1654 |
563 |
489 |
|
C3 |
—- |
3363 3302 |
3120 3082 |
1693 1454 |
239 |
1654 |
567 |
489 |
|
C4 |
—- |
3402 3275 |
3120 2924 |
1693 1458 |
235 |
1600 |
574 |
489 |
|
C5 |
—- |
3360 3290 |
3136 3086 |
1693 1450 |
243 |
1654 |
574 |
489 |
|
C6 |
—- |
3329 3263 |
3113 3078 |
1693 1446 |
247 |
1654 |
563 |
489 |
Electrnic Spectra, Molar Conductivity, and Magnetic Moments
The UV-Vis. band of ligand (L) is shown in Fig-5. The spectrum exhibits three peaks; one of them is in (286 nm) due to (π→ π*) electronic shift while the others are in (345, and 358 nm) due to (n → π*) electronic shift.22,23 The UV-Vis. spectrum of C1 complex shows five absorption peaks. The three absorption peaks at (264, 329 and 345) nm are due to intra ligand comparably with the spectrum of (L1). The fourth absorption peak is at (380 nm ) assigned for charge transfer (C.T), and the last one has a weak intense peak at (448 nm), which indicates that there is a (d-d) electronic transition type6A1g→4T2g(G), and this proves an octahedral structure around Mn(II) complex.24 The UV-Vis band of C2 compound has five absorption peaks; three absorption peaks are at (279, 327 and 347) nm assigned for intra ligand, and two new absorption peaks, with weak intensity, are at (739 and 790 nm) due to (d-d) type4T1g(F)→4A2g(F) transition; this indicates that there is an octahedral structure around Co(II) complex.25,26 The UV-Vis. band of C3 compound shows five absorption peaks, the low absorption peaks are at (267 and 345) nm assigned for intra ligand. The absorption peak at (357 nm) is attributed to charge transfer (C.T). C3 has weak intensity (777 and 826) nm due to types 3A2g(F)→3T1g(F) and 3A2g(F)→3T2g(F)transitions, which support the existence of an octahedral structure around Ni(II) complex.27 The UV-Vis. spectrum of C4 complex displays three absorption peaks; the highest absorption peaks at (345 nm ) is assigned to charge transfer (C.T), and the peak at (270 nm) is due to intra ligand. The third absorption peak with weak intensity at (800 nm ) is attributed to2Eg→2T2g. These peaks are congruencein location with the researches of octahedral Cu(II).28 The UV-Vis. spectra of C5 and C6 complexes, show absorption peaks at (264 and 266) nm, respectively, and are assigned to intra ligand. The peaks at (342 and 345) nm are due to charge transfer (C.T) that shows diamagnetic as perspective from their electronic arranging. They support that there is an octahedral structure around Cd(II) and Hg(II) complexes.29 The molar conductivities indicate that all complexes are non-electrolytes. Magnetic moment values show that there is an octahedral arrangement around the metal (II) ions [18] as revealed in table-4.
Table 4: Spectral and magnetic moments (nm) of the complexes
|
Compounds |
λmax. |
ῡ cm-1 |
ϵ max. mol-1.L.cm-1 |
Assignments |
Molar Cond. |
µeff (BM) |
|
L |
286 345 358 |
34965 28986 27933 |
893 2019 1134 |
π → π* n → π* n → π* |
— |
— |
|
C1 |
264 329 345 380 448 |
37879 30395 28986 26316 22321 |
1006 1783 1973 75 22 |
Intra-ligand Intra-ligand Intra-ligand C.T 6A1g → 4T2g(G) |
0.95 |
5.72 |
|
C2 |
279 327 347 739 790 |
35842 30581 28818 13532 12658 |
1051 1228 1454 38 35 |
Intra-ligand Intra-ligand C.T. 4T1g(F) → 4A2g(f) 4T1g(F) → 4T2g(f) |
1.09 |
4.72 |
|
C3 |
267 345 357 777 826 |
37435 28986 28011 12870 12107 |
1000 1635 1011 15 13 |
Intra-ligand Intra-ligand C.T. 3A2g(F)→ 3T1g(F) 3A2g(F)→ 3T2g(F) |
1.83 |
4.61 |
|
C4 |
270 345 800 |
37037 28986 12500 |
1182 2023 49 |
Intra-ligand C.T. 2Eg → 2T2g |
0.89 |
1.83 |
|
C5 |
264 342 |
37879 29239 |
1010 2312 |
Intra ligand C.T. |
0.87 |
Dia. |
|
C6 |
266 345 |
37594 28986 |
1143 2063 |
Intra ligand C.T. |
1.57 |
Dia |
Boiological Activity
The schiff base ligand [L] and the corresponding metal compounds under study are tested against four antimicrobial activities; psuedomonas aruginosaand Escharia coli (G -), Staphylococcus aureus and Streptococcus pyogenes (G+) by plate well into agar nutrient method. Antimicrobial activity is expressed in millimeters (mm) by measuring the diameters of the inhibitory region and contrasting with the DMSO control; the values areexplained in Table -6,figure -5 and chart-1.30,31
Table 5: Antibacterial performance of the ligand and their metal compounds
|
Comp. |
Staphylococcus aureus |
Streptococcus pyogenes |
psuedomonas aruginosa |
Escharia coli |
|
DMSO |
zero |
zero |
zero |
Zero |
|
L |
zero |
zero |
zero |
Zero |
|
C1 |
zero |
zero |
zero |
Zero |
|
C2 |
16 |
14 |
20 |
17 |
|
C3 |
zero |
zero |
zero |
Zero |
|
C4 |
25 |
zero |
zero |
Zero |
|
C5 |
30 |
21 |
17 |
20 |
|
C6 |
30 |
25 |
18 |
17 |
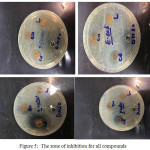 |
Figure 5: The zone of inhibition for all compounds |
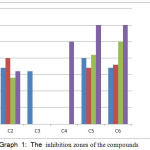 |
Graph 1: The inhibition zones of the compounds |
Conclusion
The new Schiff base derived from o-phathalaldehyde with p-nitroaniline is synthesized and characterized. The results show the coordination of L format with metal ions through the N as a donor atom. The results of the electron spectra and the magnetic susceptibility of all complexes show that these complexes are of octagonal geometry. The composite compounds are studied as antimicrobial, and the results reveal that C2,C5 and C6 complexes have various activities against bacteria, while L, C1 and C2 are inactive against two types of bactria.
Acknowledgement
The authors express their sincere appreciation to Chemistry Department, College of Education for Pure Sciences in Ibn –Al Haitham, University in Baghdad, Iraq for the fiscalsupportof this study.
References
- Anand, P.; Patil V.M.; Sharma, V.K.; Khosa, R.L.; Masand, V.N.International Journal ofDrug Design and Discovery2012, 3, 851.
- Krishna, E.R.; Reddy, P.M.; Sarangapani, M.. Spectrochim. Acta Part A-Molecular and Biomolecular Spectroscopy.2012,97, 189-196.
- Vaidehi, B.N.B.; Surya, T.K.; Prabhakar, N.V. Int J Pharm Bio Sci. 2013, 4(4), 829 – 837.
- Sreenivas, V.; Aruna, M.; Prasanna, B.; Ravinder, V.JCHPS2014, 37-38.
- Shakir, M.; Khanam, S.; Azam, M.; Aatif, M.; Firdaus, F.J. Coord. Chem.2011, 64(18), 3158-3168.
CrossRef - Sandhanamalar, D.; Vedanayaki, S.; Rajavel, R.Journal of Pharmacy and technology2012, 4(1), 4018-4031.
- Chan, K.E.; Edelman, E.R.; Wenger, J.B.; Thadhani, R.I.; Maddux, F.W. Dabigatran and Rivaroxaban Use in Atrial Fibrillation Patients on Hemodialysis 2015, Circulation.
- Voguri, H. B.; Venkateswara, K.R.; Podisetty, H.; Badde, S.; More, A.Int. J.ChemTech Research2017, 10 (5), 136-143.
- Venugopal, P.; Bhaskar, S.; Muralidhar, P.R.Int. J. ChemTech Research2018, 11 (01), 167-176.
- Sandhanamalar, D.,Vedanayaki, S.; Rajave, R. IJPT2012, 4 (1), 4018-4031.
- Patel, K.S.; Rinehart, K.L.; Bailar, J.C.Organic Mass Spectrometry1970, 4, 441.
CrossRef - Mohamed, G.G.; Omar, M.M.; Hindy, A.M. Turk. J. Chem. 2006, 30, 361.
- Simons, W.W. The Sadtler Handbook of Proton NMR Spectra, Sadtler Re-search Laboratories, Philadelphia, Sadtlerk, 1978.
- Ahlam, J.A.; Asmaa, M.N.K.J Inorg Biochem. 2013, 1-14
- Socrates, G. Infrared Characteristic Group Frequencies. 2nd. ED. John Willey Sons, 1994, 98.
- Lekaa, K.A.K. Synthesis, Characterization And BiologicalEvaluation of New Schiff Bases Mixed Ligand Metal Complexes of Some Drug substances,Submitted to collage of education for pure sciences Ibn Al Haitham of Baghdad University in partial fulfillment of the requirements for the degree of doctorate of science in chemistry.2016.
- Pisarewicz, K.; Mora, D.; Flueger, P.F.; Fields, G.; Marí, F. J. Am. Chem. Soc.2005, 127, 6207.
CrossRef - Vogel, A.I.A. Text Book of Quantitative Inorganic Analysis. 2nd Ed. (Longman, London).1978, 694.
- Raju, A.; Saravanan, S.; Ekamparam, A.; Rangappan, R. Chem Sci Trans. 2017, 6(2), 277-287.
- Rawate, G.D. Chemical Science Transaction. 2014, 3(4), 1396-1399.
- Taghreed, H.A.N.; Lekaa, K.A.K.Chemistry and Materials Research.2015, 7 (3), 32-39.
- Sangamesh, A.; Patil, M.; Ajaykumar, M.; Kulkarni, D.; Badami, P.S. Complex Metals.2017, 03, 128.
- Lever, A.B.P. Inorganic Electronic Spectroscopy.2nd Ed. Elsevier. in Amsterdam, New York,1984.
- Rehab, K.A.S.; Lekaa, K.A.K.; Wurood, A.J.Baghdad Science Journal.2017,14(2), 390-402.
- Lateef, S.M.; Sarhan, B. M.; AlSaedi, W.A.J. Inter. J. of Eng. Sci. and Research Techn.2015, 4(2), 606-620.
- Fernandez, T.M.J.Inter. J. of Chem.2013, 9(2), 33-40.
- Meixian, H.u.; Ning, L.i.; Kemin, Yao.Front.Chem.China2006, 4, 369−373.
- Sharma, R.; Samadhiya, P.; Srivastava, S.D.; Srivastava, S.K.Org.Commun. 2011, 4(2), 42-51.
- Dudley, H.W.; Fleming, I. Part A: Spectroscopic methods in organic chemistry. 3nd Ed., England,1980.
- Reham, H.; Hassan, A.; Manal, M.; Nehad, A.L.J .of Chem. 2013, 20(13), 10.
- Taghreed, H.A.N.; Lekaa, K.A.K.J. of Med.Sci.2016, 3(2), 64-75.21.

This work is licensed under a Creative Commons Attribution 4.0 International License.


