New Route to Synthesize of Graphene Nano Sheets
R. Siburian1,2 , H. Sihotang1, S. Lumban Raja1, M. Supeno1 and C. Simanjuntak1
1Chemistry Department, Faculty of Mathematics and Natural Sciences, Universitas Sumatera Utara.
2Nano Medicine Excellent Center, Universitas Sumatera Utara.
Cressponding Author E-mail: riksonsiburian2000@yahoo.com
DOI : http://dx.doi.org/10.13005/ojc/340120
Synthesized of graphene nano sheets were carried out by using new route and ammonia as well as to produce gram scale graphene. Graphene nano sheets was characterized by using Fourier transform infrared spectroscopy (FTIR), X-ray powder diffraction (XRD), and Scanning Electron Microscopy-Energy Dispersive X-Ray (SEM-EDX). The results of XRD showed that the reemergence of diffraction lines C(002) at 2θ =26.5°, and the distance between the planes is 3.35 Å, which shows the typical structure of graphite and multiple layer of graphene. The results of SEM-EDX showed that the particle size and the graphene nano sheets has a smaller pore size and uniform and randomly arranged aggregates with a thin layer which is closely related to one another. Graphene nano sheets has small size or shape is small and thin also aggregate related with each other.
KEYWORDS:Graphite; Graphene Oxide; Graphene Nano Sheets; FTIR; XRD; SEM-EDX
Download this article as:| Copy the following to cite this article: Siburian R, Sihotang H, Raja S. L, Supeno M, Simanjuntak C. New Route to Synthesize of Graphene Nano Sheets. Orient J Chem 2018;34(1). |
| Copy the following to cite this URL: Siburian R, Sihotang H, Raja S. L, Supeno M, Simanjuntak C. New Route to Synthesize of Graphene Nano Sheets. Orient J Chem 2018;34(1). Available from: http://www.orientjchem.org/?p=42711 |
Introduction
Graphene is a two-dimensional carbon with one layer. Graphene possesses superior properties including unique electronic properties due to its high electron mobility (20 × 103 cm2 v-1 s-1),1 mechanical resistance.2 Super-thermal properties (~ 5000 Wm-1K-1),3 large surface area (2630 m2 g-1),4 so it can be used in fuel cells and capacitors.
Graphene production may be carried out by various methods: (i) mechanical methods, via adhesion tape or chemical exfoliation methods1 embedded in graphite to collect carbon powder samples, and gradually released to produce graphene sheets. However, this method has a weakness in the aspect of its irreproducibility (it cannot be produced further), (ii) epitaxial growth method in silicon carbide that is heating silicon carbide at high temperature (> 1.100ºC). This process produces a graphene epitaxial with dimensions depending on the size of the SiC substrate and the resulting small sample which does not allow it to be used in electronic application fabrication techniques, (iii) epitaxial growth methods on the metal substrate. This method has the disadvantages of not producing a sheet of graphene with a uniform thickness, and the bond between the bottom graphene sheet and the substrate can affect the properties of the carbon layer. The cost required for this graphene synthesis is also relatively expensive, both adhesion tape method and epitaxial growth method.
Currently, the production of graphene is mostly done by chemical method by oxidizing graphite to graphene oxide and then reducing with hydrazine to produce graphene. This method is very simple and can produce large scale production of graphene.5 The disadvantage of this method is the graphene is not single layer and also hydrazine is very toxic (carcinogenic agent).
The reduction of graphene oxide to be graphene is very important in order to produce graphene. Reduction of graphene oxide by non-hydrazine is needed be developed. This is caused, hydrazine is carcinogenic. In this study, we used ammonia as a reducing agent to reduce graphene oxide to be grapheme nano sheets. That is possible due to ammonia is an environmentally friendly reducer in a small concentration range. In this research, the ammonia is expected to interact with the carbonyl, hydroxyl, and epoxide groups of graphene oxide. Therefore, we reported the simple and inexpensive method to produce graphene by oxidation of graphite tobe a graphene oxide and then it was reduced to generate graphene.
Materials and Methods
Synthesis of Graphene Nano Sheets
0.2 g of graphite powder was inserted into 250 mL erlenmeyer, then it was added 0.2 g NaNO3 and 15 mL H2SO4 96%, respectively and stirred for 2 hours. After that, it was gradually added 1 g of KMnO4 and stirred for 24 hours to generate graphite solution. Subsequently, the solution was added 20 mL of H2SO4 5% and 1 mL of 30% H2O2, respectively and stirred for one hour. Then, the solution was centrifuged at a speed of 3000 Rotation per Minute (RPM) for 20 minutes to separate the filtrate and supernatant. The filtrate was added 10 mL ammonia 10 M and stirred for 48 hours and separate filtrate and precipitate, Finally, precipitate was dried at 80oC for 24 hours and characterized by using XRD and SEM-EDX, respectively.
Results and Discussion
Analysis of XRD
The XRD pattern of graphite, graphene oxide and graphene nano sheets can be shown in Figure 1. The graphite (Fig. 1) shows a sharp and tight peak (2θ = 26.5° and 23.88°) which corresponds to the diffraction line C (002) with the intercellular spacing in the crystal (d) respectively is 3.36 and 3.72 Å. The data shows the typical crystal structure of graphite. The graphene oxide (Fig. 1) shows a wide diffraction peak that is at 2θ = 11.6° with the spacing between plane (d) is 7.5 Å. Increasing the distance between fields in the graphene oxide is due to the presence of oxygen-functional groups and water molecules into the carbon layer structure. These are typical vertical oxides of graphene/graphite oxide.5 The small peaks are still observed at 2θ = 20.1°; 23.9° and 26.4° which indicates that graphene oxide is not fully interconnected with oxygen atoms.6,7 The Figure 1 shows that the chemical reduction of graphene oxide to graphene nano sheets using NH3, returns the structure of the crystal graphene nano sheets to be a more regularly. However, NH3 has not been able to create a single layered graphene nano sheets structure.
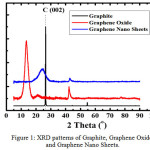 |
Figure 1: XRD patterns of Graphite, Graphene Oxide and Graphene Nano Sheets. Click here to View figure |
The resulting graphene nano sheets has a structure between the crystalline and amorphous structures. This is evidenced by the reappearance of the diffraction line C (002) which looks wider and the intensity is lower than the peak obtained in the graphite powder that is at 2θ = 26.5° with the distance between the fields is 3.35 Å and the diffraction peak eradication at 2θ = 11° which looks more flat than in graphene oxide.6,7 The reduction process must involve the removal of the oxygen functional group because the graphene nano sheets conjugate structure of the sp2 carbon bond must be reform during the reduction process, in which case the role is the opening of the epoxide ring.
Analysis of SEM-EDX
The microstructure and energy spectrum analysis data on the intensity of graphite, graphene oxide and graphene nano sheets are shown in Figures 2 and 3, respectively.
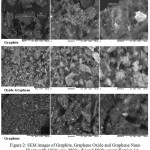 |
Figure 2: SEM images of Graphite, Graphene Oxide and Graphene Nano Sheets with 1000× (a), 2500× (b) and 5000× magnification (c) Click here to View figure |
The SEM data show that graphite has a wide and thick particle size indicated at 1000× magnification (Fig. 2a). The distance between the graphite particles looks wider with a far position. The result of SEM graphite at 2500× magnification (Fig. 2b) and 5000× (Fig. 2c), shows the existence of many stacks in the graphite structure indicating that graphite has a layered structure. The graphene oxide has smaller particle size and the formed aggregates are closely related to each other than graphite which can be seen at 1000× magnification (Fig. 2a). The images of graphene oxide at 2500× magnification (Fig. 2b) and 5000× (Fig. 2c) indicate the existence of fewer stacks indicating that there has been exfoliation of the structure on graphite. The graphene nano sheets has a ripple surface, a smaller and uniform size of particles and pore size, has a randomly arranged aggregate with a thin layer and is tightly linked to one another to form an irregular solid (magnification 1000×) compare to graphite and graphene oxide. However, the graphene nano sheets structure obtained has not been single layered. It is marked on the SEM graphene nano sheets results with 2500× magnification (Fig. 2b) and 5000× (Fig. 2c) which indicates a smoother buildup and is visibly reduced by the process of exfoliation of the structure. Graphene morphological differences with graphene oxide and graphite show that almost all oxygen groups in graphene oxide have been reduced with NH3. Furthermore, the EDX spectra of graphite, graphene oxide and graphene nano sheets are shown in Figure 3 – 5, respectively.
 |
Figure 3. EDX Spectra of Graphite. Click here to View figure |
EDX spectra data of graphite, graphene oxide and graphene nano sheets were measured at a voltage of 15 kV. The spectrum is a characteristic X-ray captured by a Si detector. The graphite EDX spectra data (Fig. 3) show that the carbon atoms (C) and oxygen atoms have the energy quantities captured by each detector at 0.15 and 0.25 keV. The large atomic intensity of C (Table 1) is due to the graphite structure consisting of the bonds of the carbon atoms. However, the graphite is not pure graphite which is only suspended over C atoms, since it still finds other elements such as Al, Si and. In addition, K, Al, Si and K appear probably due to the chamber effect of SEM-EDX. It is not due to the content of graphite. Furthermore, graphite was oxidized, centrifused and ultrasonicated to produce graphene oxide. The EDX spectra of graphene oxide are shown in Figure 4.
 |
Figure 4: EDX Spectra of Graphene Oxide. Click here to View figure |
The graphic EDX spectra of graphene oxide (Fig. 4) and the ratio of the number of elements (Table 1) show that the intensity of the C atom captured by the detector at 0.15 keV decreases and the oxygen (O) atom increases at 0.25 keV. Atom Al, Si and K are not detected in the graphite oxide structure. The loss of Al, Si and K atoms is caused by the addition of strong acid (H2SO4) into the graphite structure. The increase in O atoms is due to the oxidation process of graphite by strong oxidizers (KMnO4, NaNO3 and H2O2). Finally, graphene oxide was reduced by ammonia to generate graphene nano sheets. The EDX spectra of graphene nano sheets was shown in Figure 5.
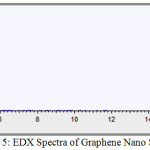 |
Figure 5: EDX Spectra of Graphene Nano Sheets. Click here to View figure |
Comparison of the number of elements of graphite, graphene oxide and graphene nano sheets can be shown in Table 1.
Table 1: Comparison of elements of Graphite, Graphene Oxide and Graphene Nano Sheets (EDX Data)
| Elements | Graphite | Graphene Oxide | Graphene Nano Sheets |
| Carbon (C) | 88.374 | 88.114 | 97.723 |
| Oxygen (O) | 9.200 | 11.886 | 2.277 |
| Aluminum (Al) | 1.032 | ||
| Silicon (Si) | 1.206 | ||
| Potassium (K) | 0.187 |
The graphene nano sheets EDX spectra data (Fig. 5) show that the intensity of the O atom captured by the detector at 0.25 keV decreases. This is supported by the comparative data of the number of elements (Table 1) showing that the grapheme nano sheets is mostly composed of atoms C and the percentage of the O at the graphene decreases. The addition of a reducing NH3 reduces the oxygen-functional groups that make up the graphne oxide structure. The oxygen atoms still detected in the grapheme nano sheets structure indicate that the reduction process of graphene oxide to grapheme nano sheets using ammonia is not yet perfect because there are other oxygen groups in the graphene structure. That is called graphene nano sheets.
Conclusion
Graphene nano sheets can be synthesized from graphite using ammonia reduction as well as a benign approaching. The graphene XRD pattern shows single-layered graphene due to the emergence of the diffraction peak at C (002). Characterization of SEM-EDX show that graphene has size and shape of small, thin and aggregate where graphene structures are closely related to each other and the reduced percentage of oxygen elements in graphene. The mechanism reaction of reduction graphene oxide used NH3 as a reductor agent occurring in the epoxy group. NH3 does not play a role in the de-hydroxylation, de-carbonylation and de-carboxylation processes due to the increased resistance of Gibbs Energy to NH3 if the temperature is increased above room temperature.
Acknowledgement
Authors would like to thankful to Lembaga Penelitian Universitas Sumatera Utara who supported funding of our research by the research grant: Penelitian TALENTA, Universitas Sumatera Utara, 2017, No. 5338/UN5.1.R/PPM/2017, Tanggal 22 Mei 2017.
References
- Geim, A. K.; Novoselov, K. S. Nature Material, 2007, 6, 183–91.
CrossRef - Lee, C.; Wei, X. D.; Kysar, J. W.; Hone, J. Science 2008, 321, 385–8.
CrossRef - Balandin, A. A.; Ghosh, S.; Bao, W.; Calizo, I.; Teweldebrhan, D.; Miao F. Nano Letter 2008, 8, 902–7.
CrossRef - Stoller, M. D.; Park, S. J.; Zhu,Y.; An, J. H.; Ruoff, R. S. Nano Letter 2008, 8, 3498−3502.
CrossRef - Siburian, R.; Sebayang, K.; Supeno, M.; Marpaung, H. Oriental Journal of Chemistry 2017, 33 , 134-140.
- Gao, X. J.; Jang. S.; Nagase. J. Phys. Chem. C 2009, 114, 832–842.
CrossRef - Hsiao, C.; Liao, S.; Yen, M.; Liu, P.; Pu, N.; Wang, C.; Ma, C. American Chemical Society 2010, 2, 3092–3099.

This work is licensed under a Creative Commons Attribution-NonCommercial-ShareAlike 4.0 International License.

This work is licensed under a Creative Commons Attribution 4.0 International License.


