Magnetically Separable ZnO-MnFe2O4 Nanocomposites Synthesized in organic-free Media for dye Degradation Under Natural Sunlight
Rahmayeni , Syukri Arief, Novesar Jamarun, Emriadi and Yeni Stiadi
Department of Chemistry, Faculty of Mathematic and Natural Sciences, Andalas University, Padang, 25163, Indonesia.
Corresponding Author E-mail: rahmayenni83@yahoo.com
DOI : http://dx.doi.org/10.13005/ojc/330608
Magnetically separable ZnO-MnFe2O4 nanocomposites were synthesized in organic-free media. The samples were characterized by several techniques. The photocatalytic activities of the nanocomposites were tested by degradation of Rhodamine B and wastewater of batik dye under natural sunlight irradiation. X-ray diffraction (XRD) pattern of composites is well in agreement with the standard of the hexagonal wurtzite phase of ZnO and spinel cubic phase of MnFe2O4. Scanning Electron Microscope (SEM) image illustrates the morphology of the nanocomposites are square plate-like and porous. The magnetic properties of composites were characterized by Vibrating Sample Magnetometer (VSM) show the superparamagnetic properties of all nanocomposites. Optical properties study indicated that addition of MnFe2O4 to ZnO decreases the band gap. The removal of Rhodamine B (10 mg L−1) and wastewater of batik dye solution by ZnO-MnFe2O4 (1:0.1) composite after 3 h reached 96.7% and 95.1 %.
KEYWORDS:ZnO-manganese Ferrite; Organic-free Media; Superparamagnetic; Dye; Sunlight
Download this article as:| Copy the following to cite this article: Rahmayeni R, Arief S, Jamarun N, Emriadi E, Stiadi Y. Magnetically Separable ZnO-MnFe2O4 Nanocomposites Synthesized in organic-free Media for dye Degradation Under Natural Sunlight. Orient J Chem 2017;33(6). |
| Copy the following to cite this URL: Rahmayeni R, Arief S, Jamarun N, Emriadi E, Stiadi Y. Magnetically Separable ZnO-MnFe2O4 Nanocomposites Synthesized in organic-free Media for dye Degradation Under Natural Sunlight. Orient J Chem 2017;33(6). Available from: http://www.orientjchem.org/?p=40424 |
Introduction
In recent years, some research works have revealed that ZnO nanoparticles as photocatalysts exhibit superior advantages than those of TiO2. Owing to their high activities, lower costs, higher quantum efficiency, biodegradation, and environment-friendly features, ZnO has been widely used as photocatalysts. Recently, a number of studies related to the syntheses of ZnO photocatalysts have been reported, including nanoparticles, nanorods, nanocrystals, nanotubes, and composite membrane1, 2. In fact, many of obtained products have the photocatalytic activities of ZnO are limited to irradiation wavelengths in the UV region which take only about 3–5% of the solar spectrum because they have wide band-gaps so it is not effective to be used in the visible light region of the sun3-5. Rapid recombination of photo generated electron-hole pairs still remains a problem to be solved in its application. Therefore, in tropical countries which possess water environment problems, particularly by dye pollution, this material offers a promising solution for environmental issues. Some researchers have made various modifications such as doped with metal6, 7, nonmetallic8, metal/carbon9, and metal oxides10. However, the photocatalysts are still difficult to separate from the liquid for the subsequence process11.
The spinel ferrite MFe2O4 (M = Mn, Co, Zn, Mg, Ni, etc.) is a well-known cubic spinel material where oxygen forms a face-centered cubic close packing, and M2+ and Fe3+ occupy either tetrahedral or octahedral interstitial sites12. Among magnetic nanoparticles, manganese ferrites MnFe2O4 is a group of soft spinel ferrite materials with high magnetic permeability, high chemical stability, high electrical resistance, and special optical. Manganese ferrites are widely used in many areas such as high-density magnetic recording, ferrofluid technology, electronic devices, magnetic resonance imaging (MRI), microwave adsorption, biomedical drug delivery, catalysis and environmental analysis13-15. Besides that, this ferrite has moderate saturation magnetization at 300 K (Ms about 83 emu/g) and low Curie temperature (Tc about 580 K)16. Therefore, various studies on MnFe2O4 nanoparticles properties have been reported in the literature. However, there are few reports on ZnO-MnFe2O4 composite systems.
The aim of this study is synthesizing ZnO-MnFe2O4 nanocomposites with different compositions of ZnO:MnFe2O4 in organic-free media through a two-stage hydrothermal process. The crystallinity, morphology, optical and magnetic of the as-obtained nanocomposites were studied by several techniques. Interestingly, the addition of MnFe2O4 led to decrease the band gap of ZnO and accordingly modified ZnO to be a visible light photocatalysts. Consequently, the introduced MnFe2O4 in all formulations could be used to completely degrade the dye under sunlight irradiation and the sample could be separated from the liquid by external magnetic field and used for the subsequence photocatalytic process.
Materials and Methods
Material
The materials used in this work were Zn(NO3)2.4H2O (Merck), Fe(NO3)3.9H2O (Merck), Mn(NO3)2.4H2O (Merck), NaOH (Merck), distilled water, and Rhodamine B. All the obtained chemicals were of analytical reagent grade and were used as received without any further purification. The batik dye wastewater obtained from the washed batik cloth.
Synthesis of Manganese Ferrite (MnFe2O4) Nanoparticles
Nanoparticles of manganese ferrite (MnFe2O4) synthesized by hydrothermal route in organic-free media as follow; a stoichiometric amount of 10 mmol of Mn(NO3)2.4H2O and 20 mmol of Fe(NO3)3.9H2O as starting materials were dissolved in 40 mL distilled water under stirring at 500 rpm in rapid to obtain a mixed solution. The solution pH was adjusted to 12 with NaOH 2 M was added drop wise. The reaction procedure was carried out in an air atmosphere. The dark mixture obtained was placed into an autoclave and heated at 180°C for 3 h in the oven. After that, the autoclave was cooled to room temperature. The obtained precipitation was collected by filtered and washed with distilled water until pH to 7 and then followed by drying in the oven at 100°C for 2 h to form the MnFe2O4. The resulted nanoparticle was characterized by several instruments.
Synthesis of ZnO-MnFe2O4 Nanocomposites
The ZnO-MnFe2O4 nanocomposites were synthesized by the hydrothermal route in organic-free media using MnFe2O4 that was prepared before. The procedure was adopted from the previous study17 as follow; A total of Zn(NO3)2.4H2O and MnFe2O4 nanoparticles was mixed with 40 mL of distilled water with the mole ratio of Zn+2:MnFe2O4 is 1: 0.01, 1: 0.05 and 1: 0 .1 that was signed as NMn-1, NMn-2, and NMn-3, respectively. To adjust the pH to 12, NaOH 2M solution was added drop wise to the mixture. Then the mixture was transferred into a Teflon-lined stainless steel autoclave and heated at the temperatures of 180°C for 3 h before being left to cool to room temperature naturally. ZnO-MnFe2O4 powder obtained was filtered and washed with distilled water until the pH to 7 and then was dried at 100°C for 2 h. The same procedure was also carried out to prepare ZnO particles as control sample using Zn(NO3)2.4H2O as starting material. Several techniques were used in order to investigate the structure, morphology, optic and magnetic properties.
Photocatalytic Activity
Photocatalytic activity of the obtained samples was evaluated by degradation of Rhodamine B solution under natural sunlight irradiation. In a typical experiment, 20 mg of ZnO-MnFe2O4 nanocomposites as catalysts was added into 20 mL of Rhodamine B solution with an initial concentration of 10 mg/L at room temperature and then the mixture was exposed to natural sunlight irradiation for 0.5 until 3 h (from 11:00 am to 14:00 pm). After a specified time, the solid and liquid were separated and the absorbance of the solution (5 mL) was measured by UV-visible spectrophotometer at a wavelength of 553 nm to obtain the degradation percentage of Rhodamine B. The same procedures were performed for ZnO, MnFe2O4 and recycled of ZnO-MnFe2O4 nanocomposites. The maximum absorbance wavelength of Rhodamine B was obtained by measuring Rhodamine B absorbance at different concentrations. The photocatalytic activity of the as-produced samples was also evaluated on the degradation of batik dye wastewater. The parameters that influence the photocatalytic efficiency of as-prepared samples (initial concentration of dye and amount of catalyst used) were investigated. The degradation percentage of dyes were calculated according to follow equation, degradation (%) = (Aₒ-A)/Aₒ x100%, where Aₒ and A is initial and degraded dye solution concentration18.
Results and Discussion
Structural Analysis
The structure and particle size of resulted samples were analyzed by X-ray diffractometer (XRD Philips X’pert PAN analytical PW3040). Fig.1 shows the XRD patterns of ZnO, MnFe2O4, and NMn with variation ratio of ZnO:MnFe2O4 were synthesized at 180°C for 3 h. The ZnO pattern shows the specific peaks at 2θ = 31.7ᵒ (hkl 100), 34.4° (hkl 002), 36.2° (hkl 101), 47.5° (hkl 105) and 56.5° (hkl 110) corresponding to the hexagonal structure of wurtzite (ICDD No.01-078-2585). For the sample of MnFe2O4, the specific peaks are detected at 2θ = 29.90° (hkl 220), 35.17° (hkl 311), 42.77° (hkl 400), 56.5° (hkl 511) and 62.27° (hkl 440) analog to the spinel cube structure (ICDD No. 00-001-1108).
XRD patterns of the NMn nanocomposites with the variation of MnFe2O4 composition shows that the peaks are dominated by ZnO with wurtzite structure. This indicates that the addition of MnFe2O4 did not change the ZnO structure in the nanocomposite. The peaks of MnFe2O4 phase in composite were present at 2θ = 29°, 35°, 43°, 56° and 62°.The peaks intensity of composites increases with increasing the MnFe2O4 contain in composites. For all NMn XRD patterns, there are no other peaks observed indicating no impurities in the samples. ZnO crystal size within nanocomposite could be calculated from the highest peaks using Debye-Scherer formula 19, 20. The average crystallite size of the nanocomposite is 30.9, 34.7, and 34.2 nm for NMn-1, NMn-2, and NMn-3, respectively.
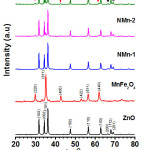 |
Figure 1: XRD pattern of ZnO, MnFe2O4, NMn-1, NMn-2 and NMn-3 Click here to View figure |
Morphology and Element Composition Analysis
The morphology of the samples was recorded by scanning electron microscopy (SEM JEOL JSM-6360LA). The surface morphology of (a) MnFe2O4, (b) NMn-1, (c) NMn-3 initial and (d) NMn-3 after used were shown in Fig 2. The morphology of MnFe2O4 (Fig. 2a) is a homogeneous and grain with average particle diameter of 25 nm dispersed uniformly. The morphology of NMn-1 (Fig. 2b) is non-homogeneous and there is agglomeration observed, meanwhile the NMn-3 morphology (Fig 2c) is in the form of a homogeneous rectangular plate with average particle length of 250 nm and width of 150 nm. Figure 2d show the surface morphology of NMn-3 that has been used as a catalyst (recycled) in which the form is almost identical to the initial NMn-3. This phenomenon indicates that no significant changes to the composite sample after being used as a catalyst. The detailed morphology of the NMn-3 as seen in Fig. 2e was measured by TEM. The SAED pattern (Fig.2f) show lattice fringes, which agrees well with the lattice spacing planes of hexagonal wurtzite ZnO and spinel cubic MnFe2O4.
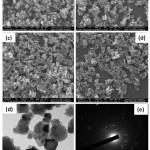 |
Figure 2: SEM image of MnFe2O4 (a), NMn-1 (b), NMn-3 initial (c), NMn-3 after used in photocatalytic process (d), and TEM image of NMn-3 and SAED pattern of NMn-3 (e) Click here to View figure |
The composition of the elements in the ferrite and composite obtained from EDX as shown in Fig. 3. The EDX spectrum for MnFe2O4 (Fig.3a) shows the presence of Mn, Fe, Zn, and O elements only. The extra gold peak obtained in EDX is due to the thin coating done on the sample to make the sample conducting, which is required to record the SEM. The percentages of Mn, Fe, and O elements in MnFe2O4 particles are 26.26, 55.00 and 18.74%, respectively; while the percentage of Zn, Mn, Fe and O in NMn-3 ( Fig. 3b) are 73.95, 2.69, 9.17, and 12.14%, respectively. It reveals that the as-prepared samples are pure and there are no other impurities present.
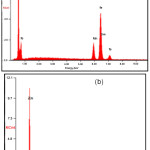 |
Figure 3: EDX Spectra of MnFe2O4 (a) and NMn-3 (b) |
Magnetic and Optical Properties Analysis
Magnetic properties of the MnFe2O4 nanoparticles, NMn-1, NMn-2, and NMn-3 were measured by vibrating sample magnetometer (VSM OXFORD 1.2 H) at room temperature and the results are shown in Figure 4. The magnetic saturation (Ms) value of MnFe2O4 nanoparticles is 81.3 emu/g (Fig. 4a). Similar Ms value of MnFe2O4 have been reported by Sharifi et al., where the sample synthesized by coprecipitation method 21. Meanwhile, the Ms value of NMn-1, NMn-2, and NMn-3 is 6.08, 11.83, and 16.03 emu/g, respectively (Fig. 4b). Based on Ms value of all nanocomposites, it can be concluded that increasing the composition of MnFe2O4 in nanocomposites tends to increase the magnetic properties. The coercivity (Hc) of ferrite and composite samples is almost zero and the particles are superparamagnetic. The lower Ms of nanocomposites is caused by the diamagnetic properties of ZnO which reduce the magnetic nature of the MnFe2O4 nanoparticles 22. The nanocomposites containing magnetic behavior have profit due to separate easily from the liquid by the application of external magnetic field after applied and can be used for the next application.
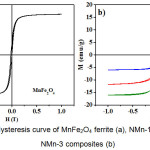 |
Figure 4: Hysteresis curve of MnFe2O4 ferrite (a), NMn-1, NMn-2 and NMn-3 composites (b) Click here to View figure |
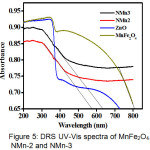 |
Figure 5: DRS UV-Vis spectra of MnFe2O4, NMn-2 and NMn-3 |
In order to investigate the optical properties, resulted samples were analyzed by DRS UV-vis (Shimadzu UV-Vis 2450 spectrophotometer). Fig. 5 shows the UV-Vis diffuse reflection spectra of MnFe2O4 and nanocomposites. The spectra of MnFe2O4 exhibit high adsorption intensity in the wide visible light region from 400 to 809 nm and the absorption edge for pure ZnO is below 400 nm. The adsorption region for NMn-2 and NMn-3 at the wave length of 578 and 635 with the band gap of 2.14 and 1.95 eV, respectively. The band gap energy was calculated using Eg=1240/λ equation23. It can be concluded that increasing the ferrite amount in the composites will increase the adsorption of the composites from UV to visible region light.
Photocatalytic Activity Evaluation
To demonstrate their potential environmental application in the removal of contaminants from wastewater, the photocatalytic activities of the as-synthesized model of contaminant. From Fig. 6, it is clear that the ZnO-MnFe2O4 samples exhibited different photocatalytic activities. The removal of Rhodamine B from solution (10 mg/L) under natural sunlight irradiation after 3 h by NMn-1, NMn-2, NMn-3 composite was reached 91.4, 94.5, and 96.7%, respectively. Meanwhile, for ZnO and MnFe2O4 samples, and without catalyst only reached 73, 35.2, and 28.7%, respectively. This indicates that the presence of MnFe2O4 in ZnO can shift the absorption area and increase the activity of this material in the visible light of the sun. The best photocatalytic activity was obtained if using the NMn-3 sample as a catalyst.
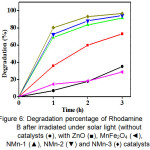 |
Figure 6: Degradation percentage of Rhodamine B after irradiated under solar light (without catalysts (●), with ZnO (■), MnFe2O4 (◄), NMn-1 (▲), NMn-2 (▼) and NMn-3 (♦) catalysts) |
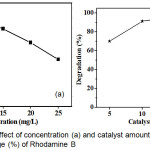 |
Figure 7: The effect of concentration (a) and catalyst amount (b) on degradation percentage (%) of Rhodamine B Click here to View figure |
Figure 7a revealed the optimum concentration of Rhodamine B that could be degraded by NMn-3 composite under natural sunlight. This research was carried out by 20 mg of catalyst, irradiation time 3 hours and the concentration of Rhodamine B was within the range 5-25 mg/L. The optimum absorption was reached at the concentration of Rhodamine B 10 mg/L. At higher concentration, the percentage of degradation decrease due to the higher number of Rhodamine B molecule in solution. This molecule prevented the natural sunlight achieving the catalyst so that the e–-h+ pair forming was blocked. As known, the formation of e–-h+ pair plays important role in catalytic process due to their role as a precursor of OH∙ formation. This hydroxyl radical that be responsible in dyes degradation process23.
As already well known that if working with heterogeneous catalysts, the amount catalyst loading in photocatalytic process is important from an economical view. In this present work, the optimum of NMn-3 catalyst applied was 15 mg with Rhodamine B concentration of 20 mg/L as seen in Fig. 7b. After 3 h irradiation, Rhodamine B degradation percentage by catalyst loading of 0.015 mg give almost the same value with 0.02 g, which is 96.0 and 96.7%, respectively. Therefore for the further photocatalytic process, the amount of catalyst used is 0.015 mg so it is more efficient.
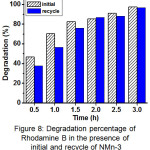 |
Figure 8: Degradation percentage of Rhodamine B in the presence of initial and recycle of NMn-3 Click here to View figure |
The reusability of composites were determined by tested the activity of recycled composite for the subsequent catalytic process. Figure 8 showed the degradation percentage of Rhodamine B in the presence initial and recycle of NMn-3. It shows that the stability of NMn-3 composite slightly decreased after used in a catalytic process. This phenomenon was caused by the small part agglomeration that can be observed from SEM image which has an impact on the decrease of its activity. However, the recycled NMn-3 performance still higher and closer to the initial NMn-3 after 3 h.
Furthermore, the evaluation of catalytic activity was also carried out on textile dye wastewater from batik cloth by the same procedure. The degraded batik dye wastewater solution was measured at a wavelength of 542 nm with a spectrophotometer. The results showed that all nanocomposites showed the highest activity as like as in the Rhodamine B dye solution (Fig.9). The degradation percentage of batik dye wastewater after 3 h in the presence of NMn-1, NMn-2 and NMn-3 is 96.1, 93.4, and 95.1 %, respectively. On the other hand, the degradation percentage of batik dye wastewater in the absence of catalyst only reached 16.5 % and in the presence of MnFe2O4 nanoparticles only reach 25.5 %. The high degradation percentage of batik dye wastewater estimated due to similarity of compounds contained in the wastewater with the dye Rhodamine B. This fact is supported by the maximum adsorption wavelength of batik dye wastewater which is close to Rhodamine B.
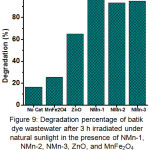 |
Figure 9: Degradation percentage of batik dye wastewater after 3 h irradiated under natural sunlight in the presence of NMn-1, NMn-2, NMn-3, ZnO, and MnFe2O4 catalysts and without catalyst Click here to View figure |
The kinetic analysis of the batik dye wastewater degradation process using NMn-1, NMn-2, and NMn-3 composites as catalysts is also studied (Fig. 10). The linear plots of corresponding irradiation times (t) versus ln Co/C can be argued that the reaction mechanism of dye degradation follows the first-order pattern in accordance with that proposed by Langmuir-Hinshelwood8. The average squared correlation coefficient (R2) is 0. 9718. The high photocatalytic activity and good stability, this material is recommended to degrade the dye in the wastewater so that the environmental problems caused by the dye wastewater can be reduced.
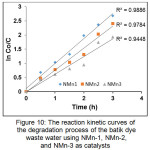 |
Figure 10: The reaction kinetic curves of the degradation process of the batik dye waste water using NMn-1, NMn-2, and NMn-3 as catalysts Click here to View figure |
Conclusion
ZnO-MnFe2O4 nanocomposite photocatalysts with different composition of MnFe2O4 have been synthesized by hydrothermal route in organic-free media. From XRD analysis results, ZnO phase in nanocomposite shows wurtzite hexagonal phase while MnFe2O4 shows cubic spinel phase. Magnetic properties measured by VSM show that nanocomposites have superparamagnetic behavior. Resulted nanocomposite were applied to the degradation Rhodamine B dye and batik dye wastewater under natural sunlight irradiation, and the results show that the photocatalytic activity of ZnO-MnFe2O4 with the composition of 1:0.1 is 96.7 % for Rhodamine B and 95.1 % for batik dye wastewater after 3 h. The high photocatalytic activity and good stability suggest that the as-synthesized ZnO-MnFe2O4 may be promising photocatalysts in removing dye pollutants from wastewater. The photocatalysts can be separated easily from the liquid by the application of external magnetic field after applied and can be used for the next application.
Acknowledgments
The author would like to thank the Ministry of Research, Technology and Higher Education of Indonesia and LPPM of Andalas University for supporting this work through the PDD grant with contract number: 09/UN.16.17/PP.DD /LPPM/2017.
References
- Shifu, C.; Wei, Z.; Wei, L.; Sujuan, Z. J. Sol-Gel Sci. Thecnol. 2009, 50, 387-396.
CrossRef - Zhu, H. Y.; Jiang, R.; Fu, Y. Q.; Li, R. R.; Yao, J. Applied surface science. 2016, 369, 1-10
CrossRef - Su, N. R.; Lv, P.; Li, M.; Zhang, X.; Li, M.; Niu, J. Materials Letters. 2014, 122, 201–204
CrossRef - Zhang, G.; Xu, W.; Li, Z., Hu, W., Wang, Y. Journal of Magnetism and Magnetic Materials. 2009, 321, 1424-1427
CrossRef - Zheng, J., Xinzhao, S.; Xuejia; Wei, C.; Yan, L.; Jing, G. Materials Letters. 2012, 73, 143-146
CrossRef - Dhiman, P.; Chand, J.; Kumar, A.; Kotnala, R. K.; Bato, K. M.; Singh, M. Journal of Alloys and Compounds. 2013, 578, 235–241
CrossRef - Yu, H.; Ming, H.; Gong, J.; Li, H.; Huang, H.; Pan, K.; Liu, Y; Kang, Z.; Wei, J.; Wang, D. Bull. Mater. Sci. 2013, Vol. 36, 3, 367–372
CrossRef - Wu, C., Applied Surface Science, 2014, 319, 237-243
CrossRef - Sunitha, S.; Rao, A. N.; Karthikeyan, J. Orient. J. Chem. 2015, 31(1) 107-112
CrossRef - Xu, C.; Cao, L.; Su, G.; Liu, W.; Liu, H.; Yu, Y.; Qu, X. Journal of Hazardous Materials. 2010, 176, 807-813
CrossRef - Sun, L.; Shao, R.; Tang, L., Chen, Z. Journal of Alloys and Compounds. 2013, 564, 55-62
CrossRef - Zhang, L. F.; Wu, Y. Journal of Nanomaterials. 2013, 1-6
- Wang, Y. Q.; Cheng, R. M.; Wen, Z.; Zhao, L. J. Eur. J. Inorg. Chem. 2011, 2942–2947
CrossRef - Lv, S. S.; Chen, X. G.; Ye, Y.; Yin, S. H.; Cheng, J. P.; Xia, M. S. J. Hazard. Mater. 2009, 171, 634–639
CrossRef - Zhao, D. L.; Lv, Q.; Shen, Z. M. J. Alloys Compd. 2009, 480, 634 – 638
CrossRef - Aslibeiki, B.; Kasmeri, P. J. Supercond. Nov. Magn. 2015, 28, 3343-3350
CrossRef - Rahmayeni; Ramadani, A.; Stiadi, Y.; Jamarun, N.; Emriadi; Arief, S. Journal of Materials and Environmental Sciences. 2017, 8, 5, 1634-1643
- Rahmayeni; Zulhadjri; Jamarun, N.; Arief, S.; Emriadi. Orient. J. Chem. 2016, 32, (3), 1411–1419
CrossRef - Shao, R.; Sun, L.; Tan, L.; Chen, Z. Chemical Engineering Journal. 2013, 217, 185-191
CrossRef - Sivagurunathan, P.; Gibin, S. R. J. Mater. Sci: Mater Electron. 2016, 27, 8891– 8898
CrossRef - Sharifi, I.; Shokrollahi, H.; Amiri, S. Journal of Magnetism and Magnetic Materials. 2012, 324, 903–915
CrossRef - Castro, T. J.; Silva, S.W.; Nakagomi, F.; Moura, N. S.; Franco, A. J., Morais, P. C. Journal of Magnetism and Magnetic Materials, 2015, 389, 27–33
CrossRef - Lamba, R.; Umar, A.; Mehta, S. K.; Kansal, S. K. J. Alloys Compd. 2015, 620, 67–73
CrossRef

This work is licensed under a Creative Commons Attribution 4.0 International License.


