Column Adsorption Technique for the Removal of Pb+2 Ions by using: Sugarcane Leaves (SL)
Ghanshyam Jareda and Shyama Prasad Mahapatra
DOI : http://dx.doi.org/10.13005/ojc/330670
In this paper, Sugarcane leaves (SL) used for removal of Pb+2 as a recent adsorbent. The untreated and treated leave of sugarcane analyzed by instruments like; FT-IR, SEM and EDX investigation. The using different standard solutions and water samples containing Pb+2 ions in uneven preliminary conc., bed-height, pH and flow rate at room temperature. It is also found that the break point period decreases with rise in inlet adsorbate conc. as the binding positions become additional saturated in the column. The adsorption curve also indicates that the adsorption capacity rises with rise in bed-height. Experimental data indicate that SL has great affinity to Pb+2 ion removal. The Yoon-Nelson (YN) method also gives the confirmation and good evidence of Pb+2 ions onto the SL bio-adsorption. We proposed that the major adsorption mechanism of Pb+2 ions through a specific ion-exchange mechanism, and morphological surface precipitation.
KEYWORDS:Adsorption Isotherm; Column Technique; Instrumental Analysis; Pb+2 Removal; Sugarcane Leaves
Download this article as:| Copy the following to cite this article: Jareda G, Mahapatra S. P. Column Adsorption Technique for the Removal of Pb+2 Ions by using: Sugarcane Leaves (SL). Orient J Chem 2017;33(6). |
| Copy the following to cite this URL: Jareda G, Mahapatra S. P. Column Adsorption Technique for the Removal of Pb+2 Ions by using: Sugarcane Leaves (SL). Orient J Chem 2017;33(6). Available from: http://www.orientjchem.org/?p=40990 |
Introduction
Water pollution due to toxic heavy metallic elements such as Cr, Cd, Hg, Fe, Pb, etc. has been a major fear for chemists and eco-friendly activitist.1 The level of heavy metals like Hg, Cr, Cd, Pb, Zn, discharge from industries, factories or domestic waste is becoming progressively increasing. The disposed huge amount of toxic heavy metals in the environment, especially in water bodies, which directly or indirectly contact ground water. The different solid waste, metals are not degradable, and they are gathered in living organs, tissues. Hence the water contaminated by heavy metals carriages many human diseases. Therefore, they must be removed before discharged to environment.The bio adsorption 2 a low budget technique and effective method for removal of heavy metals.3-4 The most of bio adsorption5-6 studies have been concentrated on the plant waste like wastage plant part, leaves, peanut null pellets, rice husk ash,7 lemon and banana peel etc. The Bio adsorption has some benefits over the previous methods viz. restoration ability, re-cycle of material, effective at trace amount, and little cost. The leaves biomasses have been applied to its possible as bio adsorbent for metal removal from wastewater. According to USEPA (2012)8 the acceptable level of lead is 0.05 mg/l. for drinking water. The present study aims at assessing the adsorption potential of sugarcane10 leaves (SL) for the removal of Pb+2 ion9 from water. The Saccharum Offcinarum leave used as adsorbent which is the fibrous, it pretreated dry leaves contain around 50-52% cellulose, hemicellulose 10-12%, lignin 28-30%, ash 3-4% and yield 0.5% etc. Metal ions binding to lingo-cellulosic group and other functional groups,11 such as carbonyl, carboxylic acid, aromatic hydrocarbon group. The bio adsorbents modifying with substance treatments like hydroxide ions(OH−) solution, acid solution (H2SO4), and oxidizing agent (H2O2) etc. for the purpose of removing efficiency of heavy metal adsorption.12 The objective of this study as below-
To Know the morphology, surface adsorption mechanism and characterization of the adsorbent.
To find the optimized factor for maximum adsorbent.
To evaluate the potential of removal of Pb+2 ion in aqueous phase.
To analyze with the known adsorption model.
Experimental
Materials and Method
The all solutions for experimental purpose, prepared by the using GR reagents only. The 1000 mg/l. solution of lead is ready by dissolved a weighted quantity of lead nitrate (HNO3) in to DM water. The pH of solution is adjusted to the essential value by addition of 0.1M sodium hydroxide and 0.1M of nitric acid.
For the study of sugarcane leaves (SL) as a bio adsorbent were obtained from cropping land, Dist.-Hoshangabad, MP, (India). Double distilled water used for standard solution and groundwater with high lead concentrations was sampled from the peripheral of Bailadila Iron ore mines area. All the analysis was performed at the Dept. of Chemistry, NIT, Raipur, India. The water used to prepare the solutions was Milli-Q grade (Millipore C). The concentration of lead was measured by using Nova 60 Spectroquant® Photometer and Teledyne Leeman Profile Inductively Coupled Plasma Optical Emission Spectrometry (ICP-OES). The Systronics high quality precision digital pH meter using for measurement of pH.
Adsorbent
The sugarcane leaves (SL) used in this work as an adsorbent. SL was first washed 3 times thoroughly by DM water to eliminate the dirt components. After that it was soaked for 12 hr. in 0.1 N NaOH solutions and again washed well with double distilled water (DDW). Then it was socked in 0.1 N CH3COOH for a period of 3-4 hr. to remove the traces of NaOH.13 Using DDW again washed thoroughly till the washed water become colorless and the filtered. Then SL was dried for 5-6 hr. at 110°C, cooled, powdered and filtered. The average SL powder size was 100-150(µm).14 this biomass used for practical experiments and main aim examine the Pb+2 ions adsorption capacity.
Adsorbent Characterization
The characterization of SL is given in Table 1 and 2 respectively.
Table 1: Physio-chemical characterization & proximate analysis of SL
| SL area (m2/g) | 201.85 | Characteristic | Value4.95 |
| Pore volume (cm2/g) | 0.106 | Moisture (%) | |
| Average pore diameter (µm) | 200-250 | Volatile (%) 7.62Ash (%) 34.88 | |
| Heating value (KJ/g) 6994.8Bulk density (kg/m3) 96.48 | Fixed Carbon (%) 52.06 | ||
Table 2: Ultimate analysis of SL
| Element (%) | C | H | N | S |
| Values | 62.15 | 0.084 | 2.952 | 0.105 |
Fix Bed Experimental Setup
A glass cylinder of 2.0 cm (diameter), 12.0 cm (height) used to make a bed-column, which was fixed by SL an adsorbent. The coating of glass wool was placed over the sieve to stop the loss of bio adsorbent. The standard solution and water samples are allowed to pass through the fixed-bed column, and then the treated water was collected in a beaker. The study was conducted at a temperature of 27 Co +/- 3 Co at the pH of the lead solution as 5.5 +/- 0.4 for the present study. The optimized parameters such as flow rate, initial conc., pH, & used fix-bed height were examined, and then optimized parameter was applied on waste water for Pb+2 removal.15 The samples were collected at certain times interval (15 Min.), and analyzed for Pb+2 removal. The using ICP-OES equipped with atomizer and an auto sampler.
Yoon-Nelson(YN) Model
The YN (1984) model16 is basis of the hypothesis. According to this model the rate decrease of adsorption for each adsorbate molecule is proportional to the possibility of adsorbate adsorption, and the possibility of an adsorbate breakthrough (BT) on the adsorbent. The linearlised YN model for a single component system is stated below equation.
ln(Co/Ci)=kyt-tky
Where ky=velocity rate constant [ml/min], Ci =inlet concentration, t= time taken for 50% of adsorbate BT. The plot of ln(Co/Ci-Co) vs. t (time) gives a straight line, and the appear a downgrade of kY and interrupt of t. The basis of this model, the amount of Pb+2 ionsadsorbed in a fix bed column, is half of total incoming the adsorption bed within fixed t.
QYN =Q(T)/W
Results and Discussion
Ft-Ir Analysis
FT-IR-analysis, spectra appear solid on the surface of SL in the range of 4000-500cm-1. The spectra of FT-IR [Fig. 1(a)] give information about the nature of functional group17 present in the SL. The band or shift appears at 3417 cm.-1 it is indicates the presence of –OH group. Other group bonds appear in 1734, 1632, 1055.3 and 555-472 cm-1 which shows the C=C is stretching of ether and N-H deformation of amide respectively. But in Fig. 1(b) peak and bands have differed with respect to the untreated FT-IR image of SL. It is might be due to adsorption of Pb+2 ion onto the surface of SL. Thus, for treating SL with Pb+2 ions, gives peak at 3435 cm-1, 2924.2 cm-1, 1560-1415 cm-1, 1049 cm-1 and 941 cm-1 respectively.
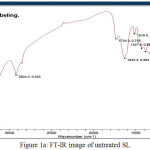 |
Figure 1a: FT-IR image of untreated SL. Click here to View figure |
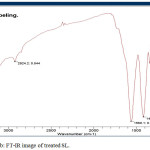 |
Figure 1b: FT-IR image of treated SL. |
SEM Analysis
To obtain more information on the microstructure of sugarcane leave (SL), SEM image was also obtained. Fig. 2(a) and 2(b) are the images of untreated SL and treated SL respectively. The untreated SL has a reasonable homogeneity i.e. aggregate shape have been appeared. The micro porous structure of heterogeneous rough surface with different level of porous surface seams. This can promote capturing of the ions. However, in 2(b) image no pours seem clears, outline and bulk of particles are irregular, its covered due to adsorption of Pb+2 ions. Thus the granular shape was not observed clearly.
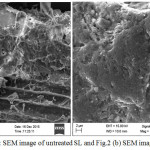 |
Figure 2a: SEM image of untreated SL and Fig.2 (b) SEM image of treated SL. Click here to View figure |
EDX Analysis
The conformity analysis done by the image obtained from EDX (Energy Dispersive X-ray system (INCA 250 EDS with X-MAX 20mm Detector). The two images of EDX of untreated SL and lead treated SL, shown in the Fig. 3(a) and 3(b). The composition (by weight %) of plain untreated SL contains Carbon= 88.25%, Magnesium = 0.34%, Silicon= 9.43%, Potassium= 1.09% and Calcium= 0.89%, whereas, of treated SL contain Carbon= 67.93%, Silicon= 18.01% including in that it contain Pb+2 =14.06% with other elements. The EDX images give correct evidence about the Pb+2 ions present in the SL. From the above instrumental analysis, we can easily conclude that SL is an effective and potential adsorbent for Pb+2 ions. From the images it can be also seen that in case of treated SL the free microstructure is seized and filled with Pb+2 metal ionscompared to untreated SL.
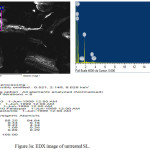 |
Figure 3a: EDX image of untreated SL. |
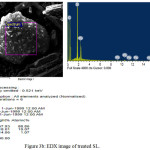 |
Figure 3b: EDX image of treated SL. |
Factors Affecting Adsorption
Initial Concentration
The initial conc. was studied by adding a fixed amount of adsorbent (7.5 gm) onto different lead ion conc. solution such as 1.0 mg/l, 2.0 mg/l, and 3.0 mg/l respectively at pH 4.2. In the Fig. 4(a) sharper BT curves were obtained with 2.0 mg/l conc. The Pb+2 ion removal efficiency decreases with increase initial conc. It is because of the strength of the adsorbent materials decrease with the increase in the initial conc.18 This is possibly due to the available adsorption site are limited, which becomes saturated at higher conc. The identical tendency has been described for the other bio adsorbent such as Neem charcoal and Sugarcane charcol.19
Flow Rate
Influence in the removal process of Pb+2 ions from the water at different condition, i.e. flow rate 1.5 and 2.5 mg/minute, initial conc. 2.0 mg/l and bed height 9.0 cm. illustrated in Fig.4(b). From the figure perfect illustrated that fast flow (from 1.5 to 2.5 mg/l) of Pb+2 ions noticed that the adsorption capacity decreases (Shivakumar and Palanisway 2009). After the reduce the flow rate (from 2.5 to 1.5 mg/l) observed that ion-exchange reached more comfortable position,20 means the slow reached the equilibrium BT.
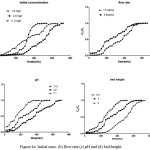 |
Figure 4a: Initial conc. (b) flow rate (c) pH and (d) bed height. Click here to View figure |
Hence, it is happen due to the adsorption in a column having more contact time. As the flow rate change from lower to the higher side, then the rapid equilibrium found. Here it is clear that the contact time between adsorbate and adsorbent is important for removal of Pb+2 ions.
pH
The removal of heavy metal ions is dependent on the aqueous condition, the pH an imported factor in influencing the adsorption capacity of the adsorbent. Effect of pH in the aqueous condition on Pb+2 ion removal through column method studied from the pH range of 11.5, 4.2, and 7.1 is respectively shows in Fig. 4(c). The maximum adsorption of Pb+2 ion uptake capacity observed at pH of 4.2. The effect of pH on Pb+2 ion removed is observed similar to various bio-adsorbent rice husk (Mondal at el., 2012).
Bed-height
The removal of heavy metal Pb+2 ions by column adsorption, the column bed-height is an important factor. The amount of 4.2 gm., 6.4 gm., and 7.2 gm. of SL used to make the bed height 5.5, 7 and 9 cm respectively. The standard solution of 2.0 mg/l of lead was passed through the three different bed-heights. From Fig. 4(d) it is clear that with increase of bed- height adsorption capacity increase, due to it is probably the maximum availability of surface positions, and according increasing the bed-height in the column.
Kinetic Study
Yoon-Nelson(YN) Model
In the Fig. 5(a), (b), (c) and (d) the YN model plot at various conditions for adsorptions of Pb+2 ions onto SL. The value of KY and the τ, were estimated from the slop, intercepts of the linear graph between in [Ci/Co-1] vs. t (time) at different influence of pH, flow rate, initial conc. and bed-height. From the Table 4 result shows that, ky increased with increased inlet conc. and decrease with increase bed-height. The τ BT time increase with increase of bed-heights and the r 2 higher values shows the t(time) is also higher side. This is due to the uptakes rates are growing.21 The BT time need for 50% adsorption decrease, through increase flow rate and initial conc. The high and closed values of correlation coefficient(r2) indicated that, YN model fit for experimental values. The value of r2 is correlated each other’s and the same tendency observed by T sai et al 1999.22
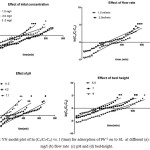 |
Figure 5: YN model plot of ln (Co/Ci-Co) vs. t (time) for adsorption of Pb+2 on to SL at different (a) inlet conc. mg/l (b) flow rate (c) pH and (d) bed-height. |
Table 4: Various factors of the YN model for the adsorption of Pb+2 ions onto SL at 298K.
| Experimental conditions | Yoon-Nelson Parameters | ||||||
| Ci (mg/l) | Z (cm) | W(gm) | pH | V(ml/min) | KYN x 10-2(ml/min) | τ (min) | r2 |
| 2.0 | 9 | 8.5 | 1.5 | 1.5 | 1.5 | 214.7 | 0.906 |
| 2.0 | 9 | 8.5 | 4.2 | 1.5 | 1.2 | 369.4 | 0.938 |
| 2.0 | 9 | 8.5 | 7.01 | 1.5 | 2.0 | 150.3 | 0.937 |
| 2.0 | 9 | 8.5 | 4.2 | 1.5 | 1.6 | 334.6 | 0.948 |
| 2.0 | 9 | 8.5 | 4.2 | 2.5 | 1.4 | 261.4 | 0.947 |
| 1.0 | 9 | 8.5 | 4.2 | 1.5 | 2.3 | 289.1 | 0.942 |
| 2.0 | 9 | 8.5 | 4.2 | 1.5 | 1.3 | 403.4 | 0.983 |
| 3.0 | 9 | 8.5 | 4.2 | 1.5 | 1.1 | 322.3 | 0.903 |
| 2.0 | 5.5 | 4.5 | 4.2 | 1.5 | 1.8 | 233.8 | 0.940 |
| 2.0 | 7 | 6.0 | 4.2 | 1.5 | 1.4 | 333.5 | 0.958 |
| 2.0 | 9 | 8.5 | 4.2 | 1.5 | 1.3 | 493.0 | 0.972 |
(Ci= inlet conc., Z= bed-height, W=mass of adsorbent, V=initial volume, ky= velocity constant, τ = time need for 50% of adsorbate BT)
Column Regeneration
In general column method is popular for removal of cations and anions because of regeneration ability. Thus the success rate of the adsorbent is based on regeneration ability. The continuous usage of an adsorbent material is a crucial factor in determining its application potential. Regeneration of the adsorbent was often carried out by using eluting agent. The eluting agent used must not cause damage on the capacity of the adsorbent to ensure that the adsorbent can be reused several times. In addition, it is also needed to ensure that the eluted solution for the regeneration process does not pose any disposal problem. In the present study, regeneration capacity of SL adsorbent was also investigated by using 0.1N HNO3 acidic medium solution. SL adsorption ability was tested with regenerated column for 5 cycles after the initial application for removal of Pb+2. The column cleaning efficiency is increased by increasing mobile phase temperature to 36-60°C.
Field Trial
The performance of the Fixed-bed column was evaluated with actual groundwater samples containing various other ionic species in addition to Pb+2. The BT data are presented in Table 5. It is observed that up-scaled and down-scaled both columns were able to perform effectively with actual groundwater and yield appears to be reasonable and comparable in the optimized manner. In addition to monitoring about removal efficiency for Pb+2 BT graphs, the performance of fixed-bed column were also monitored for other physio-chemical parameters of groundwater samples given in Table 5. The columns were able to remove or reduce turbidity, sulfate, and alkalinity along with Pb+2 ions from groundwater samples.
Table 5: Performance of fixed-bed column in terms of other water quality parameters with actual groundwater samples.
| Water quality parameters | Ground water samplesValue before treatment | Value after SL Treatment |
| Pb+2 (mg/l) | 2.5 | 0.05 |
| Turbidity (NTU) | 15 | 0.9 |
| SO4-2(mg/l) | 145 | 106 |
| No3(mg/l) | 6.5 | 6.3 |
| Hardness (mg/l as CaCO3) | 266 | 262 |
| F– (mg/l)Mg(mg/l) | 0.730 | 0.526 |
| Na+ (mg/l) | 18.6 | 16.2 |
| K+ (mg/l) | 1.7 | 1.6 |
| Alkalinity (mg/l as CaCO3) | 288 | 240 |
Comparative Study
There are several types of adsorbent such as natural, bio-adsorbent or resin used for lead removal from aqueous condition.23 The adsorption capacities of various adsorbent are compared with SL given in Table 6, provide the information about the extent of effectiveness of SL with compared to reported adsorbent. From investigation in this paper SL finds superior to many other adsorbents reported in the relevant literatures (Mondal 2009).
Table 6: SL bio-adsorbent for the removal of Pb+2 from water as compared with other reported bio-adsorbent.24-26
| Adsorbent | Adsorbent capacity (mg/l) | Reference |
| Sugarcane bagasse | 6.3 | Martín-Lara et al. (2010) |
| Sugar cane bagasse | 7.2 | Martín-Lara et al. (2010) |
| (Treated by H2SO4) | ||
| Olive stone | 6.59 | Ronda et al. (2013) |
| Casava peel | 5.8 | Owamah. (2014) |
| Agave sisalana (sisal fiber) | 1.34 | Dos Santos et al. (2011) |
| Sugarcane leaves | 14.06 | Present study |
It also explains about the extent of the potential for the Pb+2 removal from the water, under continuous operation. Apart from that, it can be regenerated by using 0.2 M of NaOH after the saturation of the fixed-bed column. Therefore, SL appears an active adsorbent for Pb+2 removal in aqueous-phase condition. From Table 6, it is clear that SL is very effective for the removal of Pb+2 from the water as compared with other reported bio-adsorbent.
Conclusion
The experimental data of present investigation reveal the effectiveness of SL for removal of Pb+2 ions in aqueous condition through fixed-bed column technique. From the FT-IR analysis results, the finding from shifts in their position, band intensity untreated SL is 1055.3, 1734.3, 3417 and treated is 1049.2, 1620.1, 3549.2 cm-1 respectively. SEM image was also shows that the untreated SL has a reasonable consistency, but in treated SL, gritty shape has not observed clearly due to metal element adsorption. The images of EDX of untreated SL contain Carbon= 52.67%, Oxygen = 42.71%, Silicon= 3.10%, Potassium= 0.80% and Calcium= 0.73%, whereas, of treated SL contain Carbon= 50.18 %, Oxygen= 30.43 %, Silicon= 0.94 % including it contain Pb+2 =14.06% with other elements. The EDX instrumental analysis images give correct evidence the presence of Pb+2 ion in the SL surface. It is concluded that SL marvelously capable of uptakes of Pb+2 in aqueous condition in pH of 4.2, flow rate of a column should be 1.5 m1/min., the adsorbate initial conc. 1.0 mg/l, then column length 9.0 cm at room temperature.
Field trial performance of fixed-bed column was also monitored for Pb+2 ions removal and other physio-chemical parameters of groundwater samples. The columns were competent to remove Pb+2,turbidity, sulfate, and alkalinity from groundwater samples without changing other parameters. The SL as a solid phase natural adsorbent has many advantages over the other bio adsorbent. It is inexpensive, low cost along with adsorbing percentage 90-96%. From the optimization it was found the Pb+2 removal capacity of SL influence by the pH of the medium, flow rate, bed height, and initial conc. The YN model also justified the effectiveness of SL towards Pb+2 ion removals, the correlation coefficient (r2) indicated that YN model fit for experimental values.
Reference
- Moganavally, P.; Deepa, M.; Sudha, P.N.; Suresh, R. Orient. J. Chem. 2016, 32(1), 441-453.
CrossRef - Kumar, P.S. Env. Prog. Sus. En. 2013, 33(1), 55-64.
CrossRef - Chaouchi, N.; Ouahrani, M.R.; Laouini, S.E. Orient. J. Chem. 2014, 30(3), 1317-1322.
CrossRef - Cochrane, E.L.; Lu, S.; Gibba, S.W.; Villaescusa, I. J. haz. Mat. 2006, B137, 198-206.
CrossRef - Ngah, W.S.W.; Hanafiah, M.A.K.M. Bio. Tech. 2008, 99, 3935–3948.
CrossRef - Rajoriya, S.; Kaur, B. Int. J. Eng. Sci. Inven. 2014, 3(6), 60-80.
- Nnaji, C.C.; Chinwe, Ebeagwu, J.; Ugwu, E.I. BioRes. 2017, 12(1), 799-818.
- Drinking Water Standards and Health Advisories. USEPA or United State Environmental Protection Agency. 2012.
- Azouaou, N.; Sadaoui, Z.; Mokaddem, H. Chem. Eng. Trans. 2014, 38,151-156.
- Manarim, G.R.1.; De Aguiar, C.L. Ann. Chrom. Sep. Tech. 2016, 2(1), 1015.
- Choudhary, Z.Z.; Zain, S.M.; Rashid, A.K. E-J.Chem. 2011, 8(1), 333-339.
- Huang, K.; Zhu, H. Env. Sci. Poll. Res. 2013, 20, 4424–4434.
CrossRef - Ezzat, M.S.; Salwa, A.A.; Aliaa, A.F. Arab. J. Chem. 2011, 4, 63-70.
CrossRef - Long,Y.; Lei, D.; Ni, J.; Ren, Z.; Chen, C.; Xu, H. Bio. Tech. 2014, 152, 457–463.
CrossRef - Mondal, M.K. J. Env. Manag. 2009, 90, 3266-3271.
CrossRef - Yoon, Y.H.; Nelson, J.H. Am. Hyg. Ass. J. 1984, 45(8), 509-516.
CrossRef - Bilba, K.; Ouensanga, A. J. Ana. App. Pyro. 1996, 38(1), 61–73.
CrossRef - Bulgariu, D.; Bulgariu, L. Bio. Tech. 2013, 129, 374–380.
CrossRef - Villarante, N.R.; Bautista, A. P.R.; Sumalapao, D.E.P. Orient. J. Chem. 2017, 33 (3), 1111-1119.
CrossRef - Sathishkumar, M.; Binupriya, A. R.; Kavitha, D.; Yun, S. E. Bio. Tech. 2007, 98(4), 866–873.
CrossRef - Sivakumar, P.; Palanisamy, P. N. Ind. J. Chem. Tech. 2009, 16, 301-307.
- Tsai, W.T.; Chang, C.Y.; Ho, C.Y.; Chen, L.Y. J. Coll. Inter. Sci. 1999, 15;214(2), 455-458.
- Martín-Lara M.Á.; Rico, I.L.R.; Vicente, I.C.A.; García, G.B.; Hoces de M.C. Desalin. 2010, 256, 58–63.
CrossRef - Ronda, A.; Martín-Lara, M.Á.; Blázquez, G.; Bachs, N.M.; Calero, M. Env. Prog. Sus. Ene. 2013, 33(1), 192–204.
CrossRef - Owamah, H.I. J. Mat. Cycl. Wast. 2014, 16, 347–358.
CrossRef - dos Santos, W.N.L.; Cavalcante, D.D.; da Silva, E.G.P.; da Virgrens, C.F. Microchem J. 2011, 97, 269–273.
CrossRef

This work is licensed under a Creative Commons Attribution 4.0 International License.


