Hydrothermal Synthesis of Gadolinium (Gd) Doped Cerium Oxide (Ceo2) Nanoparticles: Characterization and Antibacterial Activity
Y. A. Syed Khadar1, A. Balamurugan2, V.P. Devarajan1 and R. Subramanian1
1Department of Physics, K.S.R. College of Arts and Science for Women, Tiruchengode, Namakkal – 637 215, Tamil Nadu, India.
2Department of Physics, Government Arts College, Ooty, Udhagamandalam - 643 002, Tamil Nadu, India.
Corresponding Author E-mail: syedkhadar_ya@yahoo.co.in
DOI : http://dx.doi.org/10.13005/ojc/330533
This present study has been described the synthesis, characterization and antibacterial activity of gadolinium doped cerium oxide nanoparticles. The nanoparticles were prepared by hydrothermal method with various concentrations of gadolinium ranges from 2mol % to 8mol %. The X-ray diffraction (XRD) pattern revealed the face-centered cubic structure with crystalline size of 58.3 nm to 57.4 nm with increasing the concentration of gadolinium (2mol % to 8mol %). The Ce-O chemical bonding nature was confirmed using Fourier transform spectrophotometer (FTIR). The field emission scanning electron microscope (FESEM) exhibited fascinating shapes like cube and square of nanoparticles. UV spectroscopy used to measure the optical behaviors of CeO2 nanoparticles. Band-edge absorption of CeO2 nanoparticles blue shifted upon increasing the gadolinium concentration as compared to undoped CeO2 nanoparticles. The emission behavior of nanoparticles was examined by photoluminescence (PL) spectroscopy. PL spectra reveals a peak shift of CeO2 emission upon gadolinium doped due to oxygen defect. The gadolinium doped CeO2 nanoparticles showed better antibacterial activity against the pathogenic bacteria such as Escherichia coli, Staphylococcus aureus, Bacillus cereus and Salmonella typhi.
KEYWORDS:CeO2 Nanoparticles; Hydrothermal method; Morphology; Antibacterial activity
Download this article as:| Copy the following to cite this article: Khadar Y. A. S, Balamurugan A, Devarajan V. P, Subramanian R. Hydrothermal Synthesis of Gadolinium (Gd) Doped Cerium Oxide (Ceo2) Nanoparticles: Characterization and Antibacterial Activity. Orient J Chem 2017;33(5). |
| Copy the following to cite this URL: Khadar Y. A. S, Balamurugan A, Devarajan V. P, Subramanian R. Hydrothermal Synthesis of Gadolinium (Gd) Doped Cerium Oxide (Ceo2) Nanoparticles: Characterization and Antibacterial Activity. Orient J Chem 2017;33(5). Available from: http://www.orientjchem.org/?p=38692 |
Introduction
Cerium oxide (CeO2) nanostructures are getting more familiarity due to its enhanced properties than that of bulk material [1]. The cerium oxide nanoparticles (CeO2NPs) have unique structure because of their broad applicability to various areas such as microelectronics, optoelectronics, fuel cell technologies, gas sensors, solid state electrolytes and antimicrobial activities[2-4]. There are several methods have been proposed for the synthesis of CeO2 nanoparticles [5-8]. The hydrothermal method has advantages over other methods such as efficient synthesis process and morphology controlled growth. The CeO2 NPsplayed an important role in the remediation of toxicity of microorganism such as bacteria, yeast and fungi [9]. At lower temperatures it was found that this material has antimicrobial activity against several bacteria and reported the microorganisms were destroyed by the possibility of generation of reactive oxygen species [10]. The CeO2 nanoparticles and cell membrane of bacteria are attracted with each other due to the electrostatic interaction nature. Hence, this interaction indicates the important role of medium charge and microorganism surface nature in the anti-bacterial activity [11]. Further, the doping effect enhances the physical properties of CeO2 nanostructures for environment remediation. However, there is lack of information on the effect of Gadolinium (Gd) dopants on the structure and morphology in comparison with the undoped ceria. Considering the physical and chemical properties of CeO2 NPs, we made an attempt to synthesis the Gd doped CeO2 NPs by hydrothermal method. The undoped and Gd doped CeO2 nanoparticles were characterized using various spectral techniques. Antibacterial properties of these samples were determined against four pathogenic bacteria to know its bacterial killing efficiencies.
Experimental
Synthesis of Gd Doped CeO2 Nanoparticles
Trisodium phosphate solution (0.02M), 20 ml was slowly drop wise added to 60 ml of 0.1M solution of cerium nitrate under magnetic stirring. During meanwhile 2, 4, 6, and 8% of gadolinium nitrate solution were added to the above reaction mixture and continuously stirred for 30 min. The reaction mixture under constant stirring was resulted as white colloid. Then, the colloids were transferred to the Teflon coated autoclave vessel (100 ml capacity) for hydrothermal treatment maintained at 180˚C for 15 h. The autoclave vessel was cooled to room temperature. The colloid was removed by centrifugation and thoroughly washed with double distilled water followed by ethanol and dried at 60˚C for 5 h. A blank sample (CeO2) synthesized without gadolinium using the same procedure at same experiment conditions for the purpose of comparison.
Investigation of Nanostructures
The crystal structure of CeO2 and Gd doped CeO2 nanoparticles were determined by powder X-ray diffraction. XRD patterns were recorded using X-ray diffractometer (XRD, Shimadzu-6000) using Cu Kα radiation (λ=1.5408 Å). The surface morphology of CeO2 and Gd doped CeO2 nanoparticles were studied using a scanning electron microscope (SEM, JOEL JSM-6390). The presence of functional groups was confirmed using Fourier transform infrared spectrometer (FTIR, Brucker-Tensor 27). UV-absorption spectra of synthesized nanoparticles were carried using spectrophotometer UV-Vis (UV-Vis, Jasco V530). The photoluminescence (PL) emission spectra were measured at an excitation wavelength of 340 nm using Photoluminescence spectroscopy (Horiba Jobin, Flouromax-4) at room temperature.
Antibacterial Activity of Gadolinium Doped CeO2
The antibacterial activity of CeO2 and Gd doped CeO2 nanoparticles were studied against pathogenic bacteria such as Escherichia coli , Staphylococcus aureus, Bacillus cereus and Salmonella typhi using agar disc diffusion method. For this study, CeO2 and Gd/CeO2 nanoparticles were prepared at the concentration of 1 mg/ml using dimethylsulfoxide (DMSO) as solvent [12]. Then, the dispersed nanoparticles were impregnated into each sterile disc using micropipette under aseptic condition. The overnight bacterial culture was prepared using sterile nutrient broth. Then, all the grown bacterial culture was aseptically transferred to the sterile Mueller-Hinton agar medium using sterile cotton swab. After, the impregnated discs were kept on culture swapped Mueller Hinton Agar medium using sterile forceps. Finally, all the inoculated plates were allowed to incubate for 24 h using bacteriological incubator. After incubation, the zone of inhibition was measured against the bacterial strains.
Results and Discussion
FTIR Study
A broad peak observed at 3357 cm-1 is attributed to the OH stretching vibrations of moisture content present in atmosphere [13]. The band obtained at 2424 and 1042 cm-1 are due to the presence of organic impurities in the sample. The peak at 2424 cm-1 is due to the presence of dissolved or atmospheric CO2in the samples. A sharp peak obtained at 1629 cm-1 corresponds to the bending vibrations of H-O-H which is partly overlapping the O-C-O bond [14]. A band at 1379 cm-1 is due to the N-O stretching vibrations of oxygen atom present in the ceria nanoparticles. A peak noticed at 818 cm-1 is attributed to the O-Ce-O bonding nature of ceria nanoparticles. The small bands obtained at 700, 615 and 545 cm-1 are corresponding to Ce-O stretching mode [15] Thus FTIR spectra of the samples confirm the formation of Gd-CeO2 nanoparticles.
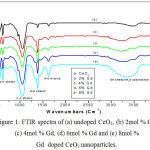 |
Figure 1: FTIR spectra of (a) undoped CeO2, (b) 2mol % Gd, (c) 4mol % Gd, (d) 6mol % Gd and (e) 8mol % Gd doped CeO2 nanoparticles.
|
XRD Structural Studies
The crystal structure, grain size and the lattice parameters of Gd-CeO2 NPs were analyzed from the XRD spectra is shown in Fig. 2. The XRD pattern of the Gd-CeO2 NPs is well indexed with the standard data [JCPDS card no. 75-0162] [16].The XRD pattern reveals the crystalline nature of the synthesized Gd-CeO2 nanoparticles. The peaks obtained at 2θ values at 28.5, 33.0, 47.4, 56.3, 59.0, 69.4, and 76.7˚ are corresponding to the (1 1 1), (2 0 0), (2 2 0), (3 1 1), (2 2 2), (4 0 0) and (3 3 1) planes. Our result is similar with the existing literate data of the CeO2 [17].
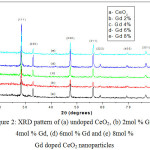 |
Figure 2: XRD pattern of (a) undoped CeO2, (b) 2mol % Gd, (c) 4mol % Gd, (d) 6mol % Gd and (e) 8mol % Gd doped CeO2 nanoparticles Click here to View figure |
In Gd-CeO2 NPs, the 2θ value of (111) plane is shifted towards lower side when the concentrations of Gd is increased. It happened due to the replacement of dopant ion in the CeO2 lattice [18]. In addition, the peak broadening taken place in Gd-CeO2 nanoparticles as compared with that of pure CeO2 synthesized without Gd. The broadening of the peak in Gd-CeO2 NPs clearly indicates the smaller sized particles as shown in Fig.2. The average crystallite size calculated using Debye-Scherrer’s formula was found in the range between 57.4-58.3 nm [19]. The size of Gd-CeO2 nanoparticles decreased with increasing the concentration of Gd [20]. The average sizes of Gd-CeO2 NPs are summarized in Table 1.
Table 1: XRD content for undoped and Gd doped CeO2 nanoparticles
| Samples | 2 θ (deg) | Crystallite size (nm) | d-spacing (Å) |
| CeO2 | 28.53 | 58.24 | 3.126 |
| CeO2: Gd (2%) | 28.47 | 57.99 | 3.134 |
| CeO2: Gd (4%) | 28.48 | 57.85 | 3.131 |
| CeO2: Gd (6%) | 28.45 | 57.56 | 3.132 |
| CeO2: Gd (8%) | 28.51 | 57.40 | 3.132 |
Optical Studies
UV-Vis absorption spectra of as-synthesized and Gd doped CeO2 nanoparticles are shown in Fig 3.
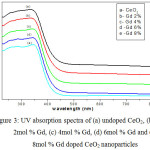 |
Figure 3: UV absorption spectra of (a) undoped CeO2, (b) 2mol % Gd, (c) 4mol % Gd, (d) 6mol % Gd and (e) 8mol % Gd doped CeO2 nanoparticles Click here to View figure |
Table 2: Band gap energy for undoped and Gd doped CeO2 nanoparticles
| Samples | Abs. Wavelength (nm) | Band gap energy (eV) |
| CeO2 | 343 | 3.62 |
| CeO2: Gd (2mol %) | 341 | 3.64 |
| CeO2: Gd (4mol %) | 340 | 3.65 |
| CeO2: Gd (6mol %) | 339 | 3.66 |
| CeO2: Gd (8mol %) | 338 | 3.67 |
The as-synthesized CeO2 nanoparticles show a strong absorption peak at 345 nm. Its corresponding band gap energy (Eg) obtained is 3.62 eV was calculated using Eg = 1242/λabsorption relationship. The band gap energy found to be slightly increased to 3.67 eV on increasing the concentration of Gd from 2mol % to 8mol %. It is believed that the decreased in the size of particles due to the increase of Gd concentration [21].The absorption value reveals the charge transfer from O2+ to Ce4+ energy levels in CeO2 crystal lattice [22]. The absorption wavelength and their corresponding band gap energy values are presented in Table 2.
Photoluminescence Studies
PL emission spectra of Gd doped CeO2 nanoparticles are revealed in Fig. 4. All Gd doped CeO2 samples showed excitation at 340 nm [23]. As-synthesized sample showed strong emission peak at 377 nm and it resembles to the transition of electron from localized Ce2f state to valence band of O2p. In addition, an emission peak at 434 nm and 466 nm was originated from defect states widely existing between Ce4f states to O2p of valence band. Moreover, an emission nature was gradually decreased beyond the range of 470 nm and also it was extended upto 550 nm. This emission range is related to charge transfer from Ce4f energy level to O2p level of valence band. Similarly, from the Gd doped CeO2 nanoparticles, the localized Ce4f state to O2p of valence band transition related emission nature is taken place gradually decreased due to Gd ions in the CeO2 crystal lattice causes doping effect.
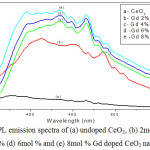 |
Figure 4: PL emission spectra of (a) undoped CeO2, (b) 2mol % (c) 4mol % (d) 6mol % and (e) 8mol % Gd doped CeO2 nanoparticles Click here to View figure |
On the other hand, the emission band of Gd-CeO2 gradually shifted towards longer wavelength, like 414, 454 and 486 nm as compared with that of as-synthesized CeO2 nanoparticles. This emission range is related to charge transfer from Ce4f energy level to O2p level of valence band and also possibility occurred due to the attribution of oxygen defects. In steps of increased doping concentration 2mol %, 4mol %, 6mol %, and 8mol %, respectively, the emission peaks became red-shifted due to the formation of more oxygen defects or possibility of conductive conditions for Ce3+ formation. Previous reports suggest that increasing the Gd dopant concentration may increase surface defect levels and suppress the electron transfer from Ce4f to O2p levels [24].
SEM Images Analysis
The images of pure CeO2 exhibit well defined cube and square shape uniform sized particles. The particles are uniformly dispersed. However, some distortion found in the Gd doped CeO2 nanoparticles. Four samples (CeO2) were synthesized using 2, 4, 6 and 8mol % of Gd.
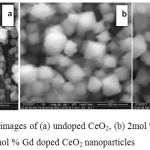 |
Figure 5: SEM images of (a) undoped CeO2, (b) 2mol % Gd (c) 8mol % Gd doped CeO2 nanoparticles Click here to View figure |
Among four samples, two samples synthesized using 2 and 8mol % of Gd were characterized as representative samples. As shown in Fig 5 (a) pure CeO2 show well defined shaped cubic crystals. The particles in the images are uniformly distributed. The cubic crystalline structure of 2mol % Gd doped CeO2 show slight distortion in its structure Fig.5 (b). Similarly, the crystalline structures of CeO2 nanocrystals are evenly distributed during the doping of 8mol % Gd with slight distortion Fig.5 (c). It is clearly reveals that the addition of Gd to CeO2 slightly changed the morphology of CeO2.The appearance of feather like fibre on the surface of cubic CeO2 nanocrystals indicate the effect of Gd in the formation of CeO2 crystal lattice [25].
Evaluation of Antibacterial Activity
Antibacterial activity of undoped and Gd-CeO2 nanoparticles were evaluated against pathogenic bacteria such as Escherichia coli, Staphylococcus aureus, Bacillus cereus and Salmonella typhi. The antibacterial results of nanoparticles are shown in Fig.6. The average zone of inhibition exhibited by pure CeO2 and various concentration of Gd doped CeO2 nanoparticles are presented in Table 3. The pure CeO2 did not show any activity against four bacteria. Whereas, the Gd doped CeO2 nanoparticles showed good antibacterial activity. The result obtained from the antibacterial study reveals that the killing efficiency of Gd-eO2 increased with increasing the concentration of Gd [26]. The zone of inhibition clearly show that the killing potential of CeO2 significantly increased by the Gd doping with Gd-CeO2
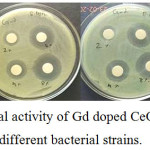 |
Figure 6: Anti-bacterial activity of Gd doped CeO2 nanoparticles with different bacterial strains. Click here to View figure |
Table 3: Antibacterial activity for undoped and Gd doped CeO2 nanoparticles
|
Bacterial strains |
Zone of Inhibitions (mm) |
|||
|
Various Concentrations of Gadolinium |
||||
|
2mol % |
4mol % |
6mol % |
8mol % |
|
| E. coli |
13 mm |
19 mm |
24 mm |
28 mm |
| B. cereus |
13 mm |
19 mm |
23 mm |
26 mm |
| S. aureus |
15 mm |
18 mm |
21 mm |
23 mm |
| S. typhi |
15 mm |
21 mm |
24 mm |
26 mm |
The 2mol % Gd doped CeO2 showed 13, 13, 15 and 15 mm zone of inhibition against E.coli, B.cereus, S. aureus and S. typhi, respectively. After increasing the concentration of Gd to 4mol %, the antibacterial activity against the same bacteria increased to 19, 19, 18 and 28 mm. In 6mol %, the measured zone of inhibition was 24, 23, 21 and 24 mm. As shown in Table 3, 8mol % Gd doped CeO2 showed maximum zone of inhibition against all those bacteria as 28, 26, 23 and 26mm. Among the four tested samples, 8mol % Gd doped CeO2 nanoparticles exhibit maximum bacterial activity against E.coli. Finding new biomaterials to kill such bacteria is a needy one. The increased concentration of Gd doping with CeO2 increases the antibacterial activity. It is due to the decreased particle size and increased surface to volume ratio.
It is noted that the band gap energy of the samples increased with increasing the concentration of Gd. Similarly, emission spectra of the Gd doped CeO2 shifted towards longer wavelength as compared with pure CeO2. In XRD pattern, the particle size decreases with increasing the concentration of Gd. The antibacterial activity of the Gd doped CeO2 found to be increased with increasing the concentration of Gd. The formation of Gd doped CeO2 reveals the crystalline and smaller sized nanoparticles. As the band gap energy increases, the particle size decreases, thus Gd doping produce smaller CeO2 nanoparticle. The smaller size particles easily transmit into the cell walls. It also increases the interaction between nanoparticle and the outer surface of the bacteria which induce more toxicity to the bacteria. Hence the Gd doped CeO2 showed maximum zone of inhibition against pathogenic bacteria.
Conclusions
Pure CeO2 and Gd doped CeO2 were successfully synthesized. A face-centre cubic crystal structure was confirmed from XRD patterns and their calculated crystalline sizes were 57.4 – 58.3 nm. A blue-shifted absorption was observed from UV optical spectrum and their calculated band gap energy values were 3.62 – 3.67 eV. The Ce-O chemical bonding nature and the presence of functional groups were confirmed from FTIR spectrum. A cubic shaped surface morphology was observed from FESEM images. Further, the antibacterial activity of nanoparticles were studied against different types of bacteria and observed enhanced killing effects. From the overall observations, we have concluded that the increasing concentration of Gd doping from 2mol % to 8mol % has shown an enhanced results such as decreased crystalline size, morphology change and anti-bacterial activity.
References
- Sun, C.; Li H.; Chen, L. Energy Environ. Sci. 2012, 5, 8475
CrossRef - Semikina, T.V. Semicond Phys Quantum Electron Optoelectron. 2004, 7, 291-296.
- Jasinski, P.; Suzuki, T.; Anderson, H.U. Sens. Actuator B Chem. 2003, 95, 73-77.
CrossRef - Lu, X.; Zhai, T.; Cui, H.; Shi, H.; Xie, S.; Huang, Y.; Liang, C.; Tong, Y. J. Mater. Chem. 2011, 21, 5569-5572.
CrossRef - Liu, Y. H.; Zuo, J. C.; Ren, X. F.; Yong, L. Metallurgy. 2014, 53, 463-465.
- Bumajdad, A.; Eastoe, J.; Mathew, A. Adv. Colloid Interface Sci. 2009, 147, 56–66.
CrossRef - Yuan, Q.; Duan, H. H.; Li, L. L.; Sun, L. D.; Zhang,Y. W.; Yan, C. H. J. Colloid Interface Sci. 2009, 335, 151–167.
CrossRef - Zamiri, R.; Ahangar, H. A.; Kaushal, A.; Zakaria, A.; Zamiri, G.; Tobaldi, D.; Ferreira, J. M. F. PLoS One. 2015, 10, e0122989.
CrossRef - Masui, T.; Fujiwara, K.; Machida, K. I.; Adachi, G. Y.; Sakata, T.; Mori, H. Chem. Mater. 1997, 9, 2197-2204.
CrossRef - Santos, C. L.; Albuquerque, A. J. R.; Sampaio, F. C.; Keyson, D. Volume 4, Microbiology Book Series: Formatex Research Center, Badajoz, Spain 2013.
- Thill, A.; Zeyons, O.; Spalla, O.; Chauvat, F.; Rose, J.; Auffan, M.; Flank, A. M. Environ. Sci. Technol. 2006, 40, 6151–6156.
CrossRef - Azad, A. M.; Matthews, T.; Swary, J. Mater. Sci. Eng. B. 2005, 123, 252–258.
CrossRef - Qizheng, C.; Xiangting, D.; Jinxian, W.; Mei, L. J. Rare earth. 2008, 26, 664–669.
- Li, D.; Xia, Y. Nano Lett. 2004, 4, 933–938.
CrossRef - Wang, T.; Sun, D. C. Mater. Res. Bull. 2008, 43, 1754–1760.
CrossRef - Jadhav, L. D.; Chourashiya, M. G.; Jamale, A. P.; Chavan, A. U.; Patil, S. P. J. Alloys Comp. 2010, 506, 739–744.
CrossRef - Zarinkamar, M.; Farahmandjou, M.; Firoozabadi, T. P. J. Ceram. Process. Res. 2016, 17, 166-169.
- Srinivas, K.; Vithal, M.; Sreedhar, B.; Raja, M.; Reddy, P. J. Phys. Chem. C. 2009, 113, 3543-3552.
CrossRef - Bear, J. C.; McNaughter, P. D.; Southern, P.; Brien, P.; Dunnill, C. W. Crystal. 2015, 5, 312-326.
CrossRef - Taniguchi, T.; Watanabe, T.; Sugiyama, N. J. Phys. Chem C. 2009, 113, 19789–19793.
CrossRef - Hu, C.; Zhang, Z.; Liu, H.; Gao, P.; Wang, Z. L. Nanotechnol. 2006, 17, 5983–5987.
CrossRef - Saranya, J.; Ranjith, K. S.; Saravanan, P.; Mangalaraj, D.; Rajendra Kumar, R. T. Mater. Sci. Semicond Proc. 2014, 26, 218–224.
CrossRef - Babitha, K. K.; Sreedevi, A.; Prinkaya, K. P.; Sabu, B.; Vargheze, T. J. Pure Appl. Phys. 2015, 53, 596-603.
- Ranjith, K. S.; Saravanan, P.; Chen, S. H.; Dong, C. L.; Chen, C. L.; Chen, S. Y.; Asokan, K.; Rajendra Kumar, R. T. J. Phys. Chem. C. 2014, 118, 27039-27047.
CrossRef - Liu, Y.; Li, T.; Chen, W.; Guo, Y.; Liu, L.; Guo, H. RSC Adv. 2015, 5, 11733–11737.
CrossRef - Gopinath, K.; Karthika, V.; Sundaravadivelan, C.; Gowri, S.; Arumugam, A. J. Nanostruct. Chem., 2015, 5, 295-303.
CrossRef - Ravi kumar, S.; Gokulakrishnan, R.; Boomi, R. Asian Pac. J. Trop. Dis. 2012, 2, 85-89.
- Leung, Y. H.; Yung, M. M. N.; Ng, A. M. C.; Ma, A. P. Y.; Wong, S. W. Y.; Chan, C. M. N.; Ng, Y. H.; Djurisic, A. B.; Guo, M.; Wong, M. T.; Leung, F. C. C.; Chan, W. K.; Leung, K. M. Y.; Lee, H. K. J. Photochem. Photobiol. B. 2015, 145, 48–59.
CrossRef - Kuang , Y.; He, X.; Zhang, Z.; Li, Y.; Zhang, H.; Ma, Y.; Wu, Z.; Chai, Z. J. Nanosci. Nanotechnol. 2011, 11, 4103.
CrossRef

This work is licensed under a Creative Commons Attribution 4.0 International License.


