Ultrasonic and Viscous Behaviour of Hydroquinone in Alcohols
Raj Kumar1, Singh Y. P2 and Yadav S. S.
1Department of Chemistry, K.A. (PG) College, Kasganj-207123 (UP) India.
2Department of Chemistry, J.L.N. PG College, Bhopal-462002 (MP) India.
Corresponding Author E-mail: dr.rk.ksj@gmail.com
DOI : http://dx.doi.org/10.13005/ojc/330362
The ultrasonic velocity (V), density (ρ) and viscosity (η) measurements of Hydroquinone in n-propanol and iso-propanol have been carried out for the study of solute-solvent interaction. Experimental data have been used to calculate the isentropic compressibility (βs), intermolecular free length (Lf), specific acoustic impedance (Z), molar sound velocity (R), relative association (RA) solvation number (Sn) apparent molal adiabatic compressibility (øK), specific viscosity (ηsp), reduced viscosity (η) and relative viscosity (ηr). The sign and magnitude of these properties have been used to interpret the experimental results in terms of solute-solvent interaction.
KEYWORDS:Ultrasonic velocity; Density; Viscosity; Hydroquinone; n-propanol and iso-propanol
Download this article as:| Copy the following to cite this article: Kumar R, Singh Y. P, Yadav S. S. Ultrasonic and Viscous Behaviour of Hydroquinone in Alcohols. Orient J Chem 2017;33(3). |
| Copy the following to cite this URL: Kumar R, Singh Y. P, Yadav S. S. Ultrasonic and Viscous Behaviour of Hydroquinone in Alcohols. Orient J Chem 2017;33(3). Available from: http://www.orientjchem.org/?p=33875 |
Introduction
Knowledge of densities, viscosities and ultrasonic velocity of liquid mixture is important to understand the solute-solvent interactions between Hydroquinone in n-propanol and iso-propanol to develop new theoretical models and also for engineering applications.1-5 Hydroquinone, also benzene – 1,4 – diol or quinol was first obtained in 1820 by the French chemist Pelletier and Caventou6 via the dry distillation of quinic acid which obtained by the bark of cinchona trees. Hydroquinone is a skin-bleaching agent that is used to lighten the dark patches of skin caused by pregnancy, birth control pills, hormone medicine, or injury to the skin. Hydroquinone most common use is it ability to act as a reducing agent that is water soluble.
In view of growing interest, in this paper, the results of an ultrasonic velocity, density and viscosity to study the related acoustical parameters, for the binary systems of hydroquinone + n-propanol and hydroquinone + iso-propanol at 27°C + 0.05°C have been reported. The results are discussed in terms of solute-solvent interactions.
Experimental
All the chemicals used in the present work were analytical reagent (AR) grade. The liquid mixtures of various concentration (mole/L) of hydroquinone + n-propanol and hydroquinone + iso-propanol were prepared by mass in a 25cm3 flask using a analytical balance. The speed of sound waves were obtained by using ultrasonic interferometer (Model F-81, Mittal Enterprises, New Delhi) at a fixed frequency of 2Mhz with an accuracy of + 2ms–1 and a constant temperature 27°C + 0.05°C. An electronically digital operated constant temperature bath (RAAGA industries, Madras) has been used to circulate water through the double walled inter-ferometric cell made up of steel containing the experimental solution at the desired temperature. The density of pure solvents and solutions were determined using a specific gravity bottle of 10ml. capacity. An Ostwald’s viscometer which is 10ml capacity was used for the viscosity measurement. The viscometer was calibrated with fresh conductivity water immersed in the water bath which was kept at the experimental temperature. The time flow of water (tw) and the time flow of solution (ts) was measured with digital stop watch having an accuracy + 3 x 10⁻⁶ Nm–2S. The temperature around the viscometer was maintained in an electronically controlled thermostatic water bath. The purity of chemicals was checked by comparing with their densities with literature values.
Using the measured data, some acoustical parameters have been calculated using the standard relations,
Isentropic compressibility (βs)7 is given by
![]()
Intermolecular free length (Lf)8 is calculated by
![]()
where K is the temp. dependent Jacobason constant.
Specific acoustic impedance (Z)9 is calculated by
Z = V. ρ ….3
Molar sound velocity (R) is obtained by
![]()
and

where n1, n2 and m1, m2 are the number of moles and molecular weight of the solvent and solute respectively.
Relative association (RA)10 is given by

where V0, V, and r are the ultrasonic velocity and density of the solvent and solution respectively.
Solvation number (Sn)11 is calculated by

Apparent molal adiabatic compressibility
![]()
is given by—

Where
![]()
are isentropic compressibility and density of solvent and solution respectively. C is the concentration in mole/l. M is the molecular weight of the solute.
![]()
is the function of C as obtained by Gocker from Debye-Huckel theory.12
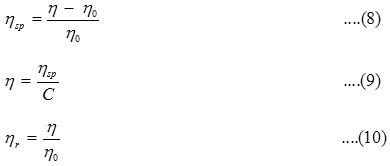
Specific viscosity (ηsp), Reduced viscosity (η) and relative viscosity (ηr) are calculated by the following well known relationship—

Where η, η0 & C are the viscosity of solution, solvent and concentration of solution in mole/L respectively.
Results and Discussion
Ultrasonic velocity (V) in the solution of hydroquinone in n-propanol and iso-propanol increases with increasing concentration of hydroquinone. The variation of velocity with concentration (C) of hydroquinone solution in n-propanol and iso-propanol can be expressed by the following relation—

The result shows that while the density increases, the isentropic compressibility decreasing with increasing concentration of solute13 and the quantity (dρ/dc) is positive while (dβs/dc) is negative. Since the value of [1/βs (dβs/dc)] are greater than the values of [1/ρ (dρ/dc)] for hydroquinone solution in n-propanol and iso-propanol. The concentration derivative of velocity (dv/dc) is positive14-16 i.e. the ultrasonic velocity increases with increasing the concentration of hydroquinone in solution.
System : Hydroquinone + iso-propanol at 27°C + 0.05°C
|
Concentration (C) mol/li. |
Density (r) gm/ml |
Ultrasonic Velocity (V) |
Isentropic Compressibility (bs) Cm2/dyne.1012 |
Apparent molal Adiabatic Compressibility (fK) cm2/dyne 109 |
Specific Acoustic Impedance (Z) 2×10⁻⁵ (C.G.S.) |
Intermolecular free length (Lf) A° |
|
0.0909 |
0.7905 |
1124.0 |
100.13 |
-29.619 |
0.8885 |
0.6274 |
|
0.1000 |
0.7915 |
1124.5 |
99.91 |
-30.423 |
0.8900 |
0.6267 |
|
0.1111 |
0.7927 |
1124.5 |
99.76 |
-30.137 |
0.8913 |
0.6262 |
|
0.1250 |
0.7942 |
1125.0 |
99.48 |
-30.585 |
0.8934 |
0.6253 |
|
0.1428 |
0.7962 |
1125.5 |
99.14 |
-31.148 |
0.8961 |
0.6242 |
|
0.1666 |
0.7988 |
1126.5 |
98.65 |
-31.518 |
0.8998 |
0.6227 |
|
0.2000 |
0.8025 |
1127.5 |
98.02 |
-31.808 |
0.9048 |
0.6207 |
|
0.2500 |
0.8080 |
1129.5 |
97.00 |
-32.385 |
0.9126 |
0.6175 |
|
0.3333 |
0.8171 |
1132.0 |
95.50 |
-32.339 |
0.9249 |
0.6127 |
|
Molar Sound Velocity (R) |
Solvation Number (Sn) |
Relative Association (RA) |
Viscosity (Cantipoise) (h) |
Specific Viscosity (hsp) |
Reduced Viscosity (h) Centipulse |
Relative Viscosity (hr) |
|
795.05 |
1.94 |
1.0127 |
2.1916 |
0.1714 |
1.8857 |
1.1714 |
|
795.05 |
2.04 |
1.0139 |
2.2083 |
0.1803 |
1.8034 |
1.1803 |
|
793.97 |
2.01 |
1.0154 |
2.2167 |
0.1848 |
1.6636 |
1.1848 |
|
793.28 |
2.07 |
1.0172 |
2.2250 |
0.1892 |
1.5141 |
1.1892 |
|
792.28 |
2.12 |
1.0196 |
2.2417 |
0.1981 |
1.3879 |
1.1981 |
|
791.10 |
2.19 |
1.0226 |
2.2752 |
0.2160 |
1.2971 |
1.2160 |
|
788.43 |
2.23 |
1.2071 |
2.3087 |
0.2340 |
1.1700 |
1.2340 |
|
786.79 |
2.30 |
1.0335 |
2.3756 |
0.2697 |
1.0790 |
1.2697 |
|
782.52 |
2.30 |
1.0443 |
2.4952 |
0.3144 |
1.0943 |
1.3144 |
The isentropic compressibility (βs) of hydroquinone solutions decreases with increase in the molar concentration of solute. The results of isentropic compressibility have been explained in terms of Bechem’s equation.17
![]()
where
![]()
is the isentropic compressibility of the solvent, C is the molar concentration and A & B are constant [A (-14.50 and -15.60) and B(6.868 and 1.389)].
System : Hydroquinone + n-propanol at 27°C + 0.05°C
| Concentration (C) mol/li. | Density (r) gm/ml | Ultrasonic Velocity (V) | Isentropic Compressibility (bs) Cm2/dyne.1012 | Apparent molal Adiabatic Compressibility (fK) cm2/dyne 109 | Specific Acoustic Impedance (Z) 2×10⁻⁵ (C.G.S.) | Intermolecular free length (Lf) A° |
| 0.0909 | 0.8047 | 1216.5 | 83.97 | -24.199 | 0.9789 | 0.5745 |
| 0.1 | 0.8057 | 1217 | 83.8 | -24.722 | 0.9805 | 0.5739 |
| 0.1111 | 0.8069 | 1217.5 | 83.6 | -25.247 | 0.9824 | 0.5732 |
| 0.125 | 0.8084 | 1218 | 83.38 | -25.484 | 0.9846 | 0.5725 |
| 0.1428 | 0.8104 | 1218.5 | 83.1 | -25.766 | 0.9874 | 0.5715 |
| 0.1666 | 0.813 | 1219.5 | 82.7 | -26.155 | 0.9914 | 0.5701 |
| 0.2 | 0.8167 | 1220.5 | 82.19 | -26.316 | 0.9967 | 0.5684 |
| 0.25 | 0.8222 | 1221.5 | 81.51 | -26.149 | 1.0043 | 0.566 |
| 0.3333 | 0.8314 | 1224 | 80.28 | -26.974 | 1.0176 | 0.5617 |
| Molar Sound Velocity (R) | Solvation Number (Sn) | Relative Association (RA) | Viscosity (Cantipoise) (h) | Specific Viscosity (hsp) | Reduced Viscosity (h) Centipulse | Relative Viscosity (hr) |
| 801.87 | 1.93 | 1.0123 | 1.9686 | 0.0232 | 0.261 | 1.0232 |
| 801.42 | 2.01 | 1.0134 | 1.9837 | 0.0311 | 0.3113 | 1.0311 |
| 800.87 | 2.09 | 1.0147 | 1.9913 | 0.035 | 0.3158 | 1.035 |
| 800.16 | 2.13 | 1.0167 | 1.9989 | 0.039 | 0.3122 | 1.039 |
| 799.15 | 2.17 | 1.019 | 2.014 | 0.0469 | 0.3283 | 1.0468 |
| 798.14 | 2.23 | 1.022 | 2.0443 | 0.0626 | 0.3759 | 1.0626 |
| 798.34 | 2.26 | 1.0263 | 2.0746 | 0.0783 | 0.3919 | 1.0783 |
| 763.61 | 2.23 | 1.033 | 2.1742 | 0.1098 | 0.4395 | 1.1098 |
| 789.24 | 2.24 | 1.0438 | 2.2109 | 0.1492 | 0.4477 | 1.1492 |
The value of constants (A & B) were obtained from the intercept and slope of plots
![]()
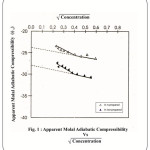
The complementary use of isentropic compressibility data can provide interesting information about solute–solvent interaction. Apparent molar adiabatic compressibility
![]()
varies linearly as the square root of concentration
![]()
.The values of apparent molal adiabatic compressbilities are negative with the increase in molar concentration of hydroquinone in n-propanol and iso propanol.18 The values of
![]()
[–24.30 and –28.10cm2/dyne.109] for the solution of hydroquinone in n-propanol and iso- propanol respectively. The values of
![]()
were evaluated by extra plotting. The graph of
![]()
Vs
![]()
(shown in fig 1).
 |
Figure 1: Apparent Modal Adiabatic Compressibility Click here to View figure |
The intermolecular free length (Lf) decreases while the specific acoustic impedance (Z) increases with an increase in the concentration of hydroquinone in solutions which can be explained on the basis of lyophobic interaction between solute and solvent molecules which increase the intermolecular distance making relatively under gaps between the molecules and becoming the main cause of impedance in the propagation of ultrasound waves. These results are in agreement with results reported by Bhandakkar19 for methylmethacrylate with methanol, p-dioxane and cyclohexane. The molar sound velocity (R) has been found to varied linearly with the molar concentration of hydroquinone in solutions. Linear decrease of molar sound velocity with molar concentration has been also reported for cerous nitrate salt by Singh20.The relative association (RA) and solvation number (Sn) increases with molar concentration has been also reported by Diwidi et.al21 in complex formation between KCl, CaCl2 and HgCl2.
 |
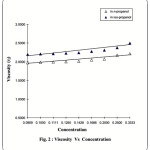
Figure 2: ViscosityVs Concentration
|
The increase in viscosity may be due to the increasing tendency of hydroquinone molecules to form aggregates with the increase in the hydroquinone concentration in solution. The plots of viscosity Vs molar concentration are shown in figure 2. The slops of lines is found to be positive in each case. Linear increase of the viscosity results has been also reported for some ternary electrolytes in dioxane water mixture by Das22. These results of viscosity indicates that there is a significant interaction between the solute and solvent molecules.23-25
Conclusion
The solute-solvent interaction present in hydroquinone with n-propanol & iso-propanol have been studied by ultrasonic velocity, density and viscosity study. On the basis of the results obtained from the study, it is concluded that the solute-solvent interaction in the solution of hydroquinone with n-propanol and iso-propanol is significant and the computed acoustical parameters and their values indicates to the presence of solute-solvent interaction in the solutions.
References
- Arrozo, S., Nerin, C. and Benito, Y. : Ultraonics sonochemistry, 2007, 14 343.
- Dabid, R., Villermous, J. : Chemical engineering science : 1991., 46(4), , 1129.
CrossRef - Prabhakar, S. & Gopal, R. : Ind. J. Pure and Appl. Phys., 2008.,46, 251.
- Thirumaran, S., Suguna, M. and Salvi, S.R., Research J. Chemi., Enviran.,2009, 13(3), 81.
- F.J. Millero, A. Surdo and Shine, J. Phys. Chem., 1978. 82, 784
CrossRef - Pelletier & Caventou (1820), Annales de chimie et de physique, 2nd Series, 15 : 289-318, 337-364.
- D.O. Mason, Philos. Mag., 1929. 8, 218
CrossRef - B. Jacobason, Acta Chem. Scand., 1952. 6, 1485
CrossRef - I.E. Elpiner, Ultrasound Physcal, Chemical and Biological effects, New York, consultants Bureau, 1960. 371
- A. Wdeissler, J. Chem. Phys., 1947.15, 210
- A. Passynskii, Act. Physicco. Chem., (U.R.S.S.) 8, 1933, 357; J. Phys. Chem. (U.S.S.R.), 11, 1938, 451.
- Debye and Huckel, Physik Z., 1923.24, 185
- Riyazuddin and Imran Khan, J. Thermodynamic Acta, 2009. 483, 45,
- S. Prakash, and C.V. Chaturvedi, Ind. J. Chem., 1972.,10, 669.
- K. Rambrahman and M. Suryanarayan, Ind. J. Pure & Appl. Phys., 1968. 6, 422
- I.F. Mikanailor, M.V. Rozina and V.A. Snutilavakut, Zh., 1964.,.10, 213
- Bachem, C., Physica (Nrtherlands) 1935. 101, 218
- T. Sumathi and M. Varalakshmi, Rasayan J. Chem., 2010. 3, 550-558
- V.P. Bhandakkar, IOSR J. of Appl. Physics, 2012. 1, 38&43
- S. Singh, Ph.D. Thesis, University of Allahabad 1978.
- K.S. Dwidi, Om Prakash and S. Prakash, Vijana Parishad Anusandhan Patrika, 1978. . 21, . 3, 225-236
- R.B. Das, Ind. J. Chem,1977.., 15A, 1098
- R.H. Stokes and R. Mills, “Viscosity of electrolytes and related Properties” (Pergmen Press, New York) 1965
- J.E. Desnoyers and G. Perron, J. Soln. Chem.,1972 1, 199.
- Mohd. Yaser, I. Journal of Pure & Appl. Physics, 2013.l. 51, 621-626

This work is licensed under a Creative Commons Attribution 4.0 International License.


