Characterization and Study the Inhibition Activity of Pomegranate Peel Extract for α-Brass Corrosion in H2SO4 Solution
Mustafa Sabri Cheyad and Taghried Ali Salman
Department of Chemistry, College of Science, Al-Nahrain University, Baghdad, Iraq.
Corresponding Author E-mail: dr.tag_s@yahoo.com
DOI : http://dx.doi.org/10.13005/ojc/330323
The present research focuses on the inhibition acting of green corrosion inhibitor of aqueous extract of pomegranate peel on α-brass alloy corrosion in 2M H2SO4 at temperature range (293-313)K. The pomegranate peel extract was characterized using Fourier infrared Spectroscopy (FTIR), Gas Chromatography Mass Spectroscopy (GC-MS) and Electrochemical polarization. The Tafel Plots revealed that the pomegranate peel extract acts as mixed-type inhibitor in sulfuric acid solution. Inhibition Efficiency (IE%) was increased significantly with increase the inhibitor concentration reaching up to (91.86%) at 500 ppm and decrease with increasing temperature. The corrosion products were investigated using X-ray Diffraction (XRD) analysis which confirmed the aggressivity of sulfate ions and formation of zinc sulfide (ZnS). Scanning Electron Microscope (SEM) examined the α-brass surface corrosion was prevented due to adsorption of inhibitor molecules on its surface. The adsorption of inhibitor molecules on brass obeys langmiur adsorption isotherm.
KEYWORDS:Corrosion; α-brass; Pomegranate; Polarization; GC-MS; H2SO4
Download this article as:| Copy the following to cite this article: Cheyad M. S, Salman T. A. Characterization and Study the Inhibition Activity of Pomegranate Peel Extract for α-Brass Corrosion in H2SO4 Solution. Orient J Chem 2017;33(3). |
| Copy the following to cite this URL: Cheyad M. S, Salman T. A. Characterization and Study the Inhibition Activity of Pomegranate Peel Extract for α-Brass Corrosion in H2SO4 Solution. Orient J Chem 2017;33(3). Available from: http://www.orientjchem.org/?p=33938 |
Introduction
Corrosion is defined as a destruction of a metal by chemical attack or reaction with its environment, causing a serious and continuous problem (1). Copper and copper-based alloys are widely used in different industries. Brass has been used in industry applications and in heat exchange tubes for instance cooling water systems, power generations and heat exchangers (2). These equipment should constantly be cleaned because of their heating transmission resulted of precipitating oxides and carbonates. Acid solutions such as (sulfuric acid) are widely used in industry in most important areas of applications being acid pickling, cleaning and descaling (3). There are several ways to reduce the corrosion rates at which propagate with enhance the metallic and alloys lifetime using inhibitors for the corrosion control of the metal or alloy in contact with aggressive environments is among the acceptable practices to reduce corrosion rate. A corrosion inhibitor defined as a substance which when added in minimal concentration levels to an environment causes effectively reduces the corrosion rate of a metal or alloy to that environment (4). Generally organic compounds with higher molecular weight and hetero atoms (N, S and O) are using as effective inhibitors for brass in H2SO4, most of organic and inorganic inhibitors are toxic, costly and non-biodegradable. As result of increasing awareness of health and environment nowadays more researchers work and study on using natural products fruits and plants parts as green corrosion inhibitors they are non-toxic, cheap and easily available. The fruits peel extracts are organic in nature and contain polycarboxylic acids, phenolic compounds, polysaccharides acids, alkaloids and pigments these derivatives have a potential to be used as corrosion inhibitors (5). The aim of present work is to characterized the pomegranate peel extract and study its electrochemical behavior on α-brass in acidic medium.
Experimental
Specimen Preparation
Commercially circular α-brass (70% Cu, 30% Zn) with dimensions ( 1.2mmX 2cm were polished with emery papers 320, 500, 2000 and 4000 degreased with ethanol and etched with acetone rinsed with distilled water and left to dry at room temperature.
Solution Preparation
The aggressive solution, 2M H2SO4 was prepared by dilution of analytical grade with distilled water in 1L volumetric flask.
Inhibitor Preparation
The aqueous extract of pomegranate peel was obtained by following steps:-
The peel were collected from local market in Baghdad cleaned and left 5 days to dry then grinded by electric mixer.
Weight about 20g and dissolved in an appropriate of deionized water the mixture was heated until boiling then cooled overnight at room temperature.
The mixture was filtered several times to extract the same output then heated to concentrate the extract.
The extract was collected and placed in 250 ml volumetric flask, (6) completed by deionized water then different concentrations (200, 300, 400, 500) ppm were prepared.
Electrochemical Polarization Measurement
The corrosion cell was constructed of three-electrode system in flat bottom Pyrex glass flask. The circular α-brass was used to construct the working electrode with surface area of 1 cm². The saturated calomel and platinum electrode was used as reference and axillary electrodes respectively. The polarization tests were carried out by potentiostat/galvanostat 200 Mlab (2007) Germany connected to a host computer and programmed by software throughout the experiment which contains all the necessary parameters for polarization process. Before the polarization process occurred, the working electrode left about 15 min to attain the steady state open circuit potential (OCP) after obtaining this potential the polarization was achieved by polarizing the working electrode about range (±200 mv) at scan rate 2 mV/s which permit to determine the electrochemical parameters.
Gas Chromatography Mass Spectrum Measurement
The methanolic extract of pomegranate peel was prepared by dissolve 3 g of the peel powder in 30 ml of methanol and left for 3 days so that all the biological components dissolve. Then the mixture was filtered using Whatman No.1 filter paper (7). GC-MS that used for analysis was made (QP 2010 Plus SHIMADZU, Japan) computerized control. The measurement began with inject of 2 µL using micro syringe at 70 eV using Helium as inert gas .The runtime of the entire experiment was 30 min. The unknown sample is compared to standards based on database library.
Fourier Infrared Spectroscopy
The powder peel was subjected for FTIR spectroscopy (Shimadzu, IR Affinity 1, Japan) with scan range between 4000-500 1/cm.
X-Ray Diffraction
The x-ray diffraction analysis was carried out using Diffractometer (Bruker, 2D Phaser, Germany). The specimen was measured 48 h after the polarization finished.
Results and Discussion
Potentiodynamic Polarization Curves
Figure 1 shows the polarization curves for α-brass in 2M H2SO4 solution in absence and presence of different concentrations of pomegranate peel extract the curves show that the addition of the inhibitor with different concentration retard both metal dissolution and hydrogen processes (8) by shifting the corrosion potential toward the noble direction as cleared as at 200, 300, 400 ppm and toward active direction at 500 ppm which indicated that the peel extract acts as mixed-type inhibitor (9).
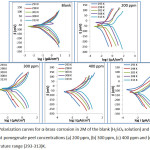 |
Figure 1: Polarization curves for α-brass corrosion in 2M of the blank (H2SO4 solution) and in presence of different pomegrnate peel concentrations (a) 200 ppm, (b) 300 ppm, (c) 400 ppm and (d) 500 ppm at temperature range (293-313)K. |
The corrosion parameters Ecorr, icorr, anodic and cathodic tafel slopes and corrosion rate in absence and presence the inhibitor concentration were listed below in table 1. The corrosion potential values were found to be varied throughout the experiment (10). The great extent values of current density in the blank solution attributed to the great oxidizing power that H2SO4 exhibits also due to dissolved oxygen at Air/solution interface. Addition of different concentration of the inhibitor significantly reduces current density that’s attributed to formation of protective film via adsorption process (11). The inhibition efficiency was increased with increasing the pomegranate peel extract and decreased with increasing temperature. The anodic and cathodic tafel slopes (ba,bc) were found to be varied at all the inhibitor concentrations which indicate that the pomegranate peel acts as mix-type inhibitor (12).
Table 1: Corrosion parameters of α-brass in 2M H2SO4 and in presence of different concentrations of pomegranate peel extract at temperature range (293-313)K.
|
Inh. (ppm) |
T (K) |
-Ecorr (mV) |
icorr (µA/cm²) |
Tafel slope (mV/dec) |
CR (g/m²d) |
PR (mm/Y) |
|
|
-bc |
+ba |
||||||
|
0 |
293 |
68.1 |
29.34 |
77.9 |
63.1 |
8.35 |
0.342 |
|
298 |
69.3 |
57.03 |
75.8 |
66.2 |
15.02 |
0.664 |
|
|
303 |
67.3 |
141.61 |
89.2 |
82.1 |
33.2 |
1.65 |
|
|
308 |
56.7 |
148.99 |
83.9 |
75.9 |
41.08 |
1.93 |
|
|
313 |
47.1 |
239.77 |
85 |
74.2 |
47.9 |
2.79 |
|
|
200 |
293 |
51 |
11.34 |
140.1 |
84.7 |
2.96 |
0.13 |
|
298 |
39.9 |
22.4 |
128.6 |
93.4 |
6.27 |
0.257 |
|
|
303 |
67 |
57.3 |
122.6 |
96.7 |
15.9 |
0.649 |
|
|
308 |
17.3 |
62.28 |
89.1 |
74.3 |
17.1 |
0.702 |
|
|
313 |
44 |
108.18 |
103 |
87.1 |
30.8 |
1.26 |
|
|
300 |
293 |
47.3 |
5.8 |
151.3 |
70.2 |
1.66 |
0.0643 |
|
298 |
48.6 |
12.3 |
142.7 |
86 |
3.42 |
0.14 |
|
|
303 |
49.2 |
31.4 |
93.4 |
78.5 |
9.21 |
0.375 |
|
|
308 |
43 |
47.82 |
107.5 |
90.6 |
13.6 |
0.557 |
|
|
313 |
34.8 |
79.92 |
97.1 |
84.4 |
22.1 |
0.903 |
|
|
400 |
293 |
60.2 |
3.1 |
94 |
48.7 |
0.866 |
0.0354 |
|
298 |
61.7 |
9.1 |
126 |
79.9 |
2.55 |
0.107 |
|
|
303 |
64.8 |
23.15 |
121 |
96.3 |
6.6 |
0.27 |
|
|
308 |
53.2 |
27.25 |
82 |
68.3 |
7.91 |
0.324 |
|
|
313 |
48.8 |
51.14 |
102 |
84.7 |
14.5 |
0.592 |
|
|
500 |
293 |
89.8 |
2.4 |
151.9 |
81.7 |
0.682 |
0.0279 |
|
298 |
115.5 |
4.81 |
118 |
62.8 |
1.37 |
0.0559 |
|
|
303 |
120.4 |
13.25 |
101.4 |
78.3 |
1.68 |
0.0639 |
|
|
308 |
133 |
20.97 |
106.5 |
81.3 |
3.27 |
0.201 |
|
|
313 |
123 |
39.24 |
124.8 |
98.5 |
10.2 |
0.418 |
|
Gas Chromatography Mass Spectrum
Fruits and plants contain numerous natural organic and inorganic compounds. Table 2 shows the main phytochemicals that presence in methanolic extract of pomegranate peel. GC-MS measurement of the peel extract confirmed presence of alcohols compounds, ketones, polycarboxylic and amines such of these compounds contain large number of hetero atoms (N, S, O ,P) these atoms contain electronic density (lone pair) which make it more versatile to adsorb on the metal surface and improve of protective film to prevent the interaction at metal/solution interface. The presence of hetero atoms in large number provides an evidence of high inhibition efficiency of pomegranate peel extract.
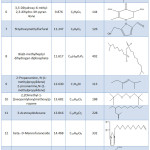 |
Table 2: The major identified compounds in methanolic extract of poemgranate peel. |
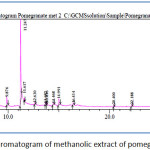 |
Figure 2: Chromatogram of methanolic extract of pomegranate peel.
|
Fourier Infrared Spectroscopy
Figure 3 shows the spectrum of pomegranate peel powder. The spectrum proved the presence of Alcohols compounds, Alkenes, Carboxlic acids, Esters, Amines, Ethers, Aldehydes and Ketones. The major bands of functional groups were listed below in table 3.
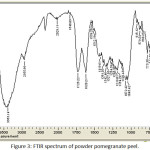 |
Figure 3: FTIR spectrum of powder pomegranate peel. |
Table 3: The main FTIR bands in powder pomegranate peel.
| NO. | Peak number (cm-1) | Bond | Group assignment |
| 1 | 3384.14 | O-H | Hydrogen bonded Alcohols |
| 2 | 2935.66 | C-H | Alkanes |
| 3 | 1728.22 | C=O | Carbonyl compounds |
| 4 | 1620 | C=C | Alkenes |
| 5 | 3460.16 | N-H | Amines |
| 6 | 1219 | C-O | Ethers |
| 7 | 1072 | C-N | Amides |
| 8 | 698.23 | C-H | Alkenes |
| 9 | 918.12 | C-H | Alkenes |
X-Ray Diffraction Investigation Analysis
X-ray Diffraction provides a convenient method for corrosion products investigation. The measurement begins when a beam of X-ray interact with crystalline materials which resulted scattered beam and diffracted others. The diffractometer compares the data form the specimen under the investigation and standards based on values of 2theta. Figure 4 shows the diffractogram of α-brass in absence of pomegranate peel inhibitor.
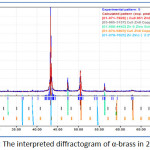 |
Figure 4: The interpreted diffractogram of α-brass in 2M H2SO4 |
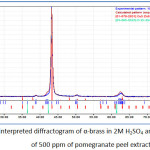 |
Figure 5: The interpreted diffractogram of α-brass in 2M H2SO4 and in presence of 500 ppm of pomegranate peel extract. |
X-ray patterns of α-brass in the blank confirms the most accepted mechanism about corrosion of brasses alloys which stated that the first step is dissolution of zinc from alloy surface (13). The diffractogram also confirmed the aggressivity of sulfate ions and formation of zinc sulfide. When the inhibitor added a significant decrease in zinc dissolution is occurred and prevented ZnS formation which provides another evidence of formation a protective film that’s prevent the interaction between metal and electrolyte at metal/electrolyte interface.
Effect of Temperature
The effects of temperature on corrosion of α-brass have been discussed using Arrhenius equation. The Kinetic parameters in absence and presence of the inhibitor have been calculated using a logarithmic form of the equation:

Where A is pre-exponential factor in (molecules.cm-2.s-1), Ea is activation energy in (kJ/mol), T is absolute temperature in (kelvin) and R is gas constant in (J/mol.K). The calculated values of Ea in absence and presence of the pomegranate peel inhibitor were listed in table 4. Ea values in presence of the inhibitor were found to be higher than those for the blank solution which indicated adsorption of inhibitor molecules and accomplished the inhibiting action by increasing the energy barrier from reactants to activated complex which hindered the corrosion process. In order to evaluate the other parameters Enthalpy of activation ΔHa and Entropy of activation ΔSa an alternative form of Arrhenius equation is used (14).

Where N is Avogadro’s number, h is plank’s constant and icorr is current density in (Amper.m-2). The equation above can be rewritten as:

Plots log icorr vs. 1/T and ln (icorr/T) vs. 1/T are given below where the enthalpy of activation and entropy of activation determined from slopes and intercepts respectively. The positive sign of the enthalpy represents the endothermic nature of α-brass corrosion. The large values of entropy activation represent the increase in randomness as the concentration of the inhibitor increase this can be explained that a decrease in disorder occurred when the reactants transform to the activated complex. The activated complex represents association rather than dissociation in the rate determining step.
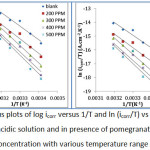 |
Figure 6: Arrhenius plots of log icorr versus 1/T and ln (icorr/T) vs 1/T of α-brass in 2M of acidic solution and in presence of pomegranate peel at different concentration with various temperature range (293-313)K |
Table 4: Arrhenius parameters for corrosion of α-brass in 2M acidic solution and in presence of different cocentrations of poemgranate peel at temperature range (293-313)K.
|
Inh. |
Conc. (ppm) |
Ea (kJ.molˉ1) |
A× 10³³ (molecules.cm-2.s-1) |
ΔHa (kJ.mol-1) |
ΔSa (J.K-1.mol-1) |
|
Blank |
– |
79.02 |
2.47 |
76.48 |
-69.33 |
|
Pomegranate Peel Extract |
200 |
84.73 |
9.77 |
82.20 |
-57.69 |
|
300 |
100.94 |
3710 |
98.42 |
-8.39 |
|
|
400 |
102.63 |
4670 |
100.10 |
-6.56 |
|
|
500 |
108.26 |
34700 |
105.73 |
10.14 |
Thermodynamic Parameters of Adsorption Isotherm
The adsorption mechanism of the inhibitor molecules on the metal surface can be explained using Langmuir adsorption isotherm. Where the surface coverage (θ) depends on the concentration of the inhibitor (C). This isotherm models is used because the corrosion of α-brass met the conditions of the isotherm since its homogenous monolayer and the collected data fit the regression line with value of determination coefficient R² is 0.99.
The expression of Langmuir equation is:

Where Kads is adsorption equilibrium constant, C is the concentration of the inhibitor in (g/L).
The calculated values of Kads were used to evaluate the standard Gibbs energy of adsorption ΔG°ads using the equation:
![]()
Where 1000 is the molar concentration of water in (g/L) (15), T is the absolute temperature and R is gas constant. The other thermodynamic of adsorption ∆Hads and ∆Sads where calculated using well known equation:
![]()
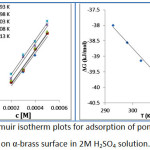 |
Figure 7: Langmuir isotherm plots for adsorption of pomegranate peel on α-brass surface in 2M H2SO4 solution. |
Table 5: Inhibition efficiencies and surface coverages of Pomegranate Peel extract at various concentration with temperature range (293-313)K in H2SO4 medium.
| Inh | T | 200 ppm | 300 ppm | 400 ppm | 500 ppm | ||||
| (K) | IE% | θ | IE% | θ | IE% | θ | IE% | θ | |
| Pomegranate Peel Extract | 293 | 61.35 | 0.6135 | 80.23 | 0.8023 | 89.34 | 0.8934 | 91.86 | 0.9186 |
| 298 | 60.65 | 0.6065 | 78.43 | 0.7843 | 85.79 | 0.8579 | 91.58 | 0.9158 | |
| 303 | 59.53 | 0.5953 | 77.82 | 0.7782 | 83.65 | 0.8365 | 90.64 | 0.9064 | |
| 308 | 57.93 | 0.5793 | 67.9 | 0.679 | 81.7 | 0.817 | 85.92 | 0.8592 | |
| 313 | 54.82 | 0.5482 | 66.66 | 0.6666 | 79.5 | 0.795 | 83.63 | 0.8363 | |
Table 6: Thermodynamic parameters for adsorption of pomegranate peel extract on α-brass surface in 2M H2SO4 solution.
|
Inh. |
T (K) |
Kads (g-1.L) |
-ΔGads (kJ.mol-1) |
-ΔHads (kJ.mol-1) |
ΔSads (J.K-1.mol-1) |
|
Pomegranate Peel Extract |
293 |
5952.381 |
37.999 |
9.619 |
97.1 |
|
298 |
5747.126 |
38.561 |
|||
|
303 |
5586.592 |
39.137 |
|||
|
308 |
5025.126 |
39.511 |
|||
|
313 |
4651.163 |
39.951 |
The negative sign of ΔGads indicates the spontaneous process of formation of protective film on the metal surface. It’s known that values of ΔGads Lower than -20 kJ/mol (in minus) indicate the adsorption process occurred via physisorption an electrostatic interaction occurred by adsorbed of polarizable species and it’s decreased with increasing temperature. And if ΔGads values are -40 kJ/mol (in minus) or higher suggest the adsorption process occurred via chemisorption mechanism that involves strong interaction via the electron density found on the hetero atom and resulted of formation of coordinate bond. Chemisorption is increased with increasing temperature. The calculate values of ΔGads were found to be in minus at the range of (39.95-37.99) kJ/mol which indicate the adsorption of pomegranate peel occurred via both (Chemisorption & physisorption) (17). The negative sign of the enthalpy indicates the exothermic process of the adsorption of the inhibitor molecules. The positive sign of the entropy gives the indication of the increase the randomness of the adsorption process this may be attributed to the Inhibitor molecules replace the water molecules at the surface which leads to increase the randomness of the solution (16).
Scanning Electron Microscope
The surface morphology of α-brass were examined using SEM. Fig 5 shows the optical micrographs of α-brass shows the alloy attacked by the aggressive solution after immersion 24h the surface appeared to be rough due to the aggresivity of the environment. The inhibited system shows the adsorbed molecules and confirms of formation of protective film.
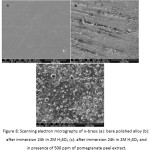 |
Figure 8: Scanning electron micrographs of α-brass (a): bare polished alloy (b): after immersion 24h in 2M H2SO4 (c): after immersion 24h in 2M H2SO4 and in presence of 500 ppm of pomegranate peel extract. |
References
- Rani, B. E.; Basu, B. B. International Journal of Corrosion. 2012, 1-15.
CrossRef - Refaey, S. A.; Abd El Malak, A. M.; Taha, F.; Abdel-Fatah, H. T. Int. J. Electrochem. Sci. 2008, 3, 167-176.
- Dadgarinezhad, A.; Baghaei, F. G. U. Journal of Science. 2010, 23, 287-293.
- Buchweishaija, J. Tanz. J. Sci. 2009, 35, 1-16.
- Agarwal, K. Journal of Materials Science & Surface Engineering. 2014, 1, 44-48.
- Bashraheiil, B. O.; Al-ahmary, J. A.; Al-zahrani, N. A. Journal of King Abdulaziz University. 2011, 1-42.
- Ghaidaa, J. M.; Al-Jassani, M. J.; Hameed, I. H. International Journal of Pharmacognosy and Phytochemical Research. 2016, 8, 480-494.
- Hijazi, K. M.; Abdel-Gaber, A. M.; Younes, G. O. Int. J. Electrochem. Sci. 2015, 10, 4366-4380.
- Ashassi-Sorkhabi, H.; Mirzaee, S.; Rostamikia, T.; Bagheri, R. International Journal of Corrosion. 2015, 1-6.
CrossRef - Abd-El-Nabey, B. A.; Abdel-Gaber, A. M.; Khamis, E.; Morgaan, A. I.; Ali, N. M. Int. J. Electrochem. Sci. 2012, 8, 11301-11326.
- Ismail, A.; Tajuddin, M. A. International Conference on X-Rays & Related Techniques in Research & Industry. 2014, 109-110.
- Ramdé, T.; Rossi, S.; Bonou, L. Int. J. Electrochem. Sci. 2016, 11, 6819-6829.
CrossRef - Fontana, M. G. Corrosion Engineering, McGraw-Hill Book Company. 1987, 246.
- Mohammed, A. B.; Salman, T. A. Int. j. Pharm. Sci. Rev. Res. 2016, 40, 182-190.
- Savita; Chaubey, N.; Mourya, P.; Singh, V. K.; Singh, M. M. IJIRSET. 2015, 4, 4545-4553.
- Hameed, S. T.; Salman, T. A.; Al-Saidi, S. F. Journal of Al-Nahrain University. 2015, 18, 50-61.
CrossRef - Fouda, A. S.; Elewady, Y. A.; Abd El-Aziz, H. K.; Ahmed, A. M. Int. J. Electrochem. Sci. 2012, 7, 10456-10475.

This work is licensed under a Creative Commons Attribution 4.0 International License.


