Rheological and Infrared Spectroscopic Investigations of Normal and Chronic Kidney Disease Urine
Syed Ismail Ahmad1,5*, Siddiq Ahmed2 , Iizhar Ahmed Syed3, Shakeel Ahmed Ansari4 and Adeel Ahmad5
1Basic Science Dept, Physics Div. Ibn Sina National College, Jeddah 21418, Kingdom of Saudi Arabia.
2Department of Conservative Dentistry and Endodontics. Ibn Sina National College, Jeddah 21418, Kingdom of Saudi Arabia.
3Pharmaceutics Dept, Ibn Sina National College, Jeddah 21418, Kingdom of Saudi Arabia.
4Center of Excellence in Genomic Medicine and Research (CEGMR), King Abdul Aziz University, Jeddah 21589. Kingdom of Saudi Arabia.
5Bio Physics Unit, Physics Department, Nizam College (Autonomous) Osmania University, Hyderabad, T S. India.
Corresponding Author E-mail:dr.syedismailahmad@gmail.com
DOI : http://dx.doi.org/10.13005/ojc/320316
Article Received on : May 27, 2016
Article Accepted on : June 20, 2016
The objective of the study is to examine the physical properties of urine of healthy donors and Chronic Kidney Disease (CKD) patients for possible early detection of proteinuria. Specific gravity, viscosity, surface tension, refractive index, electrical conductivity and IR spectroscopy of urine were studied. First morning urine and random urine samples were collected from healthy male donors and were considered as controls to compare with CKD patients. Urine from healthy donors treated with albumin also used in the study. The decrease in surface tension of CKD urines was observed due to high albumin excretion and increased blood urea nitrogen. Fourier Transform Infrared (FTIR) spectra in the mid IR region were recorded for normal and albumin treated urine. It observed that peaks at 1641 cm-1 and 1450 cm-1 in IR spectra are the most specific peaks for urea and albumin, respectively. This method of detecting proteinuria is quick and cheaper, and is an alternate to eGFR.
KEYWORDS:CKD; Urine specific gravity; FTIR; Viscosity; Surface tension; electrical conductivity
Download this article as:| Copy the following to cite this article: Ahmad S. I, Ahmed S, Syed I. A, Ansari S. A, Ahmad A. Rheological and Infrared Spectroscopic Investigations of Normal and Chronic Kidney Disease Urine. Orient J Chem 2016;32(3). |
| Copy the following to cite this URL: Ahmad S. I, Ahmed S, Syed I. A, Ansari S. A, Ahmad A. Rheological and Infrared Spectroscopic Investigations of Normal and Chronic Kidney Disease Urine. Orient J Chem 2016;32(3). Available from: http://www.orientjchem.org/?p=17925 |
Introduction
The Chronic kidney disease (CKD) can be detected by the estimation of urine albumin to creatinine ratio (UACR) and urine urea in urine. An elevated Urine Albumin Excretion is a sign of renal function loss in a non-diabetic population. UACR in random urines accurately predicts 24h protein and albumin loss in patients with kidney disease [1]. In physiological conditions like glucosuria, haematuria, CKD, bladder cancer, urinary tract infections the physical properties such as Urine specific gravity (USG), Viscosity (η), pH, surface tension(γ) of biological fluids like blood and urine may be different from their normal values. The USG and γ are important parameter in pathology and has been studied extensively by many researchers [2]. Many lyophilic systems show a minimum value of γ at the isoelectric point and show a maximum rate of surface adsorption at this pH. This relationship may be used to identify the major proteins present in the fluid from an ovarian cyst. The change in γ is responsible for bubble formation in urine, which can be attributed to kidney disease and changes in Physiological condition of body [3]. The γ of urine and effect of bile salts, protein, and temperature and storage time has been investigated [4]. Physical properties of pathological human urine of patients suffering from gallbladder stones and kidney stones along with healthy individuals studied, the density and EC decreases with oxalic acid in urine. The viscosity and conductivity of urine will have an effect of temperature during hyperthermia treatment; the protenuria affects the urine viscosity [5]. The urine EC depends largely on total dissolved solids in urine, puss cells, RBCs and crystals present in the urine [6].
The advances in instrumentation have paved the way for Fourier Transform Infrared (FT-IR) spectroscopy to be used as a powerful tool to characterize compounds, structure conformation of molecules like proteins, nucleic acids and lipids in science. This technique is based on the fact that, in every system each molecule has its own specific vibrational and rotational spectral pattern called spectral fingerprint, low energy photons with wavelengths from about 2 to 60μm (4000 to 400cm−1) are used to excite the vibrational motion of covalently bonded molecules. Emphasize has been given to analyze biological samples with this technique [7]. Proteins being the major cellular constituent, exhibits the most prominent spectral features in cells and tissues. Although proteins in the cells exhibit almost similar vibrational spectra because of their overall structural and atomic similarities, it is possible to differentiate various proteins, and determine information such as degree of protein secondary structure, hydration and other features from the infrared spectra [8]. A FT-IR spectra of cells found in human urine has been recorded to develop a method for bladder cancer screening. The spectral pattern reveals distinct spectral classes which are correlated with visual cytology. The spectral analysis of individual cell can aid cytology in giving reliable diagnosis based on objective measurement and discriminant algorithms [9]. A variety of new IR techniques for the analysis of tissues and body fluids both in vitro and in vivo have been developed. The methodology comprises of instrumental interpretation aimed to optimize the measurements and their conversion to bio-diagnostics [10]. The IR spectra of normal and diseased Urine from cancerous bladder has been recorded and widely studied for glucose, lipids and proteins [11]. Hence, in the present study, an attempt was made to systematically analyze the physical properties of normal and CKD patient’s urine. FTIR spectroscopy was applied to find the most specific peak for albumin in the mid IR region to find traces of albumin in urine.
Materials and Methods
The normal control Urine samples were collected from healthy male adult donors in the age group of 50-65years. The healthy normal First morning urine (FMU) and randomly collected urines (RCU) have been collected in clean glass container and kept in a water bath at temperature 37o C without any preservents and care has been taken that the analysis is to be completed around one hour of collection. These specimens were collected only from male donors to avoid possible contamination from vaginal or perineal squamous epithelial cells [4].The Chronic kidney disease (CKD) urine was collected from CKD patients at Kidney and Laparoscopic Center, India. All the patients were made aware of the studies and given their consent to use data and urine samples for these studies. The study protocol was approved by the institutional and local ethics committee in accordance with Helsinki declaration, Finland, (amendment) WMA general assembly meeting Korea, (2008). All the patients signed the consent form. The normal urine sample treated with albumin were prepared by making a stock solution by adding 0.5g of albumin to 50mL normal urine as 1000 mg/dL and subsequently diluting it with urine to get 500 mg/dL, 250 mg/dL.125 mg/dL and 62.5 mg/dL.
The specific gravity (also known as relative density) is the ratio of density of solution to that of reference liquid water. The Urine Specific Gravity (USG) was measured by a specific gravity bottle. The refractive index (RI) of the samples was found with Abbe’s refractometer using sodium vapor lamp. The surface tension (γ) and viscosity (η) the samples are measured by simple cost effective capillary rise method and Brookfield viscometer. The electrical conductivity (EC) of the samples was measured with Elico CM 183 a microprocessor-based conductivity meter with cell constant 1. The accuracy of conductivity meter is 1%.
The Fourier Transform Infrared (FT-IR) spectra of a normal urine and urine treated with albumin were recorded with Thermo Nicolet Nexus 670 FTIR spectrometer in mid IR region. The sample is filled in a liquid cell of 1mm thickness with a micro syringe. For water- soluble proteins, like albumin samples are best analyzed as adequately buffered aqueous solutions (in H2O) rather than solids or hydrated film. The resolution was kept at 4 cm-1 and scanning time was 38 sec. In our previous studies we have analyzed the urine treated with urea by this method.
Statistical analysis
The data was analyzed using Statistical Package for the Social Sciences (SPSS) version 19. The results were stated as mean ± standard deviation. The normal FMU, RCU samples were subjected to the paired t-test for comparison of categorical variable USG, Surface tension and Viscosity and independent t-test performed for FMU and CKD samples by null hypothesis. Significance was detected at P< 0.05.
Results and Discussion
In CKD either kidney damages or GFR is less than 60 mL/min/1.7 m2 for three months or more irrespective of case, and low urea and abnormal high value albumin excretion in which the ratio of urine albumin to creatinine ratio (UACR) is greater than 30 mg/g. In this study the average values of physical properties such as USG, η, RI, γ and EC of CKD urine have been compared with that of normal healthy urine. The average values of physical properties, UU (urine urea), UA (urine albumin), UC (urine creatinine), USG, R I, γ , η, E C and UACR ( urine albumin to creatinine ration) of 44 samples for first morning urine and mid-stream urine randomly collected urine and 20 samples of CKD urine is reported in Table 1. The data reveals that first morning urine (FMU) samples is the most concentrated when compared to randomly collected urine (RCU), there is a decrease in USG, η, RI, γ and EC. The statistical data reveals that there is a significantly difference parameters with (P<0.001), between the FMU and RCU samples. The physical properties such as USG, pH, η, γ are sex independent. The USG is a measure of constituents of urine which depends on metabolic condition of the body. The dipstick test gives abnormal in many cases, it does not gives the exact values of USG, as it is sensitive only to ionic composition, where pH, protein and glucose have no effect on it [12]. Since the specific gravity of urine is an additive property of its constituents, up to 85 percent of USG from normal subjects can be accounted for urea, chloride, phosphate, sulfate, and creatinine. Of these, urea contributes up to 35 percent, chloride and phosphate up to 40 percent and creatinine up to 10 percent. The major single constituent of urine is urea which forms due to protein breakdown.
Table 1 : Average values of Physical properties of healthy normal first morning urine (FMU), randomly collected urine (RCU) and CKD urines.
|
Condition |
UU (mg/dL) | UA (mg/dL) | UC (mg/dL) |
USG |
R I |
γ (dyne/cm) |
η (cp) |
E C (mS/cm) |
UACR
(g/mg) |
| F M U | 1200 – 1500 | 0 – 7 | 80 – 100 | 1.022±0.004 | 1.336 ± 0.002 | 65.86 ± 2.18 | 1.057 ± 0.0002 | 15.06 ± 6.01 | < 30 |
| R C U | 1.014 ± 0.005 | 1.335 ± 0.001 | 66.73 ± 2.12 | 1.043 ± 0.0002 | 11.55 ± 4.99 | ||||
| CKD Urine | 1044.35±15.37 | 74.20±11.75 | 29.42±5.44 | 1.008±0.001 | 1.333±0.0001 | 55.67±1.82 | 1.076±0.001 | 11.19±0.91 | 2626.7±25.02 |
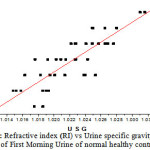 |
Figure 1: Refractive index (RI) vs Urine specific gravity (USG)of First Morning Urine of normal healthy controls |
Figure 1 shows the relationship between RI and USG, RI varies linearly with USG in both FMU and RCU (r = 0.952, P < 0.001). It is observed that the refractive index is proportional to total dissolved solids. The refractometry can be used to measure total urinary solids and can be an alternate to urine hydrometry and dip stick test to measure USG. The average USG in case of CKD (1.008±0.001) is low compared to that of normal FMU (1.022±0.004), and is significantly different (P<0.001). The FMU from four healthy donors are treated with albumin at concentrations 62.5mg/dL,125mg/dL,250 mg/dL,500 mg/dL and 1000 mg/dL, the average values of the physical properties are reported in Table 2. The mean values of USG and RI at concentration of 62.5mg/dL of albumin is 1.023 ± 0.004 and 1.335±0.002, is not significantly different (P >0.05) from its untreated normal value. In this study, it is found that there is an increase of 0.003 in USG per every gram (1 percent) of solute added and the corresponding increase in refractive index is 0.0012. USG in normal subjects is due to excretion of large amount of urea. The USG increases when the rate of urea excretion is approximately double by administration of urea with intake of high protein diet [13]. This clearly indicates that the major constituent of USG is urea and the decrease of USG in case of CKD is not due to excretion of albumin but due to low amount of urea excretion through urine.
Table 2: Average values of physical properties normal urine of four different subjects treated with of albumin.
| Albumin Concentration | USG | R I | γ (dyne/cm) | η (cp) | EC (mS/cm) | pH |
| 0 mg/dL | 1.023 ±0.004 | 1.335±0.002 | 66.2±1.05 | 1.052±0.001 | 19.82±8.57 | 5.89±0.15 |
| 62.5 mg/dL | 1.023 ±0.002 | 1.335±0.002 | 60.57±2.10 | 1.061±0.002 | 19.89±8.45 | 5.92±0.19 |
| 125 mg/dL | 1.023±0.004 | 1.335±0.002 | 55.24±1.93 | 1.07±0.001 | 19.86±9.26 | 5.9±0.14 |
| 250 mg/dL | 1.024±0.002 | 1.336±0.002 | 52.98±1.01 | 1.084±0.001 | 19.93±8.35 | 5.92±0.2 |
| 500 mg/dL | 1.025±0.001 | 1.336±0.002 | 47.21±1.11 | 1.092±0.002 | 19.82±8.41 | 5.92±0.16 |
| 1000 mg/dL | 1.024±0.002 | 1.337±0.002 | 42.47±1.37 | 1.11±0.002 | 19.85±8.41 | 5.91±0.14 |
The changes in the surface tension (γ) of biological liquids are due to migration of its Lyophobic and Lyophilic surfactants. In the present study it is observed that the FMU has a higher value of γ compared to RCU. The CKD and albumin treated urines were foamy and had large number of bubbles, the γ was determined by removing the foam and bubbles around the capillary tube three minutes after it is placed in the sample. The average value of γ of CKD samples was 55.67±1.82 dyne/cm and that of normal healthy samples is 65.84±2.25 dynes/cm and is significantly different (P<0.001). Hippocrates suggested that the bubbles in urine are associated with kidney malfunction. Changes in γ are responsible for foam and bubbles in urine. The γ is more accurate and continuous predictor of protenuria. γ of biological liquid may depend on age and sex, but more under some physiological conditions such as menstrual period and various diseases [3]. In this study it is observed that excretion of large amount of albumin through urine lowers the γ of CKD urine. The surface tensiometry can be used in pathology as it provide additional useful information in medical practice.
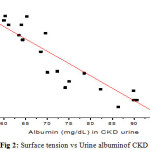 |
Figure 2: Surface tension vs Urine albuminof CKD urine Click here to View Figure |
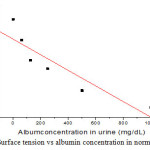 |
Figure 3: Surface tension vs albumin concentration in normal urine |
The figure 2 and 3 shows that γ of CKD urine and urine treated with albumin. It is observed that the surface tension(γ )decreases with the albumin concentration. In case of CKD the average value of UACR of 30 CKD patients is 2626.7±725.62 mg/g, which is higher than normal value of around 30mg/g. It has also been found that, the urine urea and urine creatinine in CKD are very low, when compared to FMU. The decreased value of γ can be attributed to the shape of albumin protein molecule. The albumin protein molecules are ellipsoidal in shape they need time to develop an orientation at air-water interface, a process that results in surface tension. At higher concentrations of albumin in urine, the molecules have more difficulty in re-orienting to the surface of urine due to greater electrostatic repulsion. As shown in figure 4, the γ decreases linearly with increasing UACR (r = 0.82). The decreased γ and USG is an accurate, quick and cheaper method of finding the kidney disease, where there is low glomerulus filtration rate and high UACR [1,2].
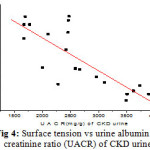 |
Figure 4: Surface tension vs urine albumin to creatinine ratio (UACR) of CKD urine |
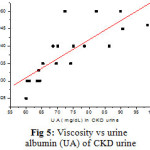 |
Figure 5: Viscosity vs urine albumin (UA) of CKD urine |
The Figure 5 shows the relationship between η and urine albumin of CKD urine, η increases linearly (r = 0.82) with increasing value of albumin. The average value of η at 37 oC of 44 healthy urine is 1.057±0.002 cp and that of 30 CKD patients is 1.076±0.001cpwas found statistically different (P<0.05) also η of urine treated with albumin increases with concentration. The increase of η in CKD is due to presence of excess albumin. In the present study it is observed that the FMU shows higher EC compared to RCU. The EC of normal healthy urine ranges from 4.4 mS/cm to 34 mS/cm with an average value of 15.06±6.01mS/cm. The EC of urine is mainly due to its inorganic constituents and mobility of ions. In case of CKD where the patients urinate almost once in a weak, the average value of EC is 11.19±0.91mS/cm with a small variation among them, probably due to low excretion of ions, urea, creatinine and large BUN. The decrease in the EC of CKD urines is due to low USG and total dissolved solids and may be correlated with RBC, calcium oxalate monohydrate crystals, puss cells and uric acid. High values of specific gravity and total dissolved solids urines have large electrical conductivity [14].
The FT-IR spectra is a signature or finger print of molecular species of the sample. The absorption positions of peak at wave numbers reveals the qualitative characteristics of chemical bonds and structure of the molecule, while the intensities of absorptions provide quantitative information of the sample [15]. The present study is aimed to find the most specific peak for albumin in human urine.
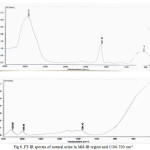 |
Figure 6: FT-IR spectra of normal urine in Mid-IR region and 1500-700 cm-1 |
The fig 6 shows FT-IR spectra of normal healthy urine in mid IR region 4000-700cm-1 and 1500-700 cm-1 and wave number assigned is shown in table 3.
Table 3: Wave numbers and assigned functional groups for normal urine
|
Wave number (cm-1) |
Compound or functional group assignment |
|
3461 |
H2O or N-H n(N-H) |
|
1641 |
Amide I. the C=N stretching absorption for open chain compound, helical structure –NH2. |
|
591 |
Strong C-H deformation , alkines |
|
1458 |
CH2, CH3 bending modes. n(N=O) symmetrical deformation. |
|
1084 |
Very Weak, Sugar ring vibration |
|
1399 |
Lactate, carboxylic acids and derivatives. |
The IR spectra of normal healthy urine treated with albumin at concentrations of 62.5 mg/dL, 125 mg/dL 250 mg/dL, 500 mg/dL and 1000 mg/dL is shown in fig 7.The analysis of spectra reveals that the absorption peaks at 3472cm-1 are due to water, as the overall spectra is dominated by water, intermolecular strong, sharp O-H stretching free hydroxyl group. 3457cm-1 is strong N-H stretching vibrations in Amide A, is mainly due to break down of protein [15, 16,17].
Table 4: Wave numbers and assigned functional groups for urine added with Albumin.
|
Wave number (cm-1) |
Compound or functional group assignment |
|
3450 – 3472 |
H2O or N-H n(N-H) |
|
1640 – 1660
|
Amide I. the C=N stretching absorption for open chain compound, helical structure –NH2, due to urea. |
|
1450 – 1470
|
CH2, CH3 bending modes. n(N=O) symmetrical deformation. |
|
1400
|
CH2, CH3 bending modes of lipids. C=O symmetric stretching vibration of COO–. |
|
1160 |
C – O stretching of protein, glycogen and C-C of carbohydrates |
|
553 |
S –S disulphide |
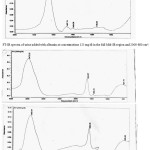 |
Figure 7: FT-IR spectra in Mid IR region for urine added with Albumin at concentrations 250, 500, 1000 mg/dl. Click here to View Figure |
The Amide I generally occurs around wave number 1640cm-1 , mainly due to C=O stretching vibration and a minor contribution due to C-N stretching vibration. The protein amide C=O group are not involved in hydrogen bonds, it is either due to solvent or with N-H group [10]. Since the samples are hydrated, due to influence of hydroxyl bending and stretching vibrations the peaks have shifted to higher wave numbers. The peaks at 1657cm-1 can be attributed to urea can be assigned to N-H bending vibrations. The Amide III absorption is a complex band, there exist a mixing with CH2 wagging and CH3 bending vibrations. The wave numbers 900 – 1500 cm-1 can be assigned to protein [14], and these bands are due to C-C stretching and C=O in plane bending [11]. Usually the C-C stretch vibrations will vary in 1430-1625 cm-1 [18].
Table 5: Intensity of peak 1463cm-1at different concentration of albumin
| Albumin concentration |
Absorption Intensity of 1463cm-1 |
|
Normal urine |
0.0072 |
|
125 mg/dL |
0.0192 |
|
250 mg/dL |
0.0235 |
|
500 mg/dL |
0.0289 |
|
1000 mg/dL |
0.0487 |
Table 5 represents the intensity of peak 1463cm-1at different concentration of albumin. In present spectra the peaks 1455 -1465cm-1 are owning to medium C-H asymmetric deform vibrations of CH2 and CH3 fragments. The albumin has a dipole structure of CH2.The intensity of absorption band at 1463cm-1 increases with increasing concentration of albumin in urine figure 8. The peak at 1463cm-1 is assigned to turn structure [16], can be considered as the most specific peak for albumin in urine. The decrease of surface tension in CKD urine can be assigned to ellipsoidal dipole structure of albumin present in CKD urine. The 1399 and 1404cm-1 represents CH2 and CH3 bending modes of lipids, C=O symmetric stretching vibration of COO–. It is due to weak in-plane deformation vibrations. 1160cm-1 is due to strong O-H deformation and C-O stretching vibrotonic interaction of protein, glycogen and C-C of carbohydrates. The peak at 1084cm-1 represents medium C-H symmetrical deformation vibration due to lipids and sugars in ring form.
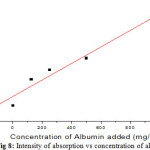 |
Figure 8: Intensity of absorption vs concentration of albumin |
Conclusion
The FMU is concentrated of the day. RI varies linearly with USG; refractometry can be used as alternate to hydrometry. The low value of USG and RI of CKD urine is due to low urea excretion. CKD urine has decreased γ and increased η compared to that of normal urine, which can be due to large albumin in urine. The decreased in γ is attributed to ellipsoidal shaped polar albumin molecules. EC of CKD urine is lower than that of healthy control, which could be due to low excretion of ions, urea, creatinine and large BUN. FTIR peak for urea is are 3457cm-1 and 1657cm-1, the traces of albumin can be found by 1463cm-1peak. These physical properties and methods can be applied for the early detection of CKD. However further research has to be done to quantify the exact amount of albumin in urine.
Authors’ contribution
Authors SIA and AA had conceptualized the idea of study and its design. IAS, SA and SAA contributed in data acquisition, data analysis and data interpretations.
Conflict of interest
The authors have no conflict of interest to declare.
Compliance with Ethics Requirements
This article does not contain any studies with human or animal subjects.
Acknowledgement
The authors would like to acknowledge the support extended by Hyderabad Diagnostics and Kidney Centre, Hyderabad, India for their constant support during the studies. The authors would like to thank Principal, Nizam College (Autonomous) Osmania University, Hyderabad for providing lab facility.
References
- Guy , M; Borzomato, J.K.; Newall, R.G.; Kalra, P.A.; Price, C. P. Ann ClinBiochem. 2009, 46, 468-476. DOI: 10.1258/acb.2009.009001
CrossRef - Akarsu, E.; Buyukhatipoglu, H.; ktaran, S.A.; RamazanGeyik,R. J Gen Intern Med. 2006, 21, C1-C2. DOI: 10.1111/j.1525-1497.2006.00454.x.
CrossRef - Fathi-Azarbayjani, A. ;Jouyban ,A. Bioimpacts. 2015; 5(1): 29-44DOI: 10.15171/bi.2015.06
CrossRef - Mills, C.O.; E Elias, Martin G.H.B.; Woo, W.T.C.; Winder, A.F. J Clin.Chem. ClinBiochem.1998; 26: 187-194
- Inman,B.A.; Etienne,W.; Rubin, R.; Owusu, R.A.; Oliveira, T.R.; Rodriques, D.B.; Macacarini, P.F.; Stauffer,P.R.; Mashal,A.; Dewhirst, M.W. Intl. J. hyperth.2013, 29, 206-210 DOI: 10.3109/02656736.2013.775355.
CrossRef - FazilMarickar, Y.M. . Urol Res. 2010; 38: 233-235 DOI: 10.1007/s00240-009-0228-y.
CrossRef - Stuart, B. Infrared Spectroscopy. Kirk-Othmer Encyclopedia of Chemical Technology.2005. John-Wiley. DOI: 10.1002/0471238961.0914061810151405.a01. pub2
CrossRef - Surewicz, W. K. M. Infrared Absorption Methods for Examining Protein Secondary Structure, Determination of Protein Structure in Solution by Spectroscopic Methods. 8th ed. Willey; New York; 1994
- Benjamin, B.; Romeo, M.J.; Diem,M.; Bedrossian, K.;Laver, N.; Naber. S.Vib. Spectrosc.2008; 48, 101 – 106. DOI: 10.1016/j.vibspec.2008.03.006
CrossRef - Jilie, K .; Shaoning, Y.U. ActaBiochimica et BiophysicaSinicaI, 2007, 39(8): 549–559
- Do-Hyun, K.; Ilev, I. K.; Jin U.K.J.Laser and Electro-optics Soc. (LEOS), 2007. 20th Annual meeting of IEEE 2007, 226-227
- Abdullah, A.A.; Azza, A. T.; Awatif, E. E.; Ali, N. E.; Azza, H.A. Saudi Med J. 2014; 35, 1477-1481
- Michael, B.; Lasch ,P.; Naumann, D. Vet. Microbiology.2007, 123 (4) 305-319.
CrossRef - Andreas, B. BiochimicaetBiophysicaActa. 2007, 1073–1101
- Ahmad, S.I.; Iizhar,A. S.; Prasad, R. P.; Ahmad, A. Der Pharma Chemica. 2014; 6(1):90-96
- Muhizi, T. Oriental J. Chem. 2014, 30 (2), 643-649
- Meersman,F.; Smeller,L.; Heresman,K. Biophys J. 2002; 82, 2635-2644
CrossRef - Soleymani, R.; Salehi, Y.M.; Yousofzad, T.; Cheshmeh Ali, M.K. Oriental J. Chem. 2012, 28 (2), 627-638

This work is licensed under a Creative Commons Attribution 4.0 International License.


