Assessment of Aspartame Exposure Due to Consumption of Some Imported Chewing Gums by Microwave Digestion and High Performance Liquid Chromatography Analysis
Zohreh Rasouli1 and Behrouz Akbari-Adergani2*
1Department of Food Science and Technology, Faculty of Advanced Sciences and Technology Pharmaceutical Sciences Branch, Islamic Azad University, Tehran, Iran.
2Food and Drug Laboratory Research Center, Food and Drug Organization, Ministry of Health and Medical Education, Tehran, Iran.
Corresponding Author E-mail: analystchemist@yahoo.com
DOI : http://dx.doi.org/10.13005/ojc/320342
Article Received on : April 18, 2016
Article Accepted on : May 29, 2016
Aspartame is a widely used artificial sweetener, the long-term safety of which has been controversial ever since it was accepted for human consumption. The main aim of this research is assessment of aspartame exposure due to consumption of some imported chewing gums during summer 2015 to Iran by microwave digestion and HPLC analysis. Thirty chewing gums from highly consumed imported ones were collected from retail market in Tehran. Closed vessel microwave digestion was employed for sample preparation using a three phase temperature program. An aliquot of 20 μL of prepared samples was injected into the HPLC column and the aspartame was detected at 254 nm with an on-line detector. Concentration of aspartame in chewing gum samples was between 1.9 and 30.5 μg/g with an average of 11.1 μg/g. In conclusion, despite of existing aspartame in 76.6 percent of samples, however the effective amount of this artificial sweetener is not as high as the levels that international legislations recommended for exposing due to chewing gum consumption.
KEYWORDS:Aspartame; Artificial sweeteners; Chewing gum; Microwave digestion
Download this article as:| Copy the following to cite this article: Rasouli Z, Akbari-Adergani B. Assessment of Aspartame Exposure Due to Consumption of Some Imported Chewing Gums by Microwave Digestion and High Performance Liquid Chromatography Analysis. Orient J Chem 2016;32(3). |
| Copy the following to cite this URL: Rasouli Z, Akbari-Adergani B. Assessment of Aspartame Exposure Due to Consumption of Some Imported Chewing Gums by Microwave Digestion and High Performance Liquid Chromatography Analysis. Orient J Chem 2016;32(3). Available from: http://www.orientjchem.org/?p=18172 |
Introduction
The chemistry science along with food industry had a positive effect on producing and developing artificial sweeteners that are used as substitutes for the sugar1.Artificial sweeteners are widely used in food, beverage, dietary products, confectionery and pharmaceutical industry all over the world2, 3. These additives refer to the people who want or need to reduce caloric intake, obesity and tooth decay so, they are recommended for patients with diabetes who are restricted in sugar consumption1-4. Aspartame is currently considered as safe artificial sweetener and now is the most popular sweetener in more than 75 countries that may be used separately or in combination with other sweeteners2. This sweetener is a low dipeptide, low aspartile, low phenylalanine methyester3, 5 that its sweetness accidently discovered in 1965 by James M. Schlatter 5. Aspartame is composed of phenylalanine, aspartic acid plus a small amount of methanol6. Since phenylalanine can be neurotoxin and can influence on the neurotransmitters synthesis of inhibitory monoamine so, phenylalanine in aspartame can cause neurological side effects. Several clinical studies have shown that excessive intake of aspartame can cause headaches, migraines and memory lose3. Despite numerous trials that are done to evaluate the risks of food additives on animals however, the safety of aspartame consumption still remains controversial1. Aspartame is 200 times sweeter than sucrose. Now aspartame is used in more than 6000 different products such as non-alcoholic drinks, desserts, icy yogurt, chewable multivitamins, cereals, desktop sweeteners, medicine, etc and millions of people around the world used them1, 6. The food and drug administration of America (US-FDA) and the food organization of Europe have set the acceptable daily intake (ADI) of aspartame 50 and 40 milligrams per kilogram of body weight per day respectively 4, 6, 7. The experts of joint committee FAO/WHO in food industry (JECFA) have also set this amount to 40 milligrams per kilogram of body weight6. In Iran there are many attractions for consumption of the imported gums, especially for children and teenagers that show the need for the rigorous and periodic safety controls more than ever. According to the dangers due to exposing to the high doses of aspartame and lack of periodic and continuous control for the chewing gums that are often imported, hence it’s essential to do proper monitoring and evaluation of aspartame from quantity aspect in this instance. Conventional methods for identifying and measuring the aspartame in food industry and chewing gums have numerous weaknesses particularly in the preparation of samples including the loss of the analyte, being costly, time consuming and lack of the necessary sensitivity. The widespread use of microwave to dissolve samples is gradually replaced by the conventional pressure reactors that particularly are suitable for the determination of organic and inorganic analytes8, 9. There were reported some microwave digestion methods which are mainly applied for extraction of minerals from food matrices10-12. Microwave extraction is one of the extraction methods based on the warming in a closed vessel containing oxidizing agents. Its principle is that a sample and its appropriate solvent are placed in a container and then pressured and heated by microwaves. After about 5 to 20 minutes extraction is completed and will be allowed to cool. Then the sample mixture is removed and filtered13, 14. Extracted solution is analyzed in high performance liquid chromatography as a good way to separate, identify and measure the components of the sample8, 9. The main aim of this research is the assessment of aspartame exposure due to the consumption of some imported chewing gums during summer 2015 to Iran by microwave digestion and HPLC analysis.
Experimental
Materials and Methods
Reagents and Chemicals
Aspartame powder with 100% purity was purchased from Sigma-Aldrich (Steinheim, Germany). Acetonitrile, potassium dihydrogen phosphate, methanol, nitric acid and hydrogen peroxide were obtained from Merck, (Darmstadt, Germany).
Equipments and Devices
Microwave digestion system (Milestone , Switzerland Co.), high performance liquid chromatography (Younglin, South Korea), Revese-phase ODS chromatogeraphy column 250*4.6mm, 5 (Teknokroma, Spain) which was set at 25 centigrade degree in a column oven, the micro injection syringe (Hamilton, USA), ultra-pure water system (Younglin Co., Younglin), ultrasonic bath (LIARRE Starsonic 60, Italy) and syringe mico-filter were bought from CNW technologies company, Germany.
Sample collection and preparation
All of the chewing gum samples from highly consumed ten brands with three replicate were randomly collected from different parts of retail markets as the most widely used imported chewing gum brands in Tehran during 2015 summer. All of the samples with appropriate labeling and packaging and without any apparent damage were transferred to the reference food control laboratory and maintained in dry and cool condition until analysis. At first, the moisture content of gum samples was measured according to the official method15. Extracting operations of aspartame from gum samples were performed by microwave digestion method in a Milestone microwave system16. All of the variables involved in this system such as digestion time, digestion temperature and microwave intensity were examined to extract aspartame from chewing gum samples and to achieve maximum recovery. For this, exactly 0.1 gram of each gum sample was inserted into the sealed Teflon containers then placed in a microwave digestion system and the operations were carried out. These containers were well washed with water and detergents before using and then were placed in the nitric acid solution for 24 hours to be free from any contamination. Five milliliter of concentrated nitric acid and two milliliter of hydrogen peroxide is added to the sample and the Teflon vessel is put under the hood until the reaction is completed between the materials. Then the vessels were closed well and placed inside the microwave system.
Figure 1 shows the implementation plan of temperature, pressure and time to digest the chewing gum samples in the microwave digestion system. This figure shows a three phase temperature-pressure program for digestion of gum samples according to the instrument instructions. As can be seen in this diagram, digestion operation is started by pouring the sample and reagents at ambient temperature and atmospheric pressure and reaching to the first step that the temperature is 160 centigrade and the pressure reached to the 50 bar in the vessel. In the second and third steps the temperature of the sample container reached to 170 and 200 centigrade degree respectively in a constant pressure. Then the vessel is cooled and returning to the ambient pressure in the final phase. The total operation of sample digestion was performed in 90 minutes.
At the end of operating program, samples are transferred into 15 ml poly ethylene test tubes and the remaining solution in the vessel was washed with a little distilled water and transferred into the test tube and the obtained solution was diluted up to 10 ml.
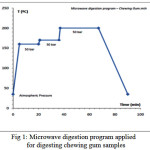 |
Figure 1: Microwave digestion program applied for digesting chewing gum samples |
Preparation of standard solutions
To prepare standard solutions of aspartame, exactly 0.010 gr of aspartame powder was weighed and after dissolving in a beaker was brought to volume inside a volumetric flask. Then working standard solutions were prepared in a 100 ml volumetric flasks by diluting appropriate amount of stock solution by deionized water.
Sample preparation
To prepare a sample solution, the digested sample was brought to volume inside a volumetric flask and poured in a test tube. For removing any suspended particles in sample, appropriate Wattman syringe filters were used and passed prepared samples through it. Then the prepared sample was sonicated in sonication bath for 30 minutes. Finally 5 micro liters of filtered samples individually and respectively were injected into the HPLC system17.
Results
Moisture content
Table1 shows the results of mean moisture content for gum samples. As can be seen in this table, sample code of Me-1 with mean moisture of 0.9900 w/w percent has the lowest moisture and sample code of Ex-1 with 8.0808 w/w percent w/w percent accounted for the most amount of the moisture.
Table 1: The results for the moisture content in chewing gum samples
|
Sample code |
Weight of moisture vessel (g) |
Weight of crucible with sample (g) |
Moisture (w/w%) |
|
|
before drying |
After drying |
|||
|
Tr-1 Viv-1 Viv-2 Fv-1 Fr-1 Or-1 Re-1 Na-1 Me-1 On-1 On-2 Ex-1 |
17.5767 22.5212 20.6008 23.9633 22.0312 19.0506 21.0381 17.8875 23.8203 23.8637 32.5384 23.7410 |
17.6787 22.6292 20.7089 24.0654 22.1325 19.1538 21.1354 17.9892 23.9211 23.9669 32.6433 23.8402 |
17.6768 22.6270 20.7056 24.0623 22.1300 19.1506 21.1322 17.9871 23.9201 23.9638 32.6411 23.8323 |
1.9607 1.8518 2.7777 2.9411 1.9801 2.9126 3.0927 1.9607 0.9900 2.9126 1.9047 8.0808 |
Aspartame analysis
The results of the injection of aspartame standard solutions to HPLC system is presented in Table2. As can be seen in Figure 2 by injecting the standard solution with a concentration of 4 mg/L, a peak with the retention time of 6.600 minutes appeared in a run time of 10 minutes that is related to the aspartame. The chromatograms related to the injection of the aspartame standard solutions led to a linear calibration curve with correlation coefficient of 0.9989 (r2).
Table 2: The calibration curve data obtained from injection of aspartame standard solutions in five levels
|
Area under the curve |
|
Retention time (min) |
|
Concentration of standard solution (mg/L) |
|
— |
— 6.4217 |
0.0 |
||
|
8.3550 |
0.010 |
|||
|
15.7905 |
6.3567 |
0.020 |
||
|
22.6004 |
6.4250 |
0.030 |
||
|
30.2175 |
6.4383 |
0.040 |
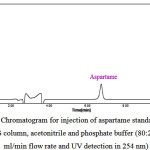 |
Figure 2: A typical HPLC Chromatogram for injection of aspartame standard solution (Condition: 250*4.6mm, 5µm ODS column, acetonitrile and phosphate buffer (80:20) as mobile phase, 1.0 ml/min flow rate and UV detection in 254 nm) |
It can be seen in Figure 3, the extracted solution of gum sample which have aspartame in the list of gum formulations on the sample label. In this HPLC chromatogram there is no peak related to the aspartame and it can be seen that no any peak is observed for a certain period of time according to the retention time of standard peak in Figure 2.
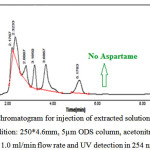 |
Figure 3: A typical HPLC Chromatogram for injection of extracted solution of chewing gum sample with no aspartame (Condition: 250*4.6mm, 5µm ODS column, acetonitrile and phosphate buffer (80:20) as mobile phase, 1.0 ml/min flow rate and UV detection in 254 nm) Click here to View Figure |
Fig 3: A typical HPLC Chromatogram for injection of extracted solution of chewing gum sample with no aspartame (Condition: 250*4.6mm, 5µm ODS column, acetonitrile and phosphate buffer (80:20) as mobile phase, 1.0 ml/min flow rate and UV detection in 254 nm)
In Figure 4, a typical chromatogram related to the injection of extracted solution of gum sample is presented. This analysis is related to the lowest amount of aspartame between all of the studied samples. In this chromatogram the observed peak at 6.3033 minutes is related to the aspartame with the area under the curve of 13.6327.
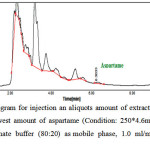 |
Figure 4: HPLC Chromatogram for injection an aliquots amount of extracted solution of chewing gum containing the lowest amount of aspartame (Condition: 250*4.6mm, 5µm ODS column, acetonitrile and phosphate buffer (80:20) as mobile phase, 1.0 ml/min flow rate and UV detection in 254 nm) Click here to View Figure |
Fig 4: HPLC Chromatogram for injection an aliquots amount of extracted solution of chewing gum containing the lowest amount of aspartame (Condition: 250*4.6mm, 5µm ODS column, acetonitrile and phosphate buffer (80:20) as mobile phase, 1.0 ml/min flow rate and UV detection in 254 nm)
In Figure 5, the HPLC chromatogram due to injecting the extractive solution of gum sample with the highest amount of aspartame can be seen. This chromatogram shows a peak with area under the curve of 216.0330 in the retention time of 6.4667 minutes.
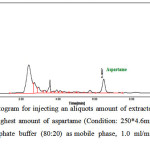 |
Figure 5: HPLC Chromatogram for injecting an aliquots amount of extracted solution of chewing gum containing the highest amount of aspartame (Condition: 250*4.6mm, 5µm ODS column, acetonitrile and phosphate buffer (80:20) as mobile phase, 1.0 ml/min flow rate and UV detection in 254 nm) Click here to View Figure |
Fig 5: HPLC Chromatogram for injecting an aliquots amount of extracted solution of chewing gum containing the highest amount of aspartame (Condition: 250*4.6mm, 5µm ODS column, acetonitrile and phosphate buffer (80:20) as mobile phase, 1.0 ml/min flow rate and UV detection in 254 nm)
Aspartame in chewing gums as a dry weight
Comparing the retention time of peaks of the injection of the gum samples with retention time of peaks of the injection of the standard solutions show that 23 out of 30 studied sample contain aspartame. Also, although the aspartame name was listed on the package label of all samples, 7 samples ad no aspartame peak wasn’t observed during this period. In Table3 the concentration, the humid weight percentage, average and standard deviation of aspartame in different gum brands are presented according to their dried weight unit.
Table 3: The chromatographic results for aspartame in chewing gum samples as a dry weight
|
Sample code |
Moisture (w/w%) |
Aspartame in dry weight (μg/g) |
Mean aspartame in dry weight (μg/g) |
Standard Deviation (μg/g) |
|
Fr-1 Fr-2 Fr-3 |
2.0 |
24.8 29.5 17.1 |
23.8 |
6.3 |
|
Viv-1 Viv-2 Viv-3 |
2.3 |
11.8 12.2 9.0 |
11.0 |
1.7 |
|
Tr-1 Tr-2 Tr-3 |
2.0 |
8.6 1.9 2.2 |
4.2 |
3.8 |
|
Ex-1 Ex-2 Ex-3 |
8.1 |
7.1 6.3 N.D* |
4.5 |
3.9 |
|
Or-1 Or-2 Or-3 |
2.9 |
20.1 N.D* 27.7 |
15.9 |
14.3 |
|
Me-1 Me-2 Me-3 |
1.0 |
5.8 N.D* 3.7 |
3.2 |
2.9 |
|
Na-1 Na-2 Na-3 |
2.0 |
2.0 18.5 10.4 |
10.3 |
8.3 |
|
On-1 On-2 On-3 |
2.9 |
30.5 N.D* 15.6 |
15.4 |
15.3 |
|
Fv-1 Fv-2 Fv-3 |
2.9 |
17.6 26.8 N.D* |
14.8 |
13.6 |
|
Re-1 Re-2 Re-3 |
3.1 |
N.D* 24.8 N.D* |
8.3 |
14.3 |
|
Total mean |
11.1 |
|||
* N.D. = Not Detected
Comparing the mean of aspartame between sample types
In Figure 6, the average aspartame concentration is shown as well as their standard deviation in the studied gum samples. As can be seen in this figure the highest average of aspartame refers to the (Fr) brand and its amount is 23.3 and the least average belongs to (Me) brand that equals to 3.1, also the highest standard deviation belongs to (Re) brand that equals to 13.9 and the least average belongs to (Viv) brand that equals to 1.7.
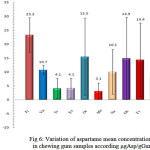 |
Figure 6: Variation of aspartame mean concentrations in chewing gum samples according μgAsp/gGum |
Conclusion
During recent years, the use of imported chewing gums has dramatically increased among teenagers and young adults. In comparison with sucrose, the higher sweetness of aspartame cause that people prefer it among gum samples. Nowadays the artificial sweetener is used in more than 6000 different food products and the high consumption of these sweeteners may lead fears in terms of health regulations. Using a new combination method for the extraction of aspartame from chewing gum and its analysis by HPLC method in such a complex matrix following their monitoring, collecting the various samples from imported brands and recording the amount of artificial sweeteners in the form of a coherent set and presentable way to policy makers and health references are new indices of this research. According to the obtained results, some samples contained aspartame under the approved standards in the level of national and international standards and some other had no aspartame despite the existence of aspartame in gum formulation listed on the label instance. The aspartame concentration evaluated in the samples and it is revealed that their amounts are comparable with the national regulations and recommended values for daily intake of aspartame. The average amount of aspartame in the chewing gum samples revealed that it is compatible with the local criteria in terms of national standards and international FAO/WHO, FDA and EU regulations.
The limits set out in Table 5 show that the obtained mean concentration for aspartame in the samples was much less than the specified limits in the national and international levels. While in the investigation that was conducted on 30 samples of gum, a larger amount than the average of 0.0305 mg/kg was also observed, however this amount is much less than the specified limits that in comparison with the limits of daily intake of aspartame on the basis of the FAO/WHO and FDA organizations the consumer by using only one gram of chewing gum would respectively receive 0.07625 and 0.005 percentage of lawful limit of this artificial sweetener use. As can be seen in this table, mean concentration of aspartame in chewing gum samples in comparison with lawful limit of FAO/WHO is 0.0227 percent and in comparison with FDA is 0.0222 percent and this amount represents the lower limits of aspartame in the sample in comparison with international standards. According to the maximum allowable concentration of aspartame and obtained amount of average for the aspartame of gum samples from supply level would conclude that the rate of consumer exposure to the aspartame due to the consumption of imported gum is far less and the percentage is much lower than allowable limit. However according to the obtained concentration in this study and its interval from allowable limit, it can be concluded that the consumption of exported gums doesn’t pose a risk to the health of consumer and the concentration of aspartame in comparison with international standards is less than its allowable limit for the consumer. But according to the daily intake of various doses of aspartame from other sources containing the artificial sweetener such as non-alcoholic drinks, deserts, icy yogurt, chewable multivitamins, cereals, desktop sweeteners, medicine, etc, to prevent poisoning caused by excessive consumption of these sweeteners caution must be observed.
Table 5: Comparison of mean amount of aspartame in chewing gum samples with some permission limits in national and international legislations for human consumption
|
Reference |
|
EU (mg/kg) |
ISIRI (mg/kg) |
FDA (mg/kg) |
FAO/WHO (mg/kg) |
This research (mg/kg) |
|
Sweetener |
|
(18-21) |
5500 |
5500 |
50 |
40 |
0.0111 |
Aspartame |
Acknowledgements
Financial Supports from Pharmaceutical Sciences Branch, Islamic Azad University (IAUPS) and Food and Drug Organization, Ministry of Health and Medical Education Iran is gratefully acknowledged.
References
- Horio, Y.; Sun, Y.; Liu, C.; Saito, T.; Kurasaki, M. Aspartame-induced apoptosis in PC12 cells, environmental toxicology and pharmacology. 2014, 37, 158–165.
- Chen, Q. C.; Mou, Sh.; Liu, K.; Yang, Z.; Ni, Zh. Separation and determination of four artificial sweeteners and citric acid by high-performance anion-exchange chromatography, Jour. Chromatography A. 1997, 771, 135-143.
CrossRef - Pierini, G. D.; Llamas, N. E.; Fragoso, W. D.; Lemos, S. G.; Di Nezio, M.S.; Centurión, M. E. Simultaneous determination of acesulfame-K and aspartame using linear sweep voltammetry and multivariate calibration, Jour. Microchemical. 2013, 106, 347–350.
CrossRef - Kroger, M.; Meister, K.; Kava, R. Low-calorie Sweeteners and Other Sugar Substitutes: A Review of the Safety Issues, comprehensive reviews in food science and food safety. 2006, 5, 35-47
- Sardesai, V. M.; Waldshan, T. H. Natural and synthetic intense sweeteners, Jour. Nutritional Biochemistry. 1991, 2, 1-9.
CrossRef - Marinovich, M.; Galli, C. L.; Bosetti, C.; Gallus, S.; La Vecchia, C. Aspartame, low-calorie sweeteners and disease: Regulatory safety and epidemiological issues, Jour. Food and Chemical Toxicology. 2013, 60, 109–115.
CrossRef - Magnuson, B. A.; Burdock, G. A.; Doull, J.; Kroes, R. M.; Marsh, G. M.; Pariza, M. W.; Spencer, P. S.; Waddell, W. J.; Williams, G. M. Aspartame: A Safety Evaluation Based on Current Use Levels, Regulations, and Toxicological and Epidemiological Studies, Informa Healthcare. 2007, 37, 629-727.
CrossRef - Srogi, K. A Review: Application of microwave techniques for environmental analytical chemistry, Anal. Lett. 2006, 39, 1261-1288.
CrossRef - Givianrad, M. H.; Hashemi, A. A Survey of The Effect of Some Heavy Metals in Plant on The Composition of the Essential Oils Close to Veshnaveh-Qom Mining Area, Orient. J. Chem. 2014, 30(2), 737-743.
- Elhardallou, S. B.; El-Naggar, A. Y. Determination of Micro Minerals in Milk from Farm and Pasture-Reared Cow, Goat and Camel; using Inductively Coupled Plasma-Optical Emission Spectrometry, Orient. J. Chem. 2016, 32(1), 341-347.
- Kumaravel, S.; Alagusundaram, K. Determination of Mineral Content in Indian Spices by ICP-OES, Orient. J. Chem. 2014, 30(2), 631-636.
CrossRef - Spar Eskilsson, S.; Bjorklund, E. Analysis-scale microwave assisted extraction, Jour. Chromatography A. 2002, 902, 227-250.
CrossRef - Turner, C. Overview of Modern Extraction Techniques for Food and Agricultural Samples. 2006, Page 4-20, ISBN: 9780841220447.
CrossRef - AOAC, official methods of analysis, 1990, 2, 1016.
- Limchoowong, N.; Tan-Umporn, P.; Laijungred, L.; Techawongstein, S.; Chanthai, S. The Effect of Inorganic and Organic Pre-reducing Agents on Selenium Analysis in Tomato Sample using Microwave- Assisted Digestion Followed by FI-HGAAS, Orient. J. Chem. 2015, 31(1), 171-176.
CrossRef - EN 12856:1999 – Determination of acesulfame-K, aspartame and saccharin by HPLC method.
- JECFA, Aspartame. Toxicological Evaluation of Certain Food Additives and Contaminants, 1980. World Health Organization Technical Report Series No. 653. Prepared by the Twenty-third Report of the Joint FAO/WHOExpert Committee on Food Additives (JECFA). Food Additive Series 15. World Health Organization, Geneva.
- U.S. Food and Drug Administration. Aspartame: commissioner’s final decision, Final Rule. Federal Registry, 1981, 46, 38284–38308.
- Institute of Standards and Industrial Research of Iran (ISIRI). Chewing Gum and Bubble Gum –Specifications. 2007, Number 8.
- EC, Opinion of the Scientific Committee on Food: update on the safety of aspartame (expressed on 4 December 2002), European Commission, Health and Consumer Protection Directorate-General, Brussels, Belgium. 2002, Report Number: SCF/CS/ADD/EDUL/222.
- Ojeda, C.B.; Rojas, F.S. Sample dissolution for elemental analysis | Microwave Digestion, Chemistry, Molecular Sciences and Chemical Engineering. 2013, Page 153-163, ISBN: 978-0-12-369397-6.

This work is licensed under a Creative Commons Attribution 4.0 International License.


