Influence of dye loading time and electrolytes ratio on the performance spin coated ZnO photoanode based dye sensitized solar cells
Amrik Singh1*, Devendra Mohan2 , Dharamvir S. Ahlawat1 and Richa3
1Material Science Lab., Department of Physics, Chaudhary Devi Lal University, Sirsa-125055 Haryana (India)
2Laser Laboratory, Department of Applied Physics, Guru Jambheshwar University of Science and Technology, Hisar-125001, Haryana, (India)
3Research Scholar, Department of Physics, IKG Punjab Technical University, Jalandhar ,Punjab (India).
corresponding author email:amrik23kuk@gmail.com
DOI : http://dx.doi.org/10.13005/ojc/320229
Article Received on :
Article Accepted on :
Article Published : 09 May 2016
ZnO photoanode for dye sensitized solar cell sythesized by sol-gel spin coating method. XRD pattern confirmed the film is crystalline in nature and crystallite size calculated was 45.8 nm. The grain size from SEM image of ZnO is 66.3nm. Trnsmission of ZnO thin film was observed 75-92% in wavelength range from 400-800nm. The effieciency for for dye loaded 6 and 12 hours time were 0.38 and 0.44 respectively. In case of electrolytes ratio the maximum effieciency and fill factor were 0.44 and 0.49 respectively.
KEYWORDS:ZnO thin film; dye loading time; electrolytes ratio
Download this article as:| Copy the following to cite this article: Singh A, Mohan D, Ahlawat D. S, Richa. Influence of dye loading time and electrolytes ratio on the performance spin coated ZnO photoanode based dye sensitized solar cells. Orient J Chem 2016;32(2) |
| Copy the following to cite this URL: Singh A, Mohan D, Ahlawat D. S, Richa. Influence of dye loading time and electrolytes ratio on the performance spin coated ZnO photoanode based dye sensitized solar cells. Orient J Chem 2016;32(2). Available from: http://www.orientjchem.org/?p=15950 |
Introduction
Dye sensitized solar cells (DSSC) have attracted considerable attention in recent years as an alternative to conventional silicon solar cells 1–4. Dye sensitized solar cell consist of photoelectrode, counterelectrode and electrolytes. Transparent conducting oxide/glass like ITO(indium doped tin oxide) , FTO (Flourine doped tin oxide) that act substrates for both photoanode and counterlectrode. Photoanode consists of ZnO film coated on ITO glass substrate. As incident photons are absorbed by dye molecules, then consequetly electrons injected from their excited states into the conduction band of the TiO2/ZnO nanoparticles and the dye molecule gets oxidized. Oxidized dye molecules are reduced by a redox electrolyte, which transports the positive charges by diffusion to a counterelectrode 5-7. The ZnO material possesses a wide band gap, low resistance and high light trapping characteristics that make it suitable in solar cells applications.8-11 A high electron diffusion coefficient and a low recombination rate constant are key requirements for fabricating highly efficient dye-sensitized solar cells. Higher dye loadings, which are desirable for inducing higher photon harvesting, are also limited by the low diffusion and high recombination rates of the electrons 12, 13. In the present paper we have focused on effieciency variation of DSSC with change in concnetration of lithium iodidie in electrolytes and dye loading time of ZnO photoanode. Dye loaded in semiconductor oxide film becomes essential to improve the light harvesting efficiency of a DSSC material. A monolayer and uniform dye coverage are highly to enhance performance. In fact, multilayer formation and poor dye coverage hinder the kinetics of electron transfer 14.
Experimental Part
ZnO Sol preparation
ZnO sol prepared from zinc accetate dihydrate, Ehtanol were taken as starting materials. Put the 50 ml ethanol into conical flask and raise the temperatute of hot plate upto 60oC. Zinc accetate (0.8M ) was added into stirred ethanol, after 30 minutes pour the ehtanolamine into solution drop by drop. The molar ratio of zinc accetate and ehtanolamine was matained at 1:1. After 30 minutes of stirring cool down the transparent ZnO sol to room temperature. Hold the sol at room temperature for 24 h. before coating.
Photoelectrode Preparation
ZnO Sol was coated on ITO substrates by spin coater. The speed of spin coater was adjusted to 3000rpm for one minute and then dried the each film on hot plate maintained at 180oC for 10 minutes for removal of extra solvents. For desire thickness of films the steps of coating were repeated and then put the films for annealing at 550oC with ramp rate 10oC/min. temperature for one hour. For Platinum film coated ITO the solution made from 5mM PtCl4 (Sigma Aldrich 99.9%) in isoproponal (Sigma Aldrich). Put the soltion on ITO glass substrate and spin for 1 min at 2800rpm speed. Heat the platinum film at 130oC for 15 minutes at hot plate and then tranfered to furnace. Annealed the film at 400oC for 15 minutes.
Lithiun Iodide Concentration In Electrolytes Solution
Electrolytes solution was made from 0.03M Lithium Iodide (Sigma Aldrich 99.9%) and 5mM iodine (SigmaAldrich) in acetonitrile (Sigma Aldrich) to form solution EL1 and solution made from 0.05M Lithium Iodine and 5mM iodine in acetonitrile to form EL2. In case of EL1 and EL2 the photoelectrode was dipped in 0.5mM N719 dye (Sigma Aldrich 99.9%) and ethanol (Merck) dye solution for 12 hours.
Dye Loading Time
0.5mM N719 dye (Sigma Aldrich 99.9%) and ethanol (Merck) to make dye solution. Dipped the photoelctrode in dye solution for 6 h. (dip1), 12 h. (dip2) and wash with ethanol to remove extra dye and then dry the photoelectrodes. In this case the EL2 (LiI : I2 = 10:1) combination of electrolytes was used.
Combined the photoelctrode and conterlectrode together and injected the electrolytes between the electrodes.
Characterization techniques
XRD of filmS were taken by XRD model (Rigaku). SEM and UV-Visible of ZnO sample was recorded by SEM (SEM, JEOL) and (SHIMAZDU, UV) respectively. The photocurrent-voltage (J-V) characteristics of solar cell were measured using using a AM-1.5 solar simulator with xenon lamp (max.150 W) ar room temperature. Incident light intensity and active cell area were 100 mW/cm−2 (one sun illumination) and 1cmx1cm respectively.
Results and Discussions
Fig.1 demonstrate the XRD of ZnO film is in angle range of 20-60o. The main peaks of XRD corresponding to (100), (002) and (101) at 32.68o, 35.34o and 36.68o. angles respectively. The high intense peak at (101) coorespondes to 36.68o angle. The crystallite size corresponding to (101) plane of ZnO film was 45.8nm respectively.
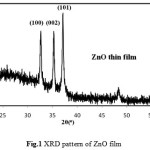 |
Figure 1: XRD pattern of ZnO film
|
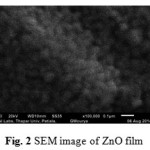 |
Figure 2: SEM image of ZnO film Click here to View figure |
Fig. 2 demonstrates the SEM image of ZnO film. The SEM image of ZnO film shows that there is a regular arrangement of grains. The average grain size of ZnO film was obtained as 66.6 nm.
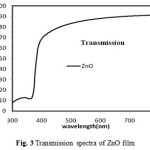 |
Figure 3: Transmission spectra of ZnO film Click here to View figure |
Fig. 3 reports the Uv-Visible spectra of ZnO film is in the wavelength range of 300-800nm. The transmission of ZnO film is 75-90% in wavelength from 400-800nm.
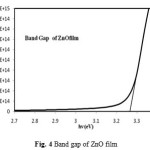 |
Figure 4: Band gap of ZnO film |
Fig. 4 shows the band gap of ZnO film. The band gap calculated from tauc’s plot was 3.269 eV.
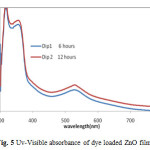 |
Figure 5: Uv-Visible absorbance of dye loaded ZnO films
|
Fig. 5 investigated the Uv-Visible absorbance of N719 dye loaded films for 6 hours and 12 hours in the wavelength range of 300-800nm. The main absorbance peaks at around wavelength 310nm, 371nm and 532nm. The absorbance of 12 hours dye loaded ZnO film was high as compared to ZnO film loaded in dye for 6 hours at room temperature.
Performance of DSSCs
The values of fill (FF) and efficiency of DSSC were calculated by following equations
Fiil Factor (FF) = ImxVm/IscxVoc — eq. 1
Voc – open circuit voltage, Isc- short circuit voltage, Im- max. current and Vm- maximum volatage.
η= IscxVocxFF/Pin(mW/cm2) — eq. 2
η is the effieciency of solar cell, Pin is the input power provided to DSSC.
Table 1: Demonstrates the Photovoltaic Performance of Different Samples of Zno DSSC.
| Sample | Fill factor | Voc (mV) | Jsc (mA/cm2) | Efficiency % |
| Dip1 6 hours | 0.47 | 580 | 1.4 | 0.38 |
| Dip2 12 hours | 0.49 | 600 | 1.5 | 0.44 |
| EL1 | 0.46 | 590 | 1.35 | 0.36 |
| EL2 | 0.49 | 600 | 1.5 | 0.44 |
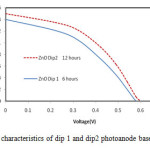 |
Figure 6: J-V characteristics of dip 1 and dip2 photoanode based solar cell
|
Fig.6 demonstrates the J-V characteristics of DSSCs with dip and dip2. The highest value of open circuit voltage was 600mV for dip2 DSSC. The calculated fill factor of ZnO dip 1 and dip2 were0.38 and 0.44, respectively. The calculated efficiency for ZnO dip1 and dip 2 were 0.38 %, 0.44% respectively. Figure shows that, for all film thicknesses with 310nm, the energy conversion efficiency inferred from the current-voltage curves presented in these graphs increases as the dye-loading times increase. The enhancement in photon to electron conversion performance of DSSC was due to harvest in large number of photons in dip 2 as compared to dip1 [15].
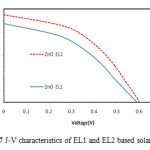 |
Figure 7: J-V characteristics of EL1 and EL2 based solar cell |
Fig. 7 shows the J-V characteristics of DSSCs with EL1 and EL2. Highest current density was 1.5mA/cm2 in case of EL1 sample. The fill factor of ZnO EL1 and EL2 were 0.36 and 0.44 respectively. The calculated efficiency for ZnO EL1 and EL2 were 0.36 %, 0.44% respectively. Excess LiI causes the penetration of Li+ ions in the mesoporous dye-coated nanocrystalline ZnO film due to its small-radius and form an ambipolar Li+ – e− with the electrons in the conduction band of ZnO, which increases the transport speed of electrons in nanocrystalline ZnO network and enhances the Jsc of DSSCs [16]
Conclusions
Photo electrode of dye Sensitized solar cells with ZnO has been successfully prepared by a simple sol–gel spin coating technique The grain size calculated from SEM is 44nm. The band gap value of ZnO was observed 32.26eV. Our studies have revealed that there was a variation in efficiency of DSSC with different dye loading time and different ratio of Lithium iodide and iodine electrolytes. The fill factor values are for ZnO with dip1, dip2, ELl and EL2 were 0.38, 0.44 and 0.36 and 0.44 respectively. The calculated efficiency for ZnO dip1, dip2, EL1 and EL2 were 0.38, 0.44, 0.36 and 0.44 % respectively.
Acknowledgement
Financially support from IUAC, New Delhi is highly acknowledge full
References
- Regan B.O., Grätzel M., Nature 1991, 353, 737.
CrossRef - Gratzel M., Nature 2001, 414, 338.
CrossRef - Nazeeruddin M.K., Angelis F.D., Fantacci S., Selloni A., Viscardi G., Liska P., Ito S., Grätzel M. , J. of the American Chem. Soc. 2005 127 .,16835.
CrossRef - Afifi A., Tabataet M.K., Orient. J. Chem. 2014, 30(1), 2024
CrossRef - Ngaffo F.F., Caricato A.P., Fernandez M., Appl. Surf. Sci. 2007, 253, 6508–6511.
CrossRef - Gratzel, M., J. Photochem. Photobiol. 2004, A 164, 3–14.
- Sharma M., Gairola R.P., Orient. J. Chem., 2013, 29(3), 304.
- Longo C., Paoli M.A.D., J. Braz. Chem. Soc. 2003, 14, 889-901.
CrossRef - Moorthi V.S., Joe J.P.M., Orient. J. chem. 2015, 31(1), 149-157.
- Gratzel M., Prog. Photovoltaics 2000, 11, 171-185.
CrossRef - Jyoti D., Mohan D. and Singh A, Int. J. of Enhanced Research in Sc. Tech. & Eng. 2014, 3(2), 388-393.
- Law M., Greene L. E., Johnson J. C., Saykally R., and Yang P., Nature Materials 2005, 6, 455–459.
CrossRef - Law M., Greene L.E., Radenovic A., Kuykendall T., Liphardt J. and Yang P., J. of Physical Chem. B 2006, 110( 45), 22652–22663.
CrossRef - Ono T., Yamaguchi T., and Arakawa H., J. of Solar Energy Eng. 2010, 132( 2)
CrossRef - Rajab F. M., J. of Minerals and Materials Characterization and Eng. 2014, 2, 169–175. 2014.
CrossRef - Olson C.L., J. of Phys. Chem.B 2006, 110, 9619
CrossRef

This work is licensed under a Creative Commons Attribution 4.0 International License.


