Fed-Batch Fermentation for Propionic, Acetic and Lactic Acid Production
Negin Ahmadi1, Kianoush Khosravi-Darani2, Solmaz Zarean-Shahraki3, M. Mortazavian4, S. M. Mashayekh4
1Research Committee, National Nutrition and Food Technology Research Institute, Faculty of Nutrition Sciences and Food Technology, Shahid Beheshti University of Medical Sciences, Tehran, Iran.
2Department of Food Technology Research, National Nutrition and Food Technology Research Institute, Faculty of Nutrition Sciences and Food Technology, Shahid Beheshti University of Medical Sciences, Tehran, Iran.
3M.Sc. in Food Science and Technology, Faculty of Agriculture, Sari Branch, Islamic Azad University, Sari, Iran.
4Department of Food Science and Technology, National Nutrition and Food Technology Research Institute, Faculty of Nutrition Science and Food Technology, Shahid Beheshti University of Medical Sciences, Tehran, Iran.
DOI : http://dx.doi.org/10.13005/ojc/310174
Article Received on :
Article Accepted on :
Article Published : 28 Mar 2015
Propionibacterium is capable of producing many important industrial products such as propionic acid, vitamin B12 and bacteriocin. Also it shows some probiotic health benefits and produces stimulator of intestinal bacteria. The aim of this research is to evaluate the effect of pH control on biomass, propionic, acetic and lactic acids production in fed-batch system by Propionibacterium freudenreichii ssp. shermanii and Lactobacillus acidophilus. Fermentation was conducted in a 3-L fermentor containing base medium and molasses as the carbon source in which milk feeding were added in 36th hour and maintained at 30 °C. Total fermentation time was 144 h. Every 24 h sampling has been done to measure the biomass and organic acids. Yield of biomass and acid production were compared in two separate trials: one treatment without pH control and another in which pH was maintained at 6.5 by using NaOH 1N. Content of biomass and organic acid were measured by freeze drying method and HPLC, respectively. The final concentration of the obtained responses in treatments with and without pH control is as following (g/L): biomass 6.22±0.04 and 13.76 ±0.04; propionic acid, 5.25±0.02 and 5.67±0.01; acetic acid 5.86±0.02 and 6.33±0.06; and lactic acid 11.34±0.09 and 7.40±0.07. In treatment which pH has not been controlled, production of dried biomass, propionic and acetic acid were higher than controlled treatment. So production of a beverage containing propionic acid could be recommended due to satiety-inducing and saturation effect in consumer.
KEYWORDS:Propionibacterium freudenreichii subsp; Shermanii; propionic acid; fed-batch system; carbon source; molasses; fermentation
Download this article as:| Copy the following to cite this article: Ahmadi N, Khosravi-Darani K, Zarean-Shahraki S, Mortazavian M, Mashayekh S. M. Fed-Batch Fermentation for Propionic, Acetic and Lactic Acid Production. Orient J Chem 2015;31(1). |
| Copy the following to cite this URL: Ahmadi N, Khosravi-Darani K, Zarean-Shahraki S, Mortazavian M, Mashayekh S. M. Fed-Batch Fermentation for Propionic, Acetic and Lactic Acid Production. Orient J Chem 2015;31(1). Available from: http://www.orientjchem.org/?p=8121 |
Introduction
Propionibacterium is gram-positive, nonmotile, catalase-positive, nonsporeforming, rod-shaped and anaerobic to aerotolerant bacteria.[1] The genus of Propionibacterium is separated into two groups: the “cutaneous” and the “dairy” Propionibacteria, based on their habitat. [2] They also may contribute to natural fermentations of silage and olives; and can produce a variety of industrially integral products such as propionic acid, vitamin B12, and bacteriocins. Recently, propionic acid bacteria have gained much attention as both probiotics beneficial for human health and producers of prebiotics selectively stimulating the growth of beneficial intestinal bacteria such as bifidobacterial species.[3]
Propionibacterium simulates growth of Bifidobacterium as probiotic and in this way, regulate microbial flora and cause digestive health. In addition, these bacteria prevent activities of enzymes which producing mutagenic agents and thereby boost the immune system.[4] They effect on intestinal pH through the production of short-chain fatty acids and increase the absorption of iron and calcium.[5,6] Among produced short-chain fatty acids (acetic, propionic and butyric acids) have significant role in induce satiety[7] by simulate secretion of intestinal peptide YY as appetite suppressants[8,9,10] and delayed gastric emptying due to the production of short-chain fatty acids, especially propionic acid.[11] Propionibacterium can reduce plasma cholesterol levels by inhibition of cholesterol synthesis in liver via inhibition of enzyme activity of hydroxy methyl glutaryl CoA synthase and increase fecal excretion of bile acids and cholesterol intake to re-synthesis of bile acids.[12,13] Some strains of Propionibacterium are able to produce vitamins such as B2and B12.[14,15]
Studies show that the optimal conditions for the growth of Propionibacterium species are 30-37 °C and pH 6 to 7.[16] Optimum pH range is between 4.6 to 5.8. Below than pH of 4.5, growth will be stopped and acid production will be reduced, so higher inoculum size require for growth.[17] Propionibacterium are able to use different carbon sources such as glucose,[18,19] maltose,[20] sucrose,[21] lactose,[22,23] lactate[19,24] and glycerol.[25,26] It can also use complex sources such as hemicelluloses, corncob molasses and sugarcane molasses and etc.[27]
Since, the application of conventional and expensive systems of fermentation is limited due to the low concentration, yield and productivity, the increased yields of propionic acid obtained by fermentation of cheap industrial waste e.g. glycerol or renewable sources e.g. molasses, biological production can be economically justified.[16,28] Molasses is a renewable resource as a waste of sugar factories. This complex carbon source is able to produce large quantities of biomass and can be used where high cell mass production is concerned. For instance, the production of secondary metabolites such as vitamin B12 can initially reach plenty of biomass with consumption of molasses by the microorganism that is useful for extracting vitamin B12.[1]
The major problem of batch system is strong inhibitory of final product on production yield, slow growth of bacteria[29,30] and difficulty of extraction from media.[31] Other processes, including multi-stage,[32] cell immobilization,[33] using fed-batch[24] and continuous culture system[34] have been used to increase yield of propionic acid production.[24] In fed-batch system a simple feeding strategy was used for the supplementation of nutrient e.g. sugar at frequent intervals and constant feed rate. Feeding may be start when the growth rate is high, to eliminate nutrient depletion and avoid the accumulation of inhibitory products.[22] Few studies have assessed propionic acid production by fed-batch fermentation model and the use of molasses as a carbon sources. So, there is limited evidence of study on the effect pH on the organic acid production by Propionibacterium with use of molasses as a carbon sources. If the purpose of using Propionibacterium is a health benefit in terms of a functional food, use of NaOH is an important issue while controlling pH; that requires study on its effects on organic acids production. In our previous research, maximum propionic acid was achieved by inoculation rate of 1:4 Lactobacillus acidophilus and P. freudenreichii spp shermanii.[35] In this study, the attempt scale up of production, change of fermentation system from flask to 1.2 L bioreactor and study effect of pH control on propionic. Acetic and lactic acids production by mentioned inoculums.
Material and Methods
Microorganisms and Inoculums Preparation
P. freudenreichii ssp. shermanii DSM 20270 and L. acidophilus LA5 were obtained from IROST (Iranian Research Organization for Science and Technology). P. freudenreichii was grown in Propionibacterium culture (composition: 1% pancreatic digests of casein, 0.5% yeast extract, and 1% sodium lactate) and was incubated anaerobically for 48 h at 30 °C.
The conservation medium held per liter of deionized water: 1 g KH2PO4, 2 g (NH4)2HPO4, 2.5 mg MnSO4·H2O, 5 mg FeSO4·7H2O, 10 mg MgSO4·7H2O, 10 mg CaCl2·6H2O, 10 mg CoCl2·6H2O, 5.0 g yeast extract, 5.0 g sodium lactate, and 7.0 g agar, and pH was adjusted to 6.8 before autoclaving. The preculture and the inoculum media had the same composition as the conservation medium minus agar. In addition, sodium lactate concentration was increased to 20 g/L, whereas yeast extract concentration was increased to 10 g/L. One separated colony from deep agar plate was transferred to 2 mL of preculture medium and incubated at 30 °C for 48 h.
A portion of this culture (0.4 mL) was transferred to 40 mL screw-cap flask holding 40 mL of inoculum medium broth. P. freudenreichii was grown without agitation for 24–36 h at 30 °C in inoculum medium broth and was inoculated at 1% (v/v), into 1.2 L of fermentation broth in the 3-L fermentor. The cell count of the pre-inoculums was 4.2×10⁹ CFU m/L.
Fed-batch Fermentations
The fermentation medium for fed-batch fermentation had 25 g molasses [basal medium with sugarcane molasses (BMSM)] and 350 mL skim milk (contains ~ 23 g lactose) was added as feeding source. The basal medium and the carbon sources were prepared independently. The pH of these two solutions was adjusted to 6.5±0.05 before autoclaving.
Skim milk powder was diluted with 300 mL distilled water in a bottle and was sterilized at 121° C and 1 bar for 15 s. The fed-batch system was adjusted for 144h fermentation at 30° C and feeding was started after 36 hours for 8 hours by constant speed of 0.03 L/h. Two treatments were compared to each other; in one medium pH was maintained at 6.5 by using NaOH 1N, but in another series, during fermentation pH was n’t controlled and decreased. Samples of 20 mL were removed each 24 h of the fermentation.
Biomass Determination
After sampling from fermentor, 20 mL of samples was centrifuged at 12000×g for 10 min at 4 ˚C. The supernatant phase was washed and was added to a plate for freeze-drying. Plates were weighed after freeze-drying.
Organic Acid Determination
As described before (Farhadi et al., 2012) separation and quantification of propionic, lactic and acetic acids was done using a High Performance Liquid Chromatography (CE 4200, Cecil, Milton Technical Center, Cambridge, UK). In a short period, for extraction of acids, 6 ml of sample was diluted into 5 mL of 0.5 N H2SO4. After centrifugation (at 5000×g for 15 min), 3 mL of upper phase was filtered through 0.45-μm Gelman Acrodisc filters and injected into HPLC system.
The chromatographic system contains two CE-4200 Dual piston pump, one CE-4200 UV visible detector, a vacuum degasser and a dynamic mixing chamber. An Agilent technologies (Palo Alto, CA, USA) Eclipse C18 column (4.6 mm × 250 mm i.d, 5 μm) was used for separation. The mobile phase was a binary solvent with constant ratio (30:70) of methanol: water (adjusted by sulphuric acid 5 × 10⁻⁴ M) with total flow rate of 1 mL/min. The volume of injection loop was 20 μL. The detection wavelength was set at 210 nm and the analysis was carried out at ambient temperature. All experiments were performed in triplicate. The standard solutions of propionic, lactic and acetic acids (Merck, Darmstadt, Germany) were prepared in distilled water. Initial identity assignment of organic acids (propionic, lactic and acetic acids) was based on comparison of retention data gained with the UV detector for standard compounds and sample components. Quantification was accomplished using peak areas from external calibration with standard solutions.
Results
pH changes during fermentation
Figure 1 shows pH profile during microbial production process. In fed-batch pH was maintained at 6.5 by automatic adding 1 N NaOH in treatment 1 while it’s allowed to drop in pH in treatment 2 and final pH was reached to 4.6. As can be seen in Figure 1, pH drop is a significant amount from the starting time until feeding time and this dropping continues by adding secondary carbon sources (lactose as a feed), but by reaching the end of fermentation, this decreasing is very small. It can be seen that bacteria are able to use carbon sources quickly during the initial 36 hours and rapid production of acids which causes pH dropping.
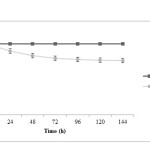 |
Figure1: pH changes during fermentation in two treatments; closed squares are related to treatment 1 (fermentation with pH control by adding 1 N NaOH) and closed circles are related to treatment 2 (fermentation without pH control) Click here to View figure |
Dried biomass changes during fermentation
Change of dried biomass in both different treatments is shown in figure 2. It is observed that the concentration of produced biomass in the first 48 hours is pretty fast in both treatments. Then the growth rate is almost constant without pH control. The concentrations for both treatments with and without pH control were 6.19±0.10 and 13.76±0.04 g/L, respectively. Differences between these treatments statistically are significant (P<0.005) and biomass production during fed-batch fermentation without pH controlling is better than another one.
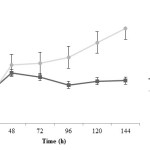 |
Figure2: Dried biomass changes during fermentation in two treatments; closed squares are related to treatment 1 (fermentation with pH control by adding 1 N NaOH) and closed circles are related to treatment 2 (fermentation without pH control) Click here to View figure |
Organic acid changes during fermentation
Propionic acid production is rather fast at initial time of fermentation and after 48 h the trend of propionic acid production in both treatments is similarly increasing. It is noted that propionic acid concentration in treatment 2 is more than treatment 1 (P<0.05). Acetic acid changes during fermentation time are very similar in both treatments; at the beginning, acid production in treatment 1 is faster. However, at the end of fermentation process, acid concentration in treatment 2 is more than treatment 1 (P<0.05). It has been observed that lactic acid production was decreased in pH control significantly more (P<0.05) and this difference is more pronounced after 72 h.
Vitamin B12 production
The final concentration of vitamin B12 in fermentation broth at treatment 1 was 3.9±0.01 mg/L while its concentration at treatment 2 was 0.05±0.00 mg/L. Despite more biomass production at treatment 2, vitamin production as a secondary metabolite is less in treatment 2 in compression with treatment 1.
It was observed that final concentration of dried biomass (6.22±0.04 g/L) and both organic acids, propionic (5.25±0.02 g/L) and acetic (5.86±0.02 g/L) in treatment 1, were lower than in treatment 2 (13.76±0.04, 5.67±0.01 and 6.33±0.06 g/L, respectively). But lactic acid final concentration in treatment 1 was 11.34±0.09 g/L which was more than treatment 2 (7.40±0.07 g/L) and for vitamin B12, concentration at treatment 1 significantly is more than another one.
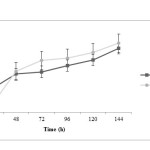 |
Figure3: Propionic acid changes during fermentation in two treatments; closed squares are related to treatment 1 (fermentation with pH control by adding 1 N NaOH) and closed circles are related to treatment 2 (fermentation without pH control) Click here to View figure |
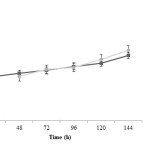 |
Figure4: Acetic acid changes during fermentation in two treatments; closed squares are related to treatment 1 (fermentation with pH control by adding 1 N NaOH) and closed circles are related to treatment 2 (fermentation without pH control) Click here to View figure |
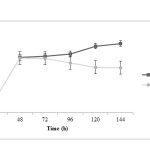 |
Figure5: Lactic acid changes during fermentation in two treatments; closed squares are related to treatment 1 (fermentation with pH control by adding 1 N NaOH) and closed circles are related to treatment 2 (fermentation without pH control) Click here to View figure |
Discussion
Considering the experimental fed-batch fermentations the maximum biomass concentration was obtained without pH control which was higher than that of when pH was controlled. Therefore, NaOH is seen as an inhibitory agent. During fermentation, the amounts of organic acids produced increase so more NaOH is required to hold pH at constant amount. In this condition use of large volume of NaOH may cause negative effect on bacterium growth.
Molasses contains high amounts of sucrose and is suitable for growth of bacteria, particularly Propionibacterium. At the beginning of the fermentation process, the bacteria consume the carbon source to grow rapidly. Lactose was added to fermentation broth, when molasses was finishing. Since lactose is favorable substrate for lactobacillus, bacteria will continue growing by consuming lactose. Continued production of biomass in the absence of NaOH increases even until the end of fermentation. According to increased concentration and productivity of biomass can be concluded that, fermentation without pH control is more suitable for growth of P. freudenreichii.
Also, competitive inhibitory effect of acetic acid on propionic acid production was demonstrated. Therefore, during the fermentation by producing more acetic and lactic acid the production of propionic acid was affected due to acid inhibitory effect. By feeding of lactose to culture medium and consequently its consumption by lactobacillus, production of lactic acid was increased. Also propionibacterium are able to use lactic acid as an alternative substrate. Studies show that in fermentation by P. freudenreichii 3 moles of lactic acid are converted to 2 moles of propionic acid, 1 mole acetic acid and 1 mole carbon dioxide.[36] So, reason for increased production of two organic acids after 48 hours is consumption of lactic acid by bacteria as a carbon source.
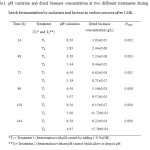 |
Table1: pH variation and dried biomass concentration at two different treatments during fed-batch fermnentation by molasses and lactose as carbon sources after 144h. Click here to View table |
Table2. Propionic, acetic acid and lactic acid concentration at two different treatments during fed-batch fermnentation by molasses and lactose as carbon sources after 144h.
|
Time |
Treatment |
Propionic |
Propionic |
Acetic acid |
Acetic |
Lactic acid |
Lactic |
|
(h) |
(T1* and T2**) |
acid conc. |
acid |
conc. |
acid |
conc. |
acid |
|
(g/L) |
Pvalue |
(g/L) |
Pvalue |
(g/L) |
Pvalue |
||
|
24 |
T1 T2 |
1.87±0.04 0.25±0.04 |
0.000 |
3.95±0.04 Not detected |
0.000 |
Not detected 2.17±0.03 |
0.000 |
|
48 |
T1 T2 |
3.16±0.04 3.36±0.02 |
0.028 |
4.27±0.03 4.01±0.08 |
0.012 |
9.04±0.05 8.95±0.05 |
0.268 |
|
72 |
T1 T2 |
3.32±0.03 4.26±0.00 |
0.000 |
4.56±0.02 4.61±0.08 |
0.478 |
9.23±0.05 8.92±0.05 |
0.038 |
|
96 |
T1 T2 |
3.82±0.01 4.45±0.03 |
0.000 |
4.87±0.06 4.80±0.03 |
0.293 |
9.61±0.08 8.19±0.04 |
0.000 |
|
120 |
T1 T2 |
4.29±0.01 4.91±0.02 |
0.001 |
5.18±0.03 5.52±0.05 |
0.010 |
10.93±0.02 7.46±0.07 |
0.000 |
|
144 |
T1 T2 |
5.25±0.02 5.67±0.01 |
0.002 |
5.86±0.02 6.33±0.06 |
0.10 |
11.34±0.09 7.40±0.07 |
0.000 |
*T1 = Treatment 1 (fermentation with pH control by adding 1 N NaOH)
**T2= Treatment 2 (fermentation without pH control which allow to drop in pH)
Table3. Effects of pH on propionic, acetic and lactic acid fermentation related to productivities at two different treatments during fed-batch fermnentation by molasses and lactose as carbon sources after 144h.
|
Time |
Treatment |
aPX |
PX |
bPP |
PP |
cPA |
PA |
dPL |
PP |
|
(h) |
(T1* & T2**) |
(mg/L) |
Pvalue |
(mg/L) |
Pvalue |
(mg/L) |
Pvalue |
(mg/L) |
Pvalue |
|
24 |
T1 |
21.13±0.28 |
0.001 |
10.81±0.21 |
0.000 |
22.88±0.26 |
0.000 |
– |
0.000 |
|
T2 |
14.13±0.32 |
1.46±0.25 |
– |
12.55±0.27 |
|||||
|
48 |
T1 |
42.40±0.33 |
0.003 |
18.27±0.22 |
0.028 |
24.72±0.16 |
0.014 |
52.34±0.34 |
0.270 |
|
T2 |
48.86±0.31 |
19.43±0.12 |
23.20±0.47 |
51.80±0.28 |
|||||
|
72 |
T1 |
38.31±0.26 |
0.001 |
19.24±0.18 |
0.000 |
26.38±0.11 |
0.478 |
53.43±0.32 |
0.038 |
|
T2 |
50.40±0.44 |
24.67±0.03 |
26.67±0.47 |
51.64±0.30 |
|||||
|
96 |
T1 |
32.19±0.20 |
0.000 |
22.13±0.83 |
0.000 |
28.21±0.36 |
0.293 |
55.63±0.49 |
0.002 |
|
T2 |
55.37±0.32 |
25.75±0.20 |
27.78±0.16 |
47.41±0.21 |
|||||
|
120 |
T1 |
35.61±0.43 |
0.000 |
24.81±0.07 |
0.001 |
29.99±0.20 |
0.027 |
63.26±0.13 |
0.000 |
|
T2 |
67.82±0.17 |
28.45±0.13 |
31.60±0.32 |
43.16±0.40 |
|||||
|
144 |
T1 |
36.03±0.22 |
0.000 |
30.36±0.12 |
0.002 |
32.90±1.64 |
0.040 |
65.65±0.54 |
0.000 |
|
T2 |
79.64±0.22 |
32.28±0.06 |
36.63±0.38 |
42.83±0.42 |
*T1 = Treatment 1 (fermentation with pH control by adding 1 N NaOH)
**T2= Treatment 2 (fermentation without pH control which allow to drop in pH)
(a) dried acid productivity
(b) Propionic acid productivity
(c) Acetic acid productivity
(d) Lactic acid productivity
Conclusion
Statistical results showed that no pH control has a significant positive impact on propionic and acetic acid production. This becomes more important when consider to nutrition and consumption aspect of broth containing propionic acid. If the purpose of propionic acid production is for nutritional properties in a functional food, lack of NaOH may be more important. Due to the relatively high amount of produced propionic acid in the sample and the higher yield of acid production in run without pH control and also the use of molasses as a cheap abundant carbon source, the results of this research have made it possible to make a functional beverage. However, scrutiny of satiety effect of this product in a one nutritional study is recommended.
According to beneficial role of lactose and L. acidophilus for production of propionic and acetic acid, using carbon sources include lactose such as milk is recommended. Moreover, considering the antifungal properties of propionic acid, in dairy product produced by this method with satiety effect, nutritional properties of probiotics and vitamin B12, it has a natural preservative and it helps to do not use any chemical preservatives such as sorbate.
References
- Coral, J.; Karp, S.G.; Vandenberghe, L.P.S.; Parada, J.L.; Pandey, A.; Soccol, C.R. Batch Fermentation Model of Propionic Acid Production by Propionibacterium acidipropionici in Different Carbon Sources. Appl. Biochem. Biotechnol. 2008, 151, 333–341.
- Zhang, A. Metabolic Engineering and Process Development for Enhanced Propionic Acid Production by Propionibactrium acidipropionici [Ph.D thesis]. The Ohio State University, 2009.
- Kouya, T.; Tobita, K.; Horiuchi, M.; Nakayama, E.; Deguchi, H.; Tanaka, T.; Taniguchi, M. Production of Extracellular Bifidogenic Growth Stimulator (BGS) from Propionibacterium shermanii using a Bioreactor System with a Microfiltration Module and an On-line Controller for Lactic Acid Concentration. J. Biosci. Bioeng. 2008, 105, 184-191.
- Ekinci, F.Y.; Gurel, M. Effect of using Propionic Acid Bacteria as an Adjunct Culture in Yogurt Production. J. Dairy. Sci. 2008, 91, 892-899.
- Bougle, D.; Vaghefi-Vaezzadeh, N.; Roland, N.; Bouvard, G.; Arhan, P.; Bureau, F.; Neuville, D.; Maubois, J.L. Influence of Short-Chain Fatty Acids on Iron Absorption by Proximal Colon. Scand. J. Gastroenterol. 2002; 37, 1008-1011.
- Trinidad, T.P.; Wolever, T.M.; Thompson, L.U. Effect of Acetate and Propionate on Calcium Absorption from the Rectum and Distal Colon of Humans. Am. J. Clin. Nutr. 1996, 63, 754-758.
- Ruijschop, R.M.A.J.; Boelrijk, A.E.M.; te Giffel, M.C. Satiety Effects of a Dairy Beverage Fermented with Propionic Acid Bacteria. Int. Dairy. J. 2008, 18, 945-950.
- Batterham, R.L.; Heffron, H.; Kapoor, S.; Chivers, J.E.; Chandarana, K.; Herzog, H.; Le Roux, C.W.; Thomas, E.L.; Bell, J.D.; Withers, D.J. Critical Role for Peptide YY in Protein-Mediated Satiation and Body-Weight Regulation. Cell. Metab. 2006, 4, 223-233.
- Cherbut, C.; Ferrier, L.; Rozé, C.; Anini, Y.; Blottière, H.; Lecannu, G.; Galmiche, J.P. Short-Chain Fatty Acids Modify Colonic Motility Through Nerves and Polypeptide YY Release in the Rat. Am. J. Physiol. Gastrointest. Liver. Physiol. 1998, 275, 1415-1422.
- Dockray, G. Gut Endocrine Secretions and Their Relevance to Satiety. Curr. Opin. Pharmacol. 2004, 4, 557-160.
- Liljeberg, H.; Bjorck, I. Delayed Gastric Emptying Rate as a Potential Mechanism for Lowered Glycemia after Eating Sourdough Bread: Studies in Humans and Rats using Test Products with Added Organic Acids or an Organic Salt. Am. J. Clin. Nutr. 1996, 64, 886-893.
- Demigne, C.; Morand, C.; Levrat, M.A.; Besson, C.; Moundras, C.; Remesy, C. Effect of Propionate on Fatty Acid and Cholesterol Synthesis and on Acetate Metabolism in Isolated Rat Hepatocytes. Br. J. Nutr. 1995, 74, 209-219.
- Hara, H.; Haga, S.; Aoyama,Y.; Kiriyama, S. Short Chain Fatty Acids Suppress Cholesterol Synthesis in Rat Liver and Intestine. J. Nutr. 1999, 129, 942-948.
- Quesada-Chanto, A.; Schmid-Meyer, A.C.; Schroeder, A.G.; Carvaiho-Jonas, M.F.; Blanco, I.; Jonas, R. Effect of Oxygen Supply on Biomass, Organic Acids and Vitamin B12 Production by Propionibacterium shermanii. World. J. Microbiol. Biotechnol. 1998, 14, 843-846.
- Leblance, J.G.; Rutten, G.; Bruinenberg, P.; Sesma, F.; Savoy de Giori, G.; Smid, E.J. A Novel Dairy Product Fermented with Propionibacterium freudenreichii Improves the Riboflavin Status of Deficient Rats. Nutrition. 2006, 22, 645-651.
- Coral, J. Propionic Acid Production by Propionibacterium sp. using Low-Cost Carbon Sources in Submerged Fermentation [Ph.D thesis]. Biotechnol. Bioprocesses. Eng. Division Federal University of Parana. 2008.
- Sheehan, J.J.; Wilkinson, M.G.; McSweeney, P.L.H. Influence of Processing and Ripening Parameters on Starter, Non-Starter and Propionic Acid Bacteria and on the Ripening Characteristics of Semi-Hard Cheeses. Int. Dairy. J. 2008, 18, 905-917.
- Himmi, E.H.; Bories, A.; Boussaid, A.; Hassani, L. Propionic Acid Fermentation of Glycerol and Glucose by Propionibacterium acidipropionici and Propionibacterium freudenreichii ssp. shermanii. Appl. Biochem. Biotechnol. 2000, 53, 435-440.
- Rickert, D.A.; Glatz, C.E.; Glatz, B.A. Improved Organic Acid Production by Calcium Alginate-Immobilized Propionibacteria. Enzyme. Microb. Tech. 1998, 22, 409-414.
- Babuchowski, A.; Hammond, E.; Glatz, B. Survey of Propionibacteria for Ability to Produce Propionic and Acetic Acids. J. Food. Prot. 1993, 56, 493-496.
- Quesada-Chanto, A.; S-Afschar, A.; Wagner, F. Microbial Production of Propionic Acid and Vitamin B12 using Molasses or Sugar. Appl. Microbiol. Biotechnol. 1994, 41, 378-383.
- Goswami, V.; Srivastava, A.K. Fed-Batch Propionic Acid Production by Propionibacterium acidipropionici. Biochem. Eng. J. 2000, 4, 121-128.
- Sherman, J.; Shaw, R. The Propionic Acid Fermentation of Lactose. J. Biol. Chem. 1923, 56, 695-700.
- Martinez-Campos, R.; Torre, M.d.l. Production of Propionate by Fed-Batch Fermentation of Propionibacterium acidipropionici using Mixed Feed of Lactate and Glucose. Bioresour. Technol. 2002, 24, 427–431.
- Barbirato, F.; Chedaille, D.; Bories, A. Propionic Acid Fermentation from Glycerol: Comparison with Conventional Substrates. Appl. Microb. Biotechnol. 1997, 47, 441-446.
- Zhu, Y.; Li, J.; Tan, M.; Liu, L.; Jiang, L.; Sun, J.; Lee, P.; Du, G.; Chen, J. Optimization and Scale-Up of Propionic Acid Production by Propionic Acid-Tolerant Propionibacterium acidipropionici with Glycerol as the Carbon Source. Bioresour. Technol. 2010, 101, 8902-8906.
- Liu, Z.; Ma, C.; Gao, C.; Xu, P. Efficient Utilization of Hemicellulose Hydrolysate for Propionic Acid Production using Propionibacterium acidipropionici. Bioresour. Technol. 2012, 114, 711-714.
- Kumar, S.; Babua, B.V. Brief Review on Propionic Acid: A Renewal Energy Source. Proceedings of National Conference on Environmental Conservation. 2006; 4, 58-64.
- Neronova, N.M.; Ibragimova, S.I.; Lerusalimskii, N.D. Effect of Propionate Concentration on the Specific Growth Rate of Propionibacterium shermanii. Mikrobiologiya. 1967, 36, 404-409.
- Nanba, A.; Nukada, R.; Nagai, S. Inhibition by Acetic and Propionic Acids of the Growth of Propionibacterium shermanii. J. Ferment. Technol. 1983, 61, 551-556.
- Yang, S.T.; Zhu, H.; Li, Y. Continuous Propionate Production from Whey Permeate using a Novel Fibrous Bed Bioreactor. Biotechnol. Bioeng. 1994, 43, 1124-1130.
- Playne, M.J. Propionic and Butyric Acid. In: Moo-Young M, editor. Comprehensive Biotechnology. Oxford: Pergamon Press; 1985, 3, 731-759.
- Champagne, C.P.; Baillargeon-Cote, C.; Goulet, J. Whey Fermentation by Immobilized Cells of Propionibacterium shermanii. J. Appl. Bacteriol. 1989, 66, 175-184.
- Blanc, P.; Goma, G. Propionic Acid and Biomass Production using Continuous Ultrafiltration Fermentation of Whey. Biotechnol. Lett. 1989, 11, 189-194.
- Farhadi, Sh.; Khosravi-Darani, K.; Mashayekh, M.; Mortazavian, A.M.; Mohammadi, A.; Shahraz, F. Effect of Incubation Temperature and Inoculation Ratio of Starter Culture on Propionic Acid Production in Dairy Beverage Fermented with Propionibacterium. Iran. J. Nutr. Sci. Food. Technol. 2012, 7, 41-50.
- Zhang, A.; Yang, S. Propionic Acid Production from Glycerol by Metabolically Engineered Propionibacterium acidipropionici. Process. Biochem. 2009, 44, 1346-1351.

This work is licensed under a Creative Commons Attribution 4.0 International License.


