Adsorption studies of Methylene blue dye from aqueous solution onto phaseolus aureus biomaterials.
D. B. Jirekar1 Arif Ali Pathan2, Mazahar Farooqui2, 3
1Anandrao Dhonde Alias Babaji College, Kada. (INDIA)
2Post graduate and Research center, Maulana Azad College Aurangabad, (INDIA)
3Dr. Rafiq Zakaria college for Women, Aurangabad. (INDIA)
DOI : http://dx.doi.org/10.13005/ojc/300342
Article Received on :
Article Accepted on :
Article Published : 17 Sep 2014
Experimental investigation was carried out by using commercially available husk of green gram (phaseolusaureus) seed to removal ofmethylene blue from aqueous medium. Husk of green gram seed was characterized by performing particle size distribution. The effect of contact time, effect of initial concentration of dye, effect of dosage, effect of salt, effect of pH, zero point pH and effect of temperature were studied in batch technique. Adsorption kinetic was verified by pseudo-first-order and pseudo-second-order models. The rate of adsorption of methylene blue followed by pseudo-second-order model for the dye concentration studied in the present case. Adsorption of methylene blue on green gram (phaseolusaureus) seed husk is also followed by Langmuir and Freundlich adsorption isotherm.
KEYWORDS:methylene blue; husk of green gram (phaseolusaureus) seed; adsorption; dye; Langmuir; Freundlich; adsorption isotherm
Download this article as:| Copy the following to cite this article: Jirekar D. B, Pathan A. A, Farooqui M. Adsorption studies of Methylene blue dye from aqueous solution onto phaseolus aureus biomaterials. Orient J Chem 2014;30(3). |
| Copy the following to cite this URL: Jirekar D. B, Pathan A. A, Farooqui M. Adsorption studies of Methylene blue dye from aqueous solution onto phaseolus aureus biomaterials. Orient J Chem 2014;30(3). Available from: http://www.orientjchem.org/?p=4713 |
Introduction
Most of organic dyes are in integral part of many industrial effluents and demand on appropriate method to dispose them off, Commonly suggested methods includes bio degradation, photo-catalytic, photolytic, and advanced oxidative degradation of these solutions (1-5), ultrasound oxidation process (6), biological process (7), membrane based separation process (8), and adsorption process (9) have been investigated for removal of colored dye from waste water. All process has their own limitations. The advantages and limitations of adsorption process are mostly defined by the physico-chemical nature and cost of the adsorbent. Activated carbon is one of the widely used and efficient adsorbent for dye removal. But its higher cost makes the process inefficient compared to the other process (10). Therefore the research of dye removal by adsorption is further diverted towards the search for reusable, low cost, locally available, biodegradable adsorbents made from natural sources like fly ash (11,12), clay (13,14), peat (15), active sludge, rice husk, maize cob, starch, coconut shell, cotton (16), bajra powder(17) etc.
The adsorption capacity of husk of green gram seed is usually related to their specific surface area and porosity. In addition the adsorption properties of husk of green gram seed are found to strongly depend on activation process. The aim of the present work is to investigate the comparative adsorption kinetic behavior of methylene blue dye onhusk of green gram seeds under various experimental conditions.
Experimental
Methylene blue (CI: 52015, FW: 319.85, supplied by Qualigens, Fine Chemicals, Mumbai, India) (Fig.1a) dye was used as adsorbates.The green gram (phaseolusaureus) seeds were purchased from local market. Green gram seeds are soaked into distilled water upto 24 hours. Then their skin was removing from their pulses and washed with distilled water. It is dried in shadow and grinded to fine powder. The dried fine powder adsorbent was stored in an air tight container for further experiments.
Adsorption experiments were carried out at room temperature (298±30K) in batch technique. A stock solution of two dyes of concentration 100 mg/L. in distilled water. Standardtechnique (18) was followed to determine the dye concentration using UV-Vis Spectrophotometer. Initial dye concentrations of 25, 50, 75 and 100 mg/L were used. To observe the effect of adsorbent dose on dye adsorption, adsorbent dose varies from 10-50 gm/L. was used with 100 mg/L methylene blue dye solution. Effect of salt concentration has been studied using various concentrations (10-50 gm/L) of potassium chloride in 100 mg/L methylene blue dye solution. Effect of temperature has been studied using various temperatures.
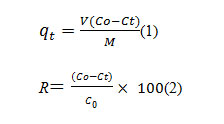
A series of desired methylene blue dye concentrations and a fixed volume 50 ml. placed in conical flask where they brought in to contact with husk powder at various temperatures. The dye solution corresponding to different adsorption time was then analyzed using UV-Vis. Spectrophotometer. The amount of dye removed per unite weight of husk adsorbent at time t, (mg/L) and dye removal efficiency ‘R’were calculated as
Where, is the initial dye concentration (mg/L), is the concentration of dye at any time t,V is the volume of solution (ml) and M is the mass of husk (gm).
Results and discussion
The structure of methylene blue and dye is given in fig.1. A condition of maximum removal of this dye from aqueous solution by adsorbing on husk of green gram (phaseolusaureus) seed was initially optimized. In this regard amount of husk, concentration of dye, effect of salt, effect of pH, zero point pH and effect of temperature were varied over a wide range. It may be mentioned here that adsorption of dyes increased with increase in contact time as well as increase in their initial concentration and become constant after equilibrium time. The result of such studies for this dye was summarized in tables.
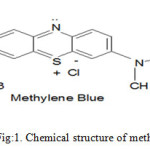 |
Figure 1 Click here to View Figure |
Adsorption studies
Effect of contact time
In adsorption studies, effect of contact time plays vital role irrespective of other experimental parameters effecting adsorption kinetics. The sample of dye was taken in separate flasks and adsorption studies were carried out at different contact time as constant initial concentration of dyes with fixed dose of adsorbent. The results are given in < fig.2.>.
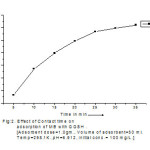 |
Figure 2 Click here to View Figure |
In the present investigation, it is observed that at initial stage percentage removals of MB dye was rapid and becomes slow and gets stagnated with increase in time.
Effect of initial dye concentration
The adsorption studies were investigated at 298.1K the concentration range of 25, 50, 75 and 100 mg/L.The results are shown graphically given in < fig.3 >.
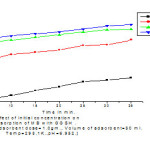 |
Figure 3 Click here to View Figure |
In this effect percentage removal efficiency of GGSH was higher at higher concentration i.e. at 100 mg/L maximum removal efficiency (79.85%) while at 25 mg/L removal efficiency was found to be 60.98%.
Effect of dose of adsorbent
The effect of adsorbent dose on dye adsorption, adsorbent dose varies from 10-50 gm/Lwas used with 100 mg/L methylene blue dye solution. It was observed that the removal efficiency of GGSH was 83.32 % at 35 min.by the addition of 2.5 gm adsorbent dose while removal efficiency of GGSH was found to be 77.73% at 0.5 gmadsorbent dose. i. e. at higher adsorbent dose removal efficiency was higher. The removal of MB dye is also graphically shown in < fig.4.
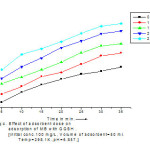 |
Figure 4 Click here to View Figure |
Effect of salt of adsorbent
Experiments had been carried out using KCl of different concentration ranging from 0.5 gm. to 2.5 gm. Increase in salt concentration decrease the percentage removal efficiency of GGSH with increasing ionic strength, removal capacity decreased due to screening of the surface charges.The percentage removal of MB dye was 82.67 % by the addition of 0.5 gm salt, but the addition of 2.5 gm of saltthe percentage removal of MB dye was 74.91 %. The graphical representation is shown in < fig.5 >
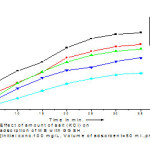 |
Figure 5 Click here to View Figure |
Effect of temperature
Temperature is one of the important parameters affecting separation in most of the processes. In the present work percentage removal of MB dye decreases from 80.24 % to 73.55% by increase in temperature from 5oC to 25oC. The trend of decrease <fig.6> confirms the process of removal of dye to be exothermic.
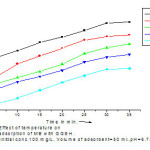 |
Figure 6 Click here to View Figure |
Effect of pH
pH is an important factor in controlling the removal of MB dyeonto GGSH adsorbent. The removal of MB dye on GGSH was studied at a temperature of 301.6 .3 K and 100 mg/L. concentration by varying the pH from 2.0 to 11.0, the solution was equilibrated for 24 hours. The result indicates that GGSH adsorbent showed good removal capacity in acidic medium than in basic medium. The percentage removal of MB dye of adsorption on GGSH adsorbents progressively decreased on the pH of the solution increased from 2.00 to 11.0. At higher pH, the percentage removal was found to decrease because the surface area of the adsorbent was more protonated and competitive adsorption occurred between H+ and free MB ions and their OH– towards the fixation sites. Therefore, H+ ions react with anionic functional groups on the surface of the adsorbent and results in restriction of the number of binding sites favorable for the removal of MB. However, a favorable increase in percentage removal for GGSH adsorbent was observed below pH 7.0.
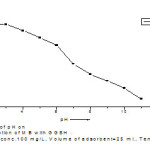 |
Figure 7 Click here to View Figure |
Zero point pH
The pH point of zero charge (pHpzc) of the adsorbent is determined by powder addition method. 0.02gm adsorbent was added to 50 ml of conical flask containing 20 ml of MB solution containing 0.1 M NaCl solution. Several batches were carried out for, 2.00 to 11.00 initial solution pH, called pH. The pH was adjusted using 0.1 M HCl and0.1 M NaCl solution. The electrolyte solution with adsorbent was equilibrated for 24 hours. After equilibrium, the final pH, pHf was recorded. Both positive and negative (pHi – pHf) values recorded for the adsorbent are plotted against the initial pH values. The pH at which becomes zero is called pHpzc.The 7.9 zero point charge was found in adsorbents used in present work. Cationic adsorption on GGSH adsorbent will be favorable at pH >pHpzc. The surface of the adsorbent gets negatively charged and favors uptake of cationic dyes to increased electrostatic force of attraction. Thus, MB removal favored at higher pH (pH>6.0). At lower pH (pH<pHpzc), adsorbent surface is positively charged, concentrations of H+ were high and they complete with positively charged MB cations for vacant adsorption sites causing a decrease in dye uptake. Similar trend was observed for adsorption of MB onto rice husk,(19) and wheat shells (20). Present results are in good agreements with the above results.
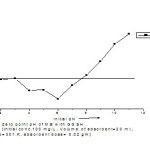 |
Figure 8 Click here to View Figure |
Adsorption kinetic models
Pseudo first order kinetic model assumed that the rate of solute up take with time was directly proportional to difference in saturation concentration and the adsorbed amount.
Where, and are the amount of dye removed (mg/g) at contact time t (min) and at equilibrium is the pseudo first order rate constant (min-1)
After integrating with the boundary conditions at t = 0, = 0 and att = t, =
is equilibrium rate constant for pseudo second order adsorption (g/mg min). and rearranging equation (6), the rate law for apseudo first order reaction become.
The plot of of log (qe – qt) and intercept log qe Removal rate were calculated from the slope and results are given in table (6) Pseudo second order kinetic model was
After integrating with the boundary conditions at t = 0, qt = 0 and att = t, qt = qt and rearranging equation (8), the rate law for apseudo second order reaction become.
versus tgave a straight line with slope and intercepts the calculated values k2, qe of values are given in table (6)
Table: 1. Comparison of the experiments and the kinetic model of MB dye on GGSH adsorbent.
|
Dyes |
Pseudo-First order |
Second order |
||||
|
K1 (min-1) |
(mg/gm) |
K2 (gm/mg.min) |
(mg/gm) |
|||
|
MB |
15.891*10-3 |
734.988 |
0.931 |
0.428*10-3 |
4121.553 |
0.999 |
Adsorption equilibrium
To study the validity of Freundlich adsorption is othermthe following equation has been used
Log x/m = log K+(1/n)log (13)
K is the Freundlich constant [mg/g (L/g)1/n]related to bonding energy, and n is the heterogeneity factor. The plot of Log x/m againstlog gives straight line which exhibits mono layer coverage of the adsorbate on the other surface of the adsorbent. The value of n between 2-10 indicates good adsorption. The equilibrium data was also analyzed in the light of Langmuiradsorption model.
Where, x/m is the amount ofdye removed per unit mass of adsorbent, is the equilibrium concentration. Plot of versus Ce= gives a straight line. The values of aandb were determined from figure.
Table: 2. Langmuir and Freundlich isotherm constants for the adsorption of MB dye.
|
Dye |
Langmuir constants |
Freundlich constants |
|||||
|
Q0 (mg/gm) |
b*10-3(L/gm) |
n |
Kf(mg/gm(L/gm))1/n |
||||
|
MB |
868.598 |
4.858 |
0.999 |
0.999 |
1.138 |
10.3836 |
0.999 |
Conclusion
The study reveals that GGSH can act as good adsorbents for the removal of M.B. The optimum PHfor adsorption is 6.7 and equilibrium time achieved as 24 hours. On the basis of above studies the following conclusions may be drawn.
- Green gram seed husk is a non-toxic agricultural material has been successfully used removal of MB dye from aqueous solutions.
- Effect of various parameters on theremoval of MB dye has been studied.
- Removal of dye decreased with increasing temperature, with maximum removal of MB (80.24 %) at 304.2K
- Process of adsorptive separation was exothermic in nature and thus lower temperature favors removal of MB dye from aqueous solutions.
- The kinetics of the removal of MB dye was the best described by the pseudo second order model.
- GGSH can serve as a potential material for removal of MB dyes from aqueous solutions.
Acknowledgement
One of the authors (D. B. Jirekar) is thankful to UGC (WRO) Pune for their financial support File No.:47-2031/11(WRO).Date:22 Feb. 2012.
References
- Walkar G M, Hensen L, Hanna J A, Allen S J, Water Res. 2003 37, 2081-2089.
- Malik P M, Saha S K, Sep. Purif.Technol.2003 31, 241-250,
- Chen K C. Wu J Y. Liou D J, Hwang S C J. J. of Biotechnol, 2003 101, 57-68
- Lin S H, Peng F C, Water Res. 1996 30, 587-593
- Rauf M A, Ashrsf S, Alhadrami S N, Dyes Pigments 2005 66, 197-200
- Brodnjak. D., Alenka.V.,Marechal.M. Dyes Pigm. 2003 59, 173-179
- Ledaakowcz, S., Solecka, M., Zyl, R. J. Biotechnol.2001 89, 175-184
- Chakraborty, S. ,Purkait, M. K., DasGupta, S., De, S., BasuJ.K Sep. Purf.Technol. 2003 31, 141-151
- Purkait,M.K.,Gusain,D.S.,Das Gupta,S. ,De,S. Sep.Sci.Technol.2004 39(10), 2419-2440
- Nandi, B. K. Goswami A and Purkait,M.K Appli, Clay, Sci, 2009 42, 583-590
- Janos P, Buchtova H, Ryznarova M, Water Res.2003 37, 4938-4944
- Mohan D, Singh K P, Kumar K, Ind. Eng. Chem. Res.2002 41, 3688-3695
- Al-Asheh S, Banat F, Abu-Aitah L Adsorp.Sci.Technol 2003.21, 451-462
- Khraisheh M A, Alg-Aitah M S. Adsorption,2005 547-549
- Kay G M, Allen S J, J. Sep. Process Technol1983.4, 1-7
- Crini, G. Bioresour,Technol,2006 97,1061-1085
- Mazahar Farooqui ,Sayyed Sultan, Maqdoom Farooqui and. H. Quadri. Ind. J. of Chem. Technol.,2004 11, 190-193
- Vogel, A.I., A Text Book of Practical Organic Chemistry, Longmans, London (1970).
- Bulut Y, Aydin H, Desalination2006 194, 259-267
- Mahesh S, Vijayakumar G and Pushpa Agarwal; J. Env. Biolog.2010 31, 277-280

This work is licensed under a Creative Commons Attribution 4.0 International License.

