Chemical Investigation of Lawsonia inermis L. Leaves from Afar Region, Ethiopia
Tekle Kebede Kidanemariam1, Tesfahun Kebede Tesema2, Kesatebrhan Haile Asressu2*, Aman Dekebo Boru3
1Department of Chemistry, Samara University, P.O. Box, 132, Samara, Ethiopia. 2Department of Chemistry, Haramaya University, P.O. Box, 138, Dire Dawa, Ethiopia. 3Department of Chemistry, Adama Science and Technology University, P.O. Box: 1888, Adama, Ethiopia.
DOI : http://dx.doi.org/10.13005/ojc/290339
Article Received on :
Article Accepted on :
Article Published : 28 Oct 2013
The aims of this study were to investigate the chemical constituents of the hydrodistilled oil and n- hexane extract of L. inermis leaves. The essential oil of L. inermis leaves was analyzed using GC-MS and revealed the presence of twenty eight components. Nine components comprising 80.6% of the total oil have been identified by MS, spectral data and by comparison with literature. According to the GC-MS results, eugenol, hexadecanoic acid, phytol, α-terpineol and etherphenylvinyl were the major components of the oil. Bisabolene was isolated from n- hexane extract and its structure was elucidated by NMR technique.
KEYWORDS:Lawsonia inermis;chemical constituents;eugenol;GC-MS; bisabolene
Download this article as:| Copy the following to cite this article: Kidanemariam T. K, Tesema T. K, Asressu K. H, Boru A. D. Chemical Investigation of Lawsonia inermis L. Leaves from Afar Region, Ethiopia . Orient J Chem 2013;29(3). doi : http://dx.doi.org/10.13005/ojc/290339 |
| Copy the following to cite this URL: Kidanemariam T. K, Tesema T. K, Asressu K. H, Boru A. D. Chemical Investigation of Lawsonia inermis L. Leaves from Afar Region, Ethiopia . Orient J Chem 2013;29(3). Available from: http://www.orientjchem.org/?p=339 |
INTRODUCTION
Lawsonia inermis Linn (Henna) belongs to the family Lythreaceae and the sole member of its genus Lawsonia. It is glabrous branched shrub or small tree (2 to 6 m in height). The leaves are small, sub-sessile and greenish brown to dull green in color, and have either a glabrous, obtuse or acute apex with a tapering base. Flowers are small of redor rose color1. Henna can only grow where minimum temperatures stay above 11 oC. It tolerates extreme heat and long droughts. Lawsonia inermis Linn (L. inermis) grows wild near desert oasis, and in semiarid regions. It thrives in alluvial soils, where there is annual precipitation of 0.2 to 0.4 m and a soil pH of 4.3 to 8.0. L. inermis Linn is a perennial shrub native to North Africa, Asia and Australia and it is naturalized and cultivated in the tropics of America, Egypt, India and parts of the Middle East2. It is commonly known as henna in Arabic and mehndi in Hindi. Also known as Ei-Henna, Egyptian priest, and mignonette tree. The species is sometimes classified as La Sonia alba Lam or Lawsonia reba reaching a height of up to 6 m and has fragrant white or rose- red flowers3.
L. inermis Linn is one such plant known since with healing attributes and is now the subject of intense scientific study4-8. The leaves are used in the treatments of wounds, ulcers, cough, bronchitis, lumbago, rheumatagia, inflammations, diarrhoea, dysentry, leucoderma, scabies, boils, anaemia, haemorrhages, fever, falling of hair and greyness hair9-10.
L. inermis Linn is a worldwide known cosmetic agent used to stain hair, skin and nails11. The plant leaf contains a red-orange color component, lawsone (2-hydroxy-1, 4-napthoquinone), which is also known as hennotannic acid. Soil and moisture affects henna’s Lawsone levels. Dry, hot, iron bearing soils produce henna with high Lawsone levels. Moist fertile soils produce henna with lower level of Lawsone12. Lawsone is the chief constituent responsible for the dying properties of the plant. Dried powdered leaves of henna contain about 0.5-1.5% lawsone, traditionally used to produce color fast orange, red and brown dyes. In Ethiopia, L. inermi Linn is traditionally used to develop a red or black coloring to hands, feet and hair in some occasions such as weddings and religious festivals. Although, numerous researchers have reported the antimicrobial activity and chemical composition of L. inermis grown worldwide, there was no previous report on chemical studies of L. inermis Linn species which grown in Ethiopia. The paucity of chemical data of Ethiopian L. inermis Linn promoted into an investigation. Therefore, the aim of this study was to investigate the chemical composition of L. inermis Linn leaves by using GC-MS and NMR spectroscopic methods.
EXPERIMENTAL
Plant Collection and Identification
Matured leaves of L. inermis Linn were collected from the trees growing around Asayta distinct, Afar region, North Eastern Ethiopia in December, 2009. The plant was identified by Mr. Abdurasek Abdulahi, department of plant science; college of Agriculture, Haramaya University and deposited in the Herbarium of the University for future reference with suitable herbarium specimen code.
Extraction of Essential Oil
The leaves were separated from the stalks thoroughly washed with tap water and rinsed with distilled water. The cleaned leaves were dried in a shady and aerated at room temperature until the weight was stable. The air dried leaves were powdered into small pieces using analytical mill. A 300 g of the leaves powder were hydrodistilled for 3 h using Clevenger’s (Bibby Sterilin Ltd, Quickfit, England) to give a mixture of oil and aqueous13. The distillate was poured in to a separatory funnel contained 100 mL of chloroform (99.96%, Analytical reagent, Fisher Scientific UK Limited). The lower phase that contains the essential oil was separated from the upper one by using separatory funnel. Rotary evaporator was used to remove the solvent from the extract at 35 oC temperature and under reduced pressure. The oil collected was dried on anhydrous sodium sulphate, weighed to yield 0.3% (w/w) of yellowish volatile oil with characteristic smell and stored at low temperature (4 °C) until analysis.
GC and GC-MS Analysis of the Essential Oils
GC-MS analysis was performed using a Clarus 600 GC-MS fitted with a HP-5MS capillary column (30 m x 0.25 mm coated with 5% phenyl methylsiloxane, film thickness 0.25 µm). The GC oven temperature was programmed from 50 oC –250 oC at a rate of 5 oC/min. The injector and detector temperature was maintained at 250 oC. Helium was used as the carrier gas at a flow rate of 1 mL/min. The mass spectrometer was operated at electrum impact of 70 eV with ion source temperature of 230 oC. The constituents of the leaf were identified by comparing of their mass fragmentation (MS) patterns with those gathered in the library of NIST-MS and with those reported in the literature (13-14).
Extraction and Isolation of the Compound
A 400 g of the air-dried leaves were pulverized and extracted three times with n– hexane (ACS grade, Northampton, U.K) for 24 h. it was then filtered and concentrated to dryness under reduced pressure to give 12 g of the crude extract. The hexane extract (10 g) was applied on the top of the column chromatography (5 x 60 cm, Quickfit, England) by adsorbing on silica gel which was previously packed column with silica gel S (60 g, 63-200 µm, 70-230 mesh ASTM, Riedel-deHaen, Germany) in n-hexane and purified by increasing n-hexane /ethyl acetate (ACS grade, Northampton, U.K) solvent mixtures. Each fraction was then concentrated using a rotary evaporator under reduced pressure and temperature. The purity of different fractions was analyzed by TLC (pre-coated PLC plates, Al2O3 150 F-254, 20×20 size, layer thickness 1.5 mm, glass support, Merck, Darmstadt ,Germany) and spots were visualized by exposing under UV light (254 nm and 365) and spraying with H2SO4. Fraction 1 revealed the presence of two spots. They were not further investigated due to poor yield. Fraction 2 and 3 afforded compound LL*A1 (120 mg). The isolated compounds were then carefully dried in a freeze-drier and weighed.
Analysis of the Isolated Compound
NMR spectra were recorded on a Bruker Advance instrument (400 MHz and 100 MHz) and with TMS as an internal standard (chemical shifts in δ, ppm). The isolated compound was dissolved in CDCl3 and analyzed with One-dimensional NMR (proton 1H, carbon 13C) and two-dimensional NMR measurements (including COSY, HSQC, and HMBC) were performed in order to identify the compounds. At least 10 mg of the pure compound was required for structural elucidation.
RESULTS AND DISCUSSION
Essential Oil Composition
The GC-MS analysis revealed that the presence of at least twenty eight of components in L. inermis Linn leaves. Nine compounds were indentified; representing 80.6% of the total oil (Table 1). The major constituents are listed in order of their elution from a HP-5MS capillary column as shown in Figure 1 and Table 1 . The constituents of the oil were eugenol (17.6%), hexadecanoic acid (15.1%), Phytol (10.2%), α-terpineol (8.4%) and Etherphenylvinyl (6.7%). Of these major constituents, eugenol, hexadecanoic acid, phytol and α-terpineol are relatively common for essential oils of higher plants. In the earlier report, from the essential of L. inermis Linn leaves, α-terpineol13 and Phytol14 were reported as the major constituents. It is necessary to point out that the chemical compounds of any plant essential oil can vary greatly depending upon geographical region, the age of the plant, local climate, seasonal variations, experimental conditions and genetic difference are responsible for the changes in the types of chemical compounds15.
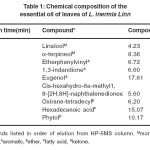 |
Table 1: Chemical composition of the essential oil of leaves of L. inermis Linn: Click here to View table |
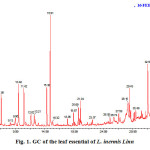 |
Fig. 1. GC of the leaf essential of L. inermis Linn |
Structure Elucidation
The leaves of L. inermis Linn were extracted with n- hexane at room temperature followed separation by column chromatography using n-hexane-ethyl acetate solvent system which led to isolation and structure elucidation of one compound labeled as LL*A1. TLC analysis of n-hexane extract using hexane/ethyl acetate (7:3) solvent system revealed the presence of four major spots. The compound (LL*A1) was fully characterized using NMR techniques. The 1H-NMR spectrum depicts two clearly separated regions, one in the olefin region from δ 5.1 to 5.2 and the other in the aliphatic region from δ 1.6 to 2.2.
There are three protons in the region from δ 5.1 to 5.2. The 1H -NMR spectrum showed the presence of a trisubstituted olefinic proton of H-2, H-8 and H-10 at δ 5.1 (dd), δ 5.1(dd) and δ 5.2 (d) and four tertiary methyl groups at δ 1.60 (Me-12), δ 1.73 (Me- 13), δ 1.60 (Me-14) and δ 1.60 (Me-15), respectively. A sharp singlet at δ 1.60 is integrated for nine protons that are for three methyl groups in the same chemical shift. Furthere more, a multiplet peak from δ 1.96-2.14 were integrated for nine protons. The 13C-NMR spectrum of compound LL*A1 also strengthens the fact that there are two different chemical shift regions, one from δ 124.3 to 134.9 which is for the olefinic carbons region and the other from δ 16.0 to 39.8 which is for the aliphatic group. The13C-NMR spectrum of compound LL*A1 is therefore in line with 1H- NMR spectrum. The region from δ 16.0 to 39.8 has nine carbon atoms. The longest peak with two carbon atoms at δ 39.8 is for two carbon atoms that overlapped. The region from δ 124.3 to 134.9 is that of olefinic carbons of compound LL*A1. In the 13C-NMR spectrum, there are six carbons in the olefinic region. Therefore, compound LL*A1 has a total of fifteen carbon atoms. Using information from the 1H -NMR spectrum and 13C-NMR spectrum made us deduce that the molecular formula of compound LL*A1 is C15H24. These data implies that compound LL*A1 was presumed to be a sesquiterpene. The DEPT spectrum showed twelve peaks corresponding to twelve carbon atoms. The compound has four methyl groups at δ 17.7, 25.8, 16.1, and 16.0. The difference in the number of carbon atoms of the 13C-NMR spectrum and the DEPT spectrum is three, compound LL*A1 has three quaternary carbon atoms at δ 134.9, 134.7, and 130.9. There are five methylene carbons at δ 39.8, 39.8, 28.3, 26.8, and 26.7. The Longest peak at δ 39.8 tells us there is overlapping of two methylene carbons in the same chemical shift. There are three methine groups at δ 124.5, 124.4, and 124.3.
The protons located at the adjacent carbons were assigned by performing a standard COSY experiment. The COSY interactions of H-1 with H-2 and H-6, H-2 with H-3, H-5 with H-6, H-8 with H-9 and H-9, H-9 with H-10 led to formulate the side chain as depicted in the structure. The 1H-1HCOSY spectrum showed that the H-8 coupled to the H-10. Moreover, the methine proton at δ 5.1 (d) was coupled to the methy group (H3-12). Additionally, in the 1H-1H COSY spectrum exhibited that the methyl singlet (δ 1.60, H3-13) was coupled to another methylene multiplet centered (δ 1.96-2.14, H2-9). The Hetronuclear Single Quantum Correlation (HSQC) experiment correlates the chemical shift of proton (s) with the chemical shift of directly bonded carbon atom (s). The HSQC spectra of LL*A1 indicated that two olefinic protons at δ 5.1 were directly bonded to the carbon signals at δ 124.5 (C-8) and 124.4 (C-10), respectively. Additionally, the HSQC spectra LL*A1 showed that one olefinic proton at δ 5.2 was directly attached to carbon at δ 124.3 (C-2). Methyl groups were also identified by the correlation of the proton signals at δ 1.60, δ 1.73, δ 1.60 and δ 1.60 directly bonded carbon signals at δ 17.7 (C-12), δ 25.8 (C-13), δ 16.1 (C-14), and δ 16.0 (C-15), in the 13C-NMR spectrum, respectively. Besides, nine protons with multiplet peak from δ 1.96-2.14 were attached to carbon signals at δ 39.8, 39.8, 28.3, 26.8, and 26.7.
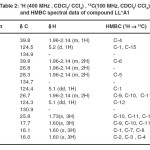 |
Table 2: 1H (400 MHz , CDCl3/ CCl4) , 13C(100 MHz, CDCl3/ CCl4) and HMBC spectral data of compound LL*A1. |
Hetronuclear multiple bond correlation (HMBC) experiment gives information about coupling of hydrogen and carbons that are two or three bond away. The HMBC spectrum of LL*A1 correlation between carbons and protons is presented in Table 2
In the HMBC spectrum , it was observed that two of the allylic methyl groups at δ 1.73 (H3-12) and δ 1.60 (H3-13) exhibited long range couplings with each other and also with the olefinic methine doublet of doublet at δ 5.1 (H-10). In addition, each of these methyl signals was coupled to the olefinic quaternary carbon at δ 130.9 (C-11) in the HMBC spectrum. This clearly indicated that these two methyl groups must be geminal and connected to the olefinic quaternary carbon that itself was connected to the olefinic methine carbon. The methyl group at δ 1.60 (H3-15) exhibited long range coupling with the olefinic methine carbon at δ 124.5 (C-2) and olefinic quaternary carbon at δ 134.9 (C-3). Furthermore, this methyl signal was coupled to the methylene carbon at δ 39.8 (C-4). Another methyl signal at δ 1.60 (H3-14) was coupled to one olefinic carbon at δ 124.4 (C-8), as well as to the olefinic quaternary carbon at δ 134.7 (C-7). In the HMBC spectrum, this methyl group also coupled to the aliphatic methine carbon at δ 39.8 (C-1). Additional coupling correlations were observed between the methylene multiplet (δ 1.96-2.14, H2-4) with the methylene carbon at δ 28.3 (C-6) (Figure 2). The assignment of all the protons and carbons by 1D and 2D NMR spectra confirmed that compound LL*A1 was bisabolene (Figure 3).
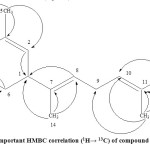 |
Fig. 2. Important HMBC correlation (1H→ 13C) of compound LL*A1. |
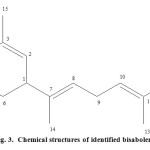 |
Fig. 3. Chemical structures of identified bisabolene Click here to View figure |
ACKNOWLEDGEMENTS
We wish to thank Professor Wondimagegn Mamo and Mr. Yoseph Atilaw for running NMR spectra. Mr. Lemisa, Ambo University, laboratory technician, had helped in running GC-MS. The financial assistance from Ministry of Education of Ethiopia is gratefully acknowledged.
REFERENCES
- Chauhan, M.G., Pillai, A.P., Microscopic profile of powdered drug used in Indiansystem of medicine Vol. II, Gujarat Ayurved University, Jamnagar, Gujarat,84-85 (2007).
- Vasudevan T.N and Laddha K.S. Herbal drug microscopy. Yucca publishing house,Dombivli, New Delhi, 68-69 (2003).
- Simon, J.E., Cahadwick A.F and Craker L.E. Herbs: an indexed bibliography, 1971-1980. The scientific literature on selected herbs, aromatic and medicinal plants of the temperate zone. Archon books press, Center for New Crops and Plant Products, Department of Horticulture and Landscape Architecture, Purdue University, West Lafayette, 770 (1984)
- Singh A. and Singh D.K. Indian J. Exp. Bio. 39:263-268 (2001).
- Azaizeh, H., Fulder, S., Said K. and Khalil O. Fitoterapia, 74: 98-108 (2003).
- Mitscher, L.A., Leu, R.P., Bathala, M.S., Wu, W.N. and Beal J.L. Lloydia, 35: 157-166 (1972).
- Cajkovac, M., Oremovic L. and Cajkovac V. Acta pharm. 46: 39-49 (1996).
- Malekzadeh F. and Shabestari P.P. J. Sci. Islamic Repub 1: 7-12 (1989).
- Shiharta, I.M., Hussain, A.G and Mayah G.Y. Egypt J. Vet. Sci. 15: 31(1978).
- Vaidyratnam P.S. Indian medicinal plants. A compendium of 500 species, Vol. III, Botanical Survery of India, Ministry of Environment and Forests, India, 303-304 (1995).
- Hanna R, Maciej J.N., Lapinsky L. and Adamowicz L. Spec. Act. 54: 1091-1103 (1998)
- Yogisha, S., Samiulla, D.S., Prashanth, D., Padmaja R. and Amit A. Fitoterapia. 73:690–691 (2002)
- Rahmat, A., Edrini, S., Ismail, P., Yun Hin T.Y. and Abu Bakar M.F. J. Bio. Sci. 6: 1005-1010 (2006).
- Oyedeji A. J. Essent. Oil Res. 1:1-3 (2005).
- Dafera D.J. and Ziogas B.N. J.Agr.Food. Chem. 48: 2576-2581 (2000).

This work is licensed under a Creative Commons Attribution 4.0 International License.


