Water Quality Analysis of Bibi Talav, Ahmedabad, Gujrat, India using Water Quality index
Salahuddin* and A. Vimala Rani
Department of Mathematics, AMET University, Kanathur, Chennai, Tamilnadu, India.
Corresponding Author E-mail: vsludn@gmail.com
DOI : http://dx.doi.org/10.13005/ojc/400334
Article Received on : 29 Feb 2024
Article Accepted on : 17 May 2024
Article Published : 07 Jun 2024
Reviewed by: Dr. Navin Sharma
Second Review by: Dr. Hiralal Yadav
Final Approval by: Dr. Charanjit Kaur
Water is very crucial liquid which has the potential to fluidly various materials along with biological and mineral substances. The condition of water usually indicates to the substance of water exist at the peak level for sufficient rise of plants and animals. The Bibi talav, Ahmedabad, Gujarat, India is situated at favela location. People discharge their domiciliary ravage unswervingly into the talav water forging environmental imperilment. The motive of this research paper is to establish the water quality index. Numerous physical and chemical parameters such as pH(BPH), Electrical Conductivity (BEC), Turbidity(BTD), Total dissolved solids(BTDS), Alkalinity(BAL), Total Hardness(BTH), Calcium(BCA), Chloride(BCL), Magnesium(BMG), Total dissolved Oxygen(BDO), Sodium(BSOD), Nitrates(BN) and Biochemical Oxygen demand (BBOD) of talav water is examined during three sessions such as monsoon, winter and summer. After calculating water quality index it shows that Bibi talav water is dangerous for drinking and survival of water borne species because the water quality index is above 75. This shows that water is unsuitable for drinking throughout the year.
KEYWORDS:Bibi Talav; Collection of samples; Water quality index
Download this article as:| Copy the following to cite this article: Salahuddin S, Rani A. V. Water Quality Analysis of Bibi Talav, Ahmedabad, Gujrat, India using Water Quality index. Orient J Chem 2024;40(3). |
| Copy the following to cite this URL: Salahuddin S, Rani A. V. Water Quality Analysis of Bibi Talav, Ahmedabad, Gujrat, India using Water Quality index. Orient J Chem 2024;40(3). Available from: https://bit.ly/3Vb1WaA |
Introduction
For the survival of life water is one of the most crucial substances for the entire creature in the earth [3-6]. The earth is the only planet which covered 70% of water. By virtue of elevated human population, industrial actions and human discharges and other activities water is being contemned. So it is essential to examine water because drink of contaminated water is very dangerous for the health of human being. By drinking contaminated water the creature can be affected by water borne diseases which are very hazardous. Good quality of water can prevent diseases and improve quality of life. Natural water consists of various variety of contamination such as depreciation of rocks and percolate of solids, disintegration sprinkler particles from the surrounding spaces and human activities. Discharge particles from industry are the main cause of water contamination. Water must be examined for different physic-chemical parameters for the safety of drinking purposes. Water contains numerous types of hovering, diluted, dangling and microbiological impurities. Due to this the water quality is worsen day by day for drinking purposes. For improving the water quality it is essential to examine the physic-chemical parameters of water such as pH, Electrical Conductivity, Turbidity), Total dissolved solids, Alkalinity, Total Hardness, Calcium, Chloride, Magnesium, Total dissolved Oxygen, Sodium, Nitrates and Biochemical Oxygen demand . After examine suitable measurement should be needed so that water quality will be improved for drinking purposes.
Various procedures are obtainable to examine the water quality data to get a conclusion. Water quality index method is very useful method for examine the water quality and it gives the result whether the water is good or bad for drinking purposes.
The main dogma of this investigation is to develop an overall picture of the Bibi Talav water using water quality index and establish a result whether it is suitable for drinking purposes or not.
Materials and Methods
Selected Area
The Bibi Lake is a natural lake. It is situated at Saiyedwadi, Isanpur, Ahmedabad, Gujarat. Its distance from Amraiwadi Metro station is 3.47 kilometers and from Vatva railway station is 0.54 kilometers. Its co-ordinates are 22°57’54″N and 72°36’30″E.
Collection of Samples
Water samples are collected from seven locations of Bibi Talav into tight fit plastic container to keep away from vaporization.
Sampling Procedure
To recognize the usefulness of Talav water the chemical- physical parameters which is scrutinized are pH(BPH), Electrical Conductivity (BEC), Turbidity(BTD), Total dissolved solids(BTDS), Alkalinity(BAL), Total Hardness(BTH), Calcium(BCA), Chloride(BCL), Magnesium(BMG), Total dissolved Oxygen(BDO), Sodium(BSOD), Nitrates(BN) and Biochemical Oxygen demand (BBOD) and illustrated in table (1-3) and graphically interpreted in fig(1-3).
For the measurement of pH (HPH), pH meter is used. Apex Hanna Electrical Conductivity (EC) Meter, EC-03 is used for measuring Electrical Conductivity (BEC). Turbidity (BTD) is measured using a Turbidity Meter WAG-WT30020. For determining Total Dissolved Solids (BTDS) TDS meter (Themisto TH-TDS10) is used. For determining Alkalinity (BAL) titration method is involved. Total Hardness (BTH) is measured by colorimetric titration with EDTA solution (Model HA-71A). Photometer (Model- HI97720) is involved for determining Calcium (BCA) and Magnesium (BMG). For determining Chloride (BCL) Chloridometer(Model 3400, ELITechGroup Inc ) is used. Measurement of Dissolved Oxygen (BDO) is done by Winkler’s method. Flame Photometer (Sherwood Model 410) is used for measuring Sodium (BSOD). Nitrates (BN) are determined by phenol disulphonic acid method. Tinometer Oxidirect(Model BD 600) is used for measuring Biochemical Oxygen demand (BBOD).
The below method is established for estimating Water Quality Index which is developed by Brown et. al.[2].
Calculate the unit weight(Wn) factors for each parameters by using the formula.

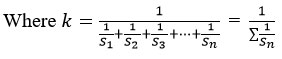
Sn = Standard desirable value of the nth parameters.(WHO)
On summation of all selected parameters unit weight factors, Wn = 1.
Calculate the Sub- index (Qn) value by using the formula
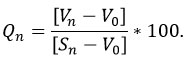
Where Vn mean concentration of nth parameters.
Sn = Standard desirable value of the nth parameters.
V0 = Actual values of the parameters in Pure water (generally V0 = 0, for most parameters except pH).
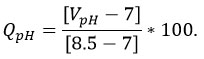
For pH,
Combining a and b, WQI is calculated as follows
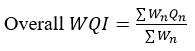
The calculated water quality index is represented in Table (4-6) and the status of the water quality index is represented in Table 7.
Table 1: Water Quality at different locations of Bibi Talav in monsoon season (Laboratory Analysis).
|
Name of Station |
BPH |
BEC |
BTD |
BTDS |
BAL |
BTH |
BCA |
BCL |
BMG |
BDO |
BSOD |
BN |
BBOD |
|
BL1 |
8.8 |
3.13 |
17.2 |
958 |
242 |
279 |
46.2 |
99 |
33.2 |
4.74 |
45.3 |
8.7 |
1.19 |
|
BL2 |
9.0 |
3.16 |
16.1 |
960 |
240 |
277 |
47.4 |
97 |
32.2 |
4.71 |
43.2 |
8.6 |
1.21 |
|
BL3 |
8.7 |
3.10 |
18.0 |
956 |
239 |
275 |
44.3 |
98 |
34.4 |
4.72 |
46.3 |
8.3 |
1.15 |
|
BL4 |
8.9 |
3.14 |
19.2 |
958 |
243 |
276 |
49.5 |
96 |
33.2 |
4.75 |
42.2 |
8.9 |
1.18 |
|
BL5 |
8.6 |
3.09 |
17.3 |
954 |
244 |
278 |
48.3 |
99 |
35.3 |
4.72 |
47.4 |
8.5 |
1.17 |
|
BL6 |
8.8 |
3.12 |
16.2 |
957 |
238 |
279 |
46.2 |
97 |
33.4 |
4.73 |
41.3 |
8.8 |
1.21 |
|
BL7 |
9.1 |
3.16 |
14.3 |
960 |
239 |
278 |
44.3 |
96 |
34.2 |
4.71 |
48.2 |
8.6 |
1.23 |
Table 2: Water Quality at different locations of Bibi Talav in winter season (Laboratory Analysis)
|
Name of Station |
BPH |
BEC |
BTD |
BTDS |
BAL |
BTH |
BCA |
BCL |
BMG |
BDO |
BSOD |
BN |
BBOD |
|
BL1 |
8.3 |
3.10 |
19.2 |
1065 |
190 |
250 |
39.3 |
98 |
35.4 |
5.34 |
40.4 |
8.4 |
2.26 |
|
BL2 |
8.5 |
3.05 |
18.3 |
1056 |
189 |
248 |
38.6 |
97 |
33.5 |
5.42 |
46.3 |
8.4 |
2.18 |
|
BL3 |
8.2 |
3.06 |
20.4 |
1058 |
194 |
258 |
36.8 |
96 |
34.9 |
5.48 |
41.2 |
8.2 |
2.22 |
|
BL4 |
8.4 |
3.03 |
18.8 |
1067 |
195 |
249 |
34.7 |
94 |
36.2 |
5.39 |
39.5 |
7.9 |
2.32 |
|
BL5 |
8.2 |
3.09 |
18.7 |
1058 |
189 |
257 |
39.2 |
98 |
32.4 |
5.48 |
37.9 |
8.0 |
2.18 |
|
BL6 |
8.1 |
3.08 |
18.4 |
1069 |
187 |
253 |
38.5 |
96 |
31.5 |
5.41 |
43.2 |
7.8 |
2.23 |
|
BL7 |
7.8 |
3.05 |
19.5 |
1067 |
196 |
259 |
37.2 |
97 |
32.4 |
5.43 |
42.5 |
8.1 |
2.24 |
Table 3: Water Quality at different locations of Bibi Talav in summer season (Laboratory Analysis).
|
Name of Station |
BPH |
BEC |
BTD |
BTDS |
BAL |
BTH |
BCA |
BCL |
BMG |
BDO |
BSOD |
BN |
BBOD |
|
BL1 |
9.5 |
3.55 |
26.5 |
1250 |
276 |
235 |
31.2 |
103.4 |
31.4 |
3.40 |
53.3 |
7.2 |
2.45 |
|
BL2 |
9.1 |
3.49 |
23.8 |
1253 |
267 |
234 |
32.4 |
101.4 |
33.1 |
3.38 |
55.9 |
7.8 |
2.34 |
|
BL3 |
9.6 |
3.59 |
24.9 |
1249 |
271 |
242 |
34.8 |
99.8 |
30.9 |
3.42 |
52.2 |
7.5 |
2.34 |
|
BL4 |
9.1 |
3.57 |
25.2 |
1261 |
265 |
241 |
35.2 |
105.2 |
29.8 |
3.45 |
55.3 |
7.1 |
2.42 |
|
BL5 |
8.9 |
3.59 |
23.9 |
1256 |
272 |
238 |
33.8 |
101.2 |
32.5 |
3.36 |
52.5 |
6.9 |
2.46 |
|
BL6 |
9.6 |
3.50 |
25.4 |
1253 |
278 |
236 |
36.2 |
103.2 |
33.2 |
3.39 |
53.6 |
6.7 |
2.48 |
|
BL7 |
9.1 |
3.52 |
22.9 |
1249 |
269 |
237 |
31.9 |
98.6 |
31.6 |
3.45 |
50.2 |
7.5 |
2.39 |
 |
Figure 1: Graphical representation of Water Quality at different locations of Bibi Talav in monsoon season |
 |
Figure 2: Graphical representation of Water Quality at different locations of Bibi Talav in winter season |
 |
Figure 3: Graphical representation of Water Quality at different locations of Bibi Talav in summer season |
Table 4: Water Quality Index (Monsoon)
|
Parameters |
Sn |
1/Sn |
∑1/Sn |
k=1/∑1/Sn |
Wn=k/Sn |
V0 |
Vn |
[Vn-V0]/ [Sn-V0] |
Qn |
Wn Qn |
|
BPH |
8.5 |
0.117647 |
0.744908 |
1.342448 |
0.157935 |
7 |
8.842857 |
1.228571 |
122.8571 |
19.40345 |
|
BEC |
500 |
0.002 |
0.744908 |
1.342448 |
0.002685 |
0 |
3.128571 |
0.006257 |
0.625714 |
0.00168 |
|
BTD |
5 |
0.2 |
0.744908 |
1.342448 |
0.26849 |
0 |
16.9 |
3.38 |
338 |
90.74947 |
|
BTDS |
500 |
0.002 |
0.744908 |
1.342448 |
0.002685 |
0 |
957.5714 |
1.915143 |
191.5143 |
0.514196 |
|
BAL |
100 |
0.01 |
0.744908 |
1.342448 |
0.013424 |
0 |
240.7143 |
2.407143 |
240.7143 |
3.231464 |
|
BTH |
200 |
0.005 |
0.744908 |
1.342448 |
0.006712 |
0 |
277.4286 |
1.387143 |
138.7143 |
0.931083 |
|
BCA |
75 |
0.013333 |
0.744908 |
1.342448 |
0.017899 |
0 |
46.6 |
0.621333 |
62.13333 |
1.112143 |
|
BCL |
200 |
0.005 |
0.744908 |
1.342448 |
0.006712 |
0 |
97.42857 |
0.487143 |
48.71429 |
0.326982 |
|
BMG |
150 |
0.006667 |
0.744908 |
1.342448 |
0.00895 |
0 |
33.7 |
0.224667 |
22.46667 |
0.201069 |
|
BDO |
7.5 |
0.133333 |
0.744908 |
1.342448 |
0.178993 |
0 |
4.725714 |
0.630095 |
63.00952 |
11.27827 |
|
BSOD |
200 |
0.005 |
0.744908 |
1.342448 |
0.006712 |
0 |
44.84286 |
0.224214 |
22.42143 |
0.150498 |
|
BN |
10 |
0.1 |
0.744908 |
1.342448 |
0.134245 |
0 |
8.628571 |
0.862857 |
86.28571 |
11.58341 |
|
BBOD |
6.9 |
0.144928 |
0.744908 |
1.342448 |
0.194558 |
0 |
1.191429 |
0.172671 |
17.26708 |
3.359443 |
|
Total |
142.8431 |
|||||||||

Table 5: Water Quality Index (winter)
|
Parameters |
Sn |
1/Sn |
∑1/Sn |
k=1/∑1/Sn |
Wn=k/Sn |
V0 |
Vn |
[Vn-V0]/ [Sn-V0] |
Qn |
Wn Qn |
|
BPH |
8.5 |
0.117647 |
0.744908 |
1.342448 |
0.157935 |
7 |
8.214286 |
0.809524 |
80.95238 |
12.78522 |
|
BEC |
500 |
0.002 |
0.744908 |
1.342448 |
0.002685 |
0 |
3.065714 |
0.006131 |
0.613143 |
0.001646 |
|
BTD |
5 |
0.2 |
0.744908 |
1.342448 |
0.26849 |
0 |
19.04286 |
3.808571 |
380.8571 |
102.2562 |
|
BTDS |
500 |
0.002 |
0.744908 |
1.342448 |
0.002685 |
0 |
1062.857 |
2.125714 |
212.5714 |
0.570732 |
|
BAL |
100 |
0.01 |
0.744908 |
1.342448 |
0.013424 |
0 |
191.4286 |
1.914286 |
191.4286 |
2.569829 |
|
BTH |
200 |
0.005 |
0.744908 |
1.342448 |
0.006712 |
0 |
253.4286 |
1.267143 |
126.7143 |
0.850537 |
|
BCA |
75 |
0.013333 |
0.744908 |
1.342448 |
0.017899 |
0 |
37.75714 |
0.503429 |
50.34286 |
0.901102 |
|
BCL |
200 |
0.005 |
0.744908 |
1.342448 |
0.006712 |
0 |
96.57143 |
0.482857 |
48.28571 |
0.324105 |
|
BMG |
150 |
0.006667 |
0.744908 |
1.342448 |
0.00895 |
0 |
33.75714 |
0.225048 |
22.50476 |
0.20141 |
|
BDO |
7.5 |
0.133333 |
0.744908 |
1.342448 |
0.178993 |
0 |
5.421429 |
0.722857 |
72.28571 |
12.93864 |
|
BSOD |
200 |
0.005 |
0.744908 |
1.342448 |
0.006712 |
0 |
41.57143 |
0.207857 |
20.78571 |
0.139519 |
|
BN |
10 |
0.1 |
0.744908 |
1.342448 |
0.134245 |
0 |
8.114286 |
0.811429 |
81.14286 |
10.893 |
|
BBOD |
6.9 |
0.144928 |
0.744908 |
1.342448 |
0.194558 |
0 |
2.232857 |
0.323602 |
32.36025 |
6.295934 |
|
Total |
150.7278 |
|||||||||

Table 6: Water Quality Index (summer)
|
Parameters |
Sn |
1/Sn |
∑1/Sn |
k=1/∑1/Sn |
Wn=k/Sn |
V0 |
Vn |
[Vn-V0]/ [Sn-V0] |
Qn |
Wn Qn |
|
BPH |
8.5 |
0.117647 |
0.744908 |
1.342448 |
0.157935 |
7 |
9.271429 |
1.514286 |
151.4286 |
23.91588 |
|
BEC |
500 |
0.002 |
0.744908 |
1.342448 |
0.002685 |
0 |
3.544286 |
0.007089 |
0.708857 |
0.001903 |
|
BTD |
5 |
0.2 |
0.744908 |
1.342448 |
0.26849 |
0 |
24.65714 |
4.931429 |
493.1429 |
132.4037 |
|
BTDS |
500 |
0.002 |
0.744908 |
1.342448 |
0.002685 |
0 |
1253 |
2.506 |
250.6 |
0.672835 |
|
BAL |
100 |
0.01 |
0.744908 |
1.342448 |
0.013424 |
0 |
271.1429 |
2.711429 |
271.1429 |
3.639951 |
|
BTH |
200 |
0.005 |
0.744908 |
1.342448 |
0.006712 |
0 |
237.5714 |
1.187857 |
118.7857 |
0.797318 |
|
BCA |
75 |
0.013333 |
0.744908 |
1.342448 |
0.017899 |
0 |
33.64286 |
0.448571 |
44.85714 |
0.802912 |
|
BCL |
200 |
0.005 |
0.744908 |
1.342448 |
0.006712 |
0 |
101.8286 |
0.509143 |
50.91429 |
0.341749 |
|
BMG |
150 |
0.006667 |
0.744908 |
1.342448 |
0.00895 |
0 |
31.78571 |
0.211905 |
21.19048 |
0.189647 |
|
BDO |
7.5 |
0.133333 |
0.744908 |
1.342448 |
0.178993 |
0 |
3.407143 |
0.454286 |
45.42857 |
8.131398 |
|
BSOD |
200 |
0.005 |
0.744908 |
1.342448 |
0.006712 |
0 |
53.28571 |
0.266429 |
26.64286 |
0.178833 |
|
BN |
10 |
0.1 |
0.744908 |
1.342448 |
0.134245 |
0 |
7.242857 |
0.724286 |
72.42857 |
9.723158 |
|
BBOD |
6.9 |
0.144928 |
0.744908 |
1.342448 |
0.194558 |
0 |
2.411429 |
0.349482 |
34.94824 |
6.799447 |
|
Total |
187.5987 |
|||||||||

Table 7: Water Quality Index (WQI) and status of water quality
|
WQI |
Quality of Water |
|
0-25 |
Very Good |
|
26-50 |
Good |
|
51-75 |
Poor |
|
Above 75 |
Very Poor(unsuitable for drinking) |
 |
Figure 4: Comparison of Water Quality Index |
Results and Discussion
In the present study, the result shows that maximum parameters are out of desirable limits prescribed by World Health organization which is proved by water quality index that the water is polluted and not useful for drinking purposes because water quality index is above 75. The Water Quality Index is very useful for the conclusion of the water quality for drinking purposes whether it is suitable or not. In this investigation, the water quality index of Bibi talab samples is found above 75 in all three season that is winter, summer and monsoon. A comparison is given in pictorial representation in figure 4. This shows that Bibi talav water is not suitable for drinking purposes.
Conclusion
The present investigation concluded that WQI of Bibi talav in three seasons are 150.7278 and 187.5987 which are above 75. More than 75 of water quality indicate that the water quality is unsuitable for drinking purposes. This is too high means that the water quality of Bibi Talav is highly polluted. Hence suitable measurement should be required for this tank water so that it can be suitable for drinking purposes.
Conflict of Interest
From the author side there is no conflict of interest regarding this research paper.
Funding Sources
There is no financial support regarding this manuscript.
References
- Brown, R. M., McClelland NI, Deininger RA, Tozer RG, Water quality index—do we dare? Water Sew Works , 1970, 117(10):339–343.
- Brown, R. M., McClelland, N.I., Deininger, R. A., O’Connor, M. F. , A water quality index—crashing the psychological barrier. Indicators of environmental quality, 1972, 173-182.
CrossRef - Horton, R. K., An index number system for rating water quality. J Water Pollut Control Fed 1965, 37(3), 300–306.
- Salahuddin, Water Quality Analysis of Hebbal Lake, Bangalore, Karnataka, India for the Survival of Fishes. Journal of Survey in Fisheries Sciences, 2023, 10(1S), 5489-5498.
- Salahuddin, Physico-chemical analysis of upper lake water in Bhopal region of Madhya Pradesh, India. Advances in Applied Science Research, 2014, 5(5), 165-169.
- Salahuddin, Analysis of electrical conductivity of ground water at different locations of Dildar Nagar of U.P, India, Advances in Applied Science Research, 2015, 6(7), 137-140.
- Salahuddin, Analysis of Magnesium contents of Ground water at surrounding areas of Dildar Nagar of U.P. India. International Journal of Innovative Research in Science, Engineering and Technology, 2020, 9(4), 1607-1610.
- APHA., Standard Methods for the Examination of Water and Wastewater. APHA-AWWA-WPCF, Washington D.C., 1998.
- Salahuddin and Husain, Intazar, Analysis of Katraj Lake Water in Pune Region of Maharashtra, India. International Journal of Lakes and Rivers.2020, 13(1), 27-34.

This work is licensed under a Creative Commons Attribution 4.0 International License.
About The Author
![]()
A New Edition of Web of Science
Journal Impact Factor
2022: 0.5
Five Year: 0.8
Journal is Indexed in

Cabells Whitelist
![]()


