Innovative Study on Photogalvanic Cell for Solar Energy Conversion and Storage Through Brilliant Cresyl Blue + Ascorbic Acid + Sodium Lauryl Sulphate
Renu Kumari , Sanjeev Kumar Yadav and RK Gunsaria*
Solar energy Laboratory, Department of Chemistry, University of Rajasthan, Jaipur, (Rajasthan), India.
Corresponding Author E-mail: dr.rkgunsaria_g007@yahoo.co.in
DOI : http://dx.doi.org/10.13005/ojc/400319
Article Received on : 10 Jan 2024
Article Accepted on : 11 May 2024
Article Published : 30 May 2024
Reviewed by: Dr. Ho Soon Min
Second Review by: Dr. K. R. Genwa
Final Approval by: Dr. Ravindra M Kumbhare
The current study reports better findings photogalvanic (PG) cell in order to accomplish this objective of providing the globe with pollution-free nature for sustainable development. The goal of the research is to increase electrical output by the use of PG cells, which will result in increased electrical output. Better PG cell output has been the desired goal of the research, and this has effectively proved the efficient system in an experimental way. The Open circuit voltage (Voc), and photocurrent found for the Brilliant Cresy Blue (BCB) + Ascorbic acid (AA) + Sodium Lauryl Sulphate (SLS) combination was 1124.0 mV and 240.00 µA, respectively. A proposed photochemical method for the conversion of solar radiation energy was offered for the current generation of PG cells. The BCB+AA+SLS system, PG cell configuration was used to get the desired electrical results.
KEYWORDS:Ascorbic acid; Brilliant Cresy Blue; photogalvanic cell; Sodium Lauryl Sulphate
Download this article as:| Copy the following to cite this article: Kumari R, Yadav K. Y, Gunsaria R. K. Innovative Study on Photogalvanic Cell for Solar Energy Conversion and Storage Through Brilliant Cresyl Blue + Ascorbic Acid + Sodium Lauryl Sulphate. Orient J Chem 2024;40(3). |
| Copy the following to cite this URL: Kumari R, Yadav K. Y, Gunsaria R. K. Innovative Study on Photogalvanic Cell for Solar Energy Conversion and Storage Through Brilliant Cresyl Blue + Ascorbic Acid + Sodium Lauryl Sulphate. Orient J Chem 2024;40(3). Available from: https://bit.ly/4aFbMqT |
Introduction
The photochemical reactions are important content for the solar energy, such as water photolysis and photosynthesis. In addition to unsafe operations and a polluted environment, non-renewable energy sources have their own disadvantages. The Fossil fuels (kerosene, coal, wood, etc.) are getting closer to being entirely exhausted as a result of human consumption. Therefore, creating alternative sources is required. The most practical alternative energy source is solar energy cells. The solar cells that have undergone the most in-depth investigation are PG cells. The PG cells are relevant to the photochemical nature.Thestudied-on PG cell in use of different surfactant in PG cell 1 for NaLS- Azur A- Glycerol (Gangotri, et al., 2003), Use about surfactant in PG cell 2 for Tx-100- Azur C – Glycerol (Gunsaria and Hussain, 2004) and the role of EDTA – Azure A -SLS scientific path 3 about energy was studied (Gunsaria and Hussain, 2004).
Role of oxalic acid reductant and brilliant cresyl photosensitizers 4 for good results (Gunsaria et al., 2005) and same way about cationic micelles effect on PG cells 5 for cetyl pyridinium chloride (CPC) with congo reddye +Xylose system (Gunsaria et al., 2012) also in favour to better finding. The research on mixed photosensitizer with MB system6 for glycol-NALS system for solar power conversion and storage (Gangotri and Mohan, 2022). The ionic micelles effect (positive ions) on PG cell7 for CPC system (Gunsaria & Meena 2012) and CMC studies of different surfactant, CTAB, Tween etc.8 by scientific method to explore its potential in PG cell (Tiwari, et al., 2020).
PG cells as better cell in spinach extract9 of different artificial dye and natural dye (Koli, 2014), The better results consultable development 10 for generation of current (Stevenson K., 1981), Enhanced electrical output by mixed surfactant for solar cells: EDTA+ NaLS+CPC+Tween-80 system 11 for TB photosensitizer (Meen et al., 2024), Use of oxalic acid as reductant and MB 12 as photosensitizer (Gangotri and Meena 2001), Sustainable and green chemistry approach 13 for PG cell s (Genwa and Genwa 2008), Studied on PG cell with DSS, Tartrazine and EDTA 14 for conversion solar energy and storage (Jayshree and Mohan 2018), followed by study of PG cell for electrical output 15 as same way by lauryl glucoside surfactant, Tartrazine photosensitizer and D-fructose reductant. (Jayshree et al., 2022).
A progressive study for a potential energy source using the photo-galvanic system D-Xylose+MB+Brij-35+NaLS (Lal and Gangotri, 2022) was conducted in light of recent innovative results about innovation better results 16 in PG cells. The results of this study were published in the “International journal of energy research” journal 17. EDTA-Alizarin cyanine green (ACG)-sodium stearate (SS) PG cell as an inventive study 18 in for better findings (Genwa and Prasad, 2023). A novel method for doing cutting-edge research on sustainable energy sources using a mixed surfactant system in an environmentally friendly setting. Pollution Science and Environment, (Lal and Gangotri, 2023) and reported results are published in “Environment science and pollution research” journal 19. Many surfactant-dye-reducing agents (SDR) have been used across the solar system, but none of those mentioned parties have given BCB+AA+SLS combination to any thought as an alternative way of enhancing electrical production. As a result, work on the current PG cell (BCB +AA+ SLS system) began.
Methodology
Solution preparations
All of the experiment’s approaches, including sodium hydroxide, BCB, and AA, were made with distilled water (DW) in order to produce results that were relevant. In each series of tests, oxalic acid was employed to standardize the solution containing sodium hydroxide. All of these solutions were stored in brown-colored bottles for non-reactive form from radiation.
 |
Scheme 1: Structure of BCB |
 |
Scheme 2: Structure of Ascorbic Acid (AA) |
 |
Scheme 3: Structure of SLS |
Methodology for set –up for BCB +AA+ SLS system
Experiment: The PG cell set-up consists of two electrodes, a digital pH metre, key of resistance, a carbon pot, and an ammeter. For improved electrical results, studies into the specially created H-shaped PG cell were conducted. During the experiment, the resistance key, micro-ammeter, 200 W electric lamp (which had a W filament), and both ends of the electrodes were connected to complete the solar circuit. The experiment’s light sources and radiation protection were set up using the water filter. The various solar parameters in a PG cell with a BCB+SLS+AA system was examined. The main effects of solar energy were examined by adjusting the PG cell’s various parameters. For the PG cell, distilled water, alkali, and a mixture of surfactant, reductant, and dye were combined in solution. The temperature in the system was 303 K, and the cell illumination time was 180.00 minutes during experimental process. The experimental setup (Fig.1) for BCB +AA+ SLS system is reported for better findings.
 |
Figure 1: Methodology for PG cell |
Results and Discussion
Variation about BCB concentration
The change of dye concentration for BCB +AA+ SLShas been investigated in the current study. The electrical results in the BCB +AA+ SLS system increase with an increase in BCB concentration, peaking at BCB X 10-4 M, and then begin to decline. Due to the hydrophobic character of toluidine blue, which results in a lower nature of BCB for the absorption of light, the electrical output is comparably low (BCB X 10-4 M). When BCB molecules are present in higher concentrations (BCB > 10-4 M), a substantial number of them crowd the surface of the absorbent. The best molecules are present when the BCB concentration is in the middle (BCB X 10-4 M), allowing the electromagnetic source to collision to molecules closest to the electrode and trigger photochemical reactions. For BCB variation on the PG system, the Open circuit voltage (Voc), Isc, Imax,Vpp, ipp,and Ppp are measured; the resulting values are 1124 mV, 220.0 mA, 240.0 mA, 624 mV, 100.0 mA, and 62.4 mW, respectively. In Table 1,6 and Figure 2-4, all outcomes that were observed are reported.
Table 1: Variation of BCB Concentration
|
Parameters |
BCB Dye X 10-4 M concentration |
||||
|
1.0 |
1.2 |
1.4 |
1.6 |
1.8 |
|
|
Vdark (mV) |
723 |
714 |
887 |
703 |
682 |
|
Vmax (mV) |
1142 |
1160 |
1176 |
1136 |
1113 |
|
Voc (mV) |
1116 |
1108 |
1124 |
1096 |
1087 |
|
imax (µA) |
210.0 |
220.0 |
240.0 |
220.0 |
200.0 |
|
isc or ieq (µA) |
190.0 |
200.0 |
220.0 |
200.0 |
180.0 |
|
Vpp (mV) |
585.0 |
570.0 |
624.0 |
574.0 |
596.0 |
|
ipp (µA) |
80.2 |
98.0 |
100.0 |
90.0 |
80.4 |
|
Ppp (µW) |
52.65 |
57.00 |
62.40 |
57.40 |
47.68 |
 |
Figure 2: Variation of photopotential(PP), photocurrent(PC) and power |
 |
Figure 3: Photocurrent power (i-v) of modified PG cell. |
 |
Figure 4: Performance of the PG cell |
Variation of SLS concentration
The PG cell with the BCB +AA+ SLS system tested the photo reactivity of SLS with electrical power. It was found that if the concentration of SLS was increased, the result would rise until a particular point before falling after that. For photophysical processes on the surface, the solubilization of the molecules was reduced at lower SLS concentrations (surfactants X 10-3 M). Higher surfactant concentrations (SLS >10-3 M) may reduce the electron carrier because there are significantly more surfactant molecules available for photophysical reactions in hydrophobic contact. The considerable electrical output was recorded at a surfactant concentration of M X10-3 M SLS, which is an intermediate range. The mixture of surfactants may produce better precipitation in PG cells than the precipitate from a single surfactant alone. Surfactant interaction at the micelles’ interface is to blame for this. For SLS variation on the PG system, the Open circuit voltage (Voc), Isc, Imax,Vpp, ipp,and Ppp are measured; the resulting values are 1124 mV, 220.0 mA, 240.0 mA, 624 mV, 100.0 mA, and 62.4 mW, respectively. Table 2, 8 and Figure 2-4 present all of the outcomes that were observed for system.
Table 2: Variation of SLS Concentration
|
Parameters |
SLS X 10-3 M concentration |
||||
|
0.4 |
0.6 |
0.8 |
1.0 |
1.2 |
|
|
Vdark (mV) |
704 |
731 |
887 |
725 |
682 |
|
Vmax (mV) |
1132 |
1151 |
1176 |
1155 |
1124 |
|
Voc (mV) |
1078 |
1112 |
1124 |
1131 |
1066 |
|
imax (µA) |
180.0 |
220.0 |
240.0 |
200.0 |
170.0 |
|
isc or ieq (µA) |
160.0 |
200.0 |
220.0 |
180.0 |
150.0 |
|
Vpp (mV) |
585.0 |
561.0 |
624.0 |
496.0 |
564.0 |
|
ipp (µA) |
80.0 |
98.0 |
100.0 |
90.0 |
80.0 |
|
Ppp (µW) |
46.80 |
56.10 |
62.40 |
49.60 |
45.10 |
Variation of AA concentration
The change of AA concentration for BCB +AA+ SLS system has been investigated in the current study. The observed results rise as AA concentration increases. When AA concentration is increased, the electrical output also progressively rises to a maximum value at AA X 10-3 M before falling off in the BCB+SLS+AA system. Comparatively less amounts of reductant EDTA are available for electron donation to BCB to produce the ionic nature at lower concentrations of AA. The quantity of AA molecules accessible for photophysical conversion to AA to create the cationic form, which inhibits the AA molecules, is larger at much higher concentrations of ethylene dimethyl tetraacetic acid (AA > 10-3 M). The reductant concentration is an intermediate range where satisfactory results are obtained. This can be explained by the presence of the ideal number of reductant molecules, which open up advantageous paths for semi- or leuco-forms of dye BCB molecules. The results showed that the deep sleep mode consumed only 10 mA of current, which is often far less than the system’s current usage. For AA variation on the PG system, the Open circuit voltage (Voc), Isc, Imax,Vpp, ipp,and Ppp are measured; the resulting values are 1124 mV, 220.0 mA, 240.0 mA, 624 mV, 100.0 mA, and 62.4 mW, respectively. In Table 3,7 and Figure 2-4, all outcomes that were observed are provided.
Table 3: Variation of Reductant Concentration (Ascorbic acid)
|
Parameters |
Ascorbic acid X 10-3 M concentration |
||||
|
0.2 |
0.4 |
0.6 |
0.8 |
1.0 |
|
|
Vdark (mV) |
703 |
729 |
887 |
713 |
698 |
|
Vmax (mV) |
1151 |
1169 |
1176 |
1160 |
1146 |
|
Voc (mV) |
1101 |
1109 |
1124 |
1118 |
1088 |
|
imax (µA) |
200.0 |
220.0 |
240.0 |
220.0 |
210.0 |
|
isc or ieq (µA) |
180.0 |
200.0 |
220.0 |
200.0 |
190.0 |
|
Vpp (mV) |
616.0 |
532.0 |
624.0 |
515.0 |
628.0 |
|
ipp (µA) |
80.0 |
98.0 |
100.0 |
90.0 |
80.0 |
|
Ppp (µW) |
49.28 |
53.20 |
62.40 |
51.50 |
50.24 |
Variation of pH range
In the current investigation, the concentration of hydrogen ions was recorded. As the basic nature (pH) increased, the current parameters were also gradually increased and reached an optimum value of a certain pH scale (pH=13.30), after which the BCB +AA+ SLS system decreased. Poor results are observed on a pH range between 12.64 and higher (pH > 13.30). In contrast, better outcomes are observed at the intermediate range (pH = 13.30). This is because dye molecules (BCB) have a nature that makes them superior for photochemical processes. For pH variation on the PG system, the Open circuit voltage (Voc), Isc, Imax,Vpp, ipp,and Ppp are measured; the resulting values are 1124 mV, 220.0 mA, 240.0 mA, 624 mV, 100.0 mA, and 62.4 mW, respectively. The pH variation in the BCB+SLS+AA system is shown in Table 4 and 9.
Table 4: Variation of NaOH Concentration (pH)
|
Parameters |
pH of Solution |
||||
|
13.24 |
13.27 |
13.30 |
13.33 |
13.26 |
|
|
Vdark (mV) |
729 |
706 |
887 |
717 |
732 |
|
Vmax (mV) |
1132 |
1162 |
1176 |
1148 |
1143 |
|
Voc (mV) |
1078 |
1114 |
1124 |
1109 |
1097 |
|
imax (µA) |
140.0 |
200.0 |
240.0 |
220.0 |
200.0 |
|
isc or ieq (µA) |
120.0 |
170.0 |
220.0 |
200.0 |
190.0 |
|
Vpp (mV) |
575.0 |
593.0 |
624.0 |
535.0 |
520.0 |
|
ipp (µA) |
60.0 |
80.0 |
100.0 |
90.0 |
80.90 |
|
Ppp (µW) |
34.50 |
47.44 |
62.40 |
53.50 |
52.00 |
Table 5: Pt electrode size (Length X Width) in cm and Area
|
Parameters |
pH of Solution |
||||
|
0.3 x0.2 (0.06 cm2) |
0.4 x0.2 (0.08 cm2) |
0.4 x0.3 (0.12 cm2) |
0.5 x0.3 (0.15 cm2) |
1.0 x1.0 (1.00 cm2) |
|
|
Vdark (mV) |
718 |
731 |
887 |
720 |
887 |
|
Vmax (mV) |
1148 |
1115 |
1176 |
1136 |
1176 |
|
Voc (mV) |
1101 |
1078 |
1124 |
1091 |
1124 |
|
imax (µA) |
150.0 |
200.0 |
240.0 |
200.0 |
240.0 |
|
isc or ieq (µA) |
14.50 |
185.0 |
220.0 |
195.0 |
220.0 |
|
Vpp (mV) |
595.0 |
500.0 |
624.0 |
531.0 |
624.0 |
|
ipp (µA) |
80.0 |
90.0 |
100.0 |
90.0 |
80.0 |
|
Ppp (µW) |
47.60 |
50.00 |
62.40 |
53.10 |
62.40 |
Table 6: Analysis of the Variation in the Chemical Composition of the BCB Photosensitizer
|
S. no. |
0.001 M BCB (ml) |
0.01 ML AA (ml) |
0.01 SLS (ml) |
1 M NaOH (ml) |
DDW (ml) |
BCB X 10-4 M |
AA X 10-3 M |
SLS X 10-3 M |
NaOH pH |
|
1. |
2.5 |
1.5 |
2.0 |
4.0 |
15.0 |
1.0 |
0.6 |
0.8 |
13.30 |
|
2. |
3.0 |
1.5 |
2.0 |
4.0 |
14.5 |
1.2 |
0.6 |
0.8 |
13.30 |
|
3. |
3.5 |
1.5 |
2.0 |
4.0 |
14.0 |
1.4 |
0.6 |
0.8 |
13.30 |
|
4. |
4.0 |
1.5 |
2.0 |
4.0 |
13.5 |
1.6 |
0.6 |
0.8 |
13.30 |
|
5. |
4.5 |
1.5 |
2.0 |
4.0 |
13.0 |
1.8 |
0.6 |
0.8 |
13.30 |
Table 7: Analysis of the Variation in the Chemical Composition of the L AA Reductant
|
Volume of Chemical Solution used |
Resultant Concentration |
||||||||
|
S.no. |
0.00 M BCB (ml) |
0.01 M AA (ml) |
0.01 SLS (ml) |
1 M NaOH (ml) |
DDW (ml) |
BCB X10-4 M |
AA X10-3 M |
SLS X10-3 M |
NaOH pH |
|
|
3.5 |
1.5 |
2.0 |
4.0 |
15.0 |
1.4 |
0.2 |
0.8 |
13.30 |
|
|
3.5 |
1.0 |
2.0 |
4.0 |
14.5 |
1.4 |
0.4 |
0.8 |
13.30 |
|
|
3.5 |
1.5 |
2.0 |
4.0 |
14.0 |
1.4 |
0.6 |
0.8 |
13.30 |
|
|
3.5 |
2.0 |
2.0 |
4.0 |
13.5 |
1.4 |
0.8 |
0.8 |
13.30 |
|
|
3.5 |
2.5 |
2.0 |
4.0 |
13.0 |
1.4 |
1.0 |
0.8 |
13.30 |
Table 8: Examination of Modifications in the Chemical Make-Up of the Variation SLS Surfactant
|
Volume of Chemical Solution |
Resultant Concentration |
||||||||
|
S.No. |
0.001 M BCB (ml) |
0.01M AA (ml) |
0.01 SLS (ml) |
1 M NaOH (ml) |
DDW (ml) |
BCB X 10-4 M |
AA X 10-3 M |
SLS X 10-3 M |
NaOH pH |
|
|
3.5 |
1.5 |
1.0 |
4.0 |
15.0 |
1.4 |
0.6 |
0.4 |
13.30 |
|
|
3.5 |
1.5 |
1.5 |
4.0 |
14.5 |
1.4 |
0.6 |
0.6 |
13.30 |
|
|
3.5 |
1.5 |
2.0 |
4.0 |
14.0 |
1.4 |
0.6 |
0.8 |
13.30 |
|
|
3.5 |
1.5 |
2.5 |
4.0 |
13.5 |
1.4 |
0.6 |
1.0 |
13.30 |
|
|
3.5 |
1.5 |
3.0 |
4.0 |
13.0 |
1.4 |
0.6 |
1.2 |
13.30 |
Table 9: Examination of alterations in the Chemical Make-Up of the Variation Cell: Sodium hydroxide (NaOH).
|
Volume of Chemical Solution used |
Resultant Concentration |
||||||||
|
S.no. |
0.001 M BCB (ml) |
0.0 M AA (ml) |
0.01 SLS (ml) |
1 M NaOH (ml) |
DDW (ml) |
BCB X 10-4M |
AA X 10-3 M |
SLS X 10-3 M |
NaoH PH |
|
|
3.5 |
1.5 |
2.0 |
3.0 |
15.0 |
1.4 |
0.6 |
0.8 |
13.24 |
|
|
3.5 |
1.5 |
2.0 |
3.5 |
14.5 |
1.4 |
0.6 |
0.8 |
13.27 |
|
|
3.5 |
1.5 |
2.0 |
4.0 |
14.0 |
1.4 |
0.6 |
0.8 |
13.30 |
|
|
3.5 |
1.5 |
2.0 |
4.5 |
13.5 |
1.4 |
0.6 |
0.8 |
13.33 |
|
|
3.5 |
1.5 |
2.0 |
5.0 |
13.0 |
1.4 |
0.6 |
0.8 |
13.36 |
Variation of DL on the PG system
The cell was utilised for experiments with diffusion lengths (DL) ranging from particular PG cell path. In the BCB+SLS+AA system, the electrical output of the PG cell was observed. The rate of photocurrent’s initial generation is accelerated by increasing diffusion length. At 45.00 mm, very positive results are attained, with values of photocurrent (220.0 mA) and equilibrium photocurrent (220.0 mA), respectively. The photocurrent is acquired in a corresponding way because dye molecules cannot absorb the light source at lower and higher diffusion lengths, respectively. For diffusion length variation on the PG system, the Open circuit voltage (Voc), Isc, Imax,Vpp, ipp,and Ppp are measured; the resulting values are 1124 mV, 220.0 mA, 240.0 mA, 624 mV, 100.0 mA, and 62.4 mW, respectively.
Variation of EA of the cell
The current characteristics of the PG cell were calculated using electrode areas (EA) ranging from 0.50 cm2 to 2.10 cm2. The study was conducted on the photocurrent and photocurrent for better results. For electrode area variation on the PG system, the Open circuit voltage (Voc), Isc, Imax,Vpp, ipp,and Ppp are measured; the resulting values are 1124 mV, 220.0 mA, 240.0 mA, 624 mV, 100.0 mA, and 62.4 mW, respectively and recorded at 1.20 cm2 of electrode area.
(i-V) characteristics of the PG cell
The fill-factor (FF) and power point (PP) were calculated (equ. 1):

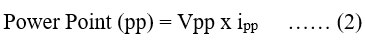
Where:Vpp is value of potential, ipp is current at power point, Voc is open circuit voltage, isc is short circuit current
The FF of the circuit was calculated and the Ppp was obtained as 62.40 µW for the PG cell. Table 10 displays the observed results for the (i-V) characteristics of the PG cell for BY+NaLS+AA system. All observations of PG cell (Fig. 4) for BCB +AA+ SLS system is reported.
Table 10: Photocurrent power (i-v) of modified PG cell.
|
S.no. |
Photocurrent (uA) |
Photopotential (mV) |
Power (uW) |
|
|
200.0 |
65 |
13.00 |
|
|
180.0 |
173 |
31.14 |
|
|
160.0 |
292 |
46.72 |
|
|
140.0 |
393 |
55.02 |
|
|
120.0 |
510 |
61.20 |
|
|
100.0 |
624 |
62.40 |
|
|
80.0 |
726 |
58.00 |
|
|
60.0 |
847 |
50.82 |
|
|
40.0 |
958 |
38.32 |
|
|
20.0 |
1053 |
21.06 |
Cell performance and conversion efficiency (CE) of the PG system
In terms of t1/2, the calculated performance is shown in (Fig. 5), and the experimental value was 120.00 minutes in the dark. The CE of PG cells was found to be 1.236 percent (equ 3).

Where A is the cell’s electrode area, Vpp is the photopotential at the cell’s power point, and ipp is the photocurrent at the same point.
Effect of variation of light intensity
The light intensityabout the PG cell was calculated for electrode areas ranging from 3.1 mWcm-2 to 26.0 mWcm-2. The study was conducted on the maximum photocurrent (imax in mA) and equilibrium photocurrent (ieq in mA). at 10.4 mWcm-2, very positive results are obtained, displays the observed results for the change in electrode area on the BCB+AA+ SLS system.
Mechanisms
The following chemical process manifests in a laboratory environment, showing the electrons movement of within circuit of the PG cell.
Illuminate Chamber
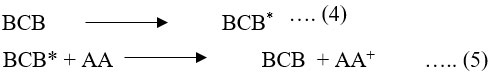
In the photophysical and photochemical reactions process (equation 4) the BCB molecules (Dye) capture quantum photons and are stimulated as follows. Excited BCB takes up electrons from reductants in the second stage (equation 5) and transmits its energy to a variety of other molecules.
PG cell reaction at Pt electrode
On the other hand, in the secondary reaction, semi- or leuco-form (equation 6) returns to its original form by giving the electron to an electrode.

PG cell reaction at dark Chamber
Equation 7 describes how the dye (BCB molecules) at the counter electrode absorbs the electrons from the counter electrode and transforms into a semi- or leuco-form of BCB as a result. Equation 8 shows that the photochemical cycle is ultimately finished when the BCB (leuco/semi-form) and the reducing agent unite to provide the original BCB and AA molecules.
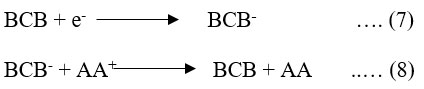
Where: AA is ascorbic acid; AA+ is the oxidized form of reductant (ascorbic acid); BCB is brilliant cresy blue dye; BCB* is excited form of BCB; and BCB– is semi or leuco form of brilliant cresy blue.
Conclusions
Novelty and Prospectus and Recommendation
The project’s main objectives were to reduce the price of PG cells while simultaneously enhancing electrical performance. The objective has been attained by taking into account the BCB+SLS+AA system’s good amount of storage capacity. The existing PG cells on the market may be replaced, and these efficient systems may be able to supply all of humanity’s electrical demands if the price and general efficiency are reduced to the necessary level.
Importance of work
We have discovered that the BCB +AA+ SLS system have enhanced the PG cell’s electrical output as well as its capacity to convert energy based on the findings of the observed experiments. The PG cells would be the best cell in terms of current specifications for solar energy conversion and power. The BY+NaLS+AA cell’s open circuit voltage is 1124 mV, compared to an earlier reported value of 690.00 mV (published work). The reported fill factors of BCB +AA+ SLS system is 0.2523. While the good photocurrent in the EDTA+TB+NaLS PGS was recorded at 150.00 uA, the study published in 2022 already had particular values. In conclusion, the findings of the observed PG cell are higher than those of the PG system published in 2022. The BCB +AA+ SLS PG system, the Open circuit voltage (Voc), Isc, Imax,Vpp, ipp,and Ppp are measured; the resulting values are 1124 mV, 220.0 mA, 240.0 mA, 624.0 mV, 100.0 mA, and 62.40 mW, respectively. Maximum photocurrent of 240.00 mA and equilibrium photocurrent of 220.00 mA were obtained were recorded at 1.20 cm2 of electrode area, which are comparatively better electrical outputs in the BCB +AA+ SLS system. The effects will be used to create a PG cell with a larger electrical output than the results that have already been published (see references 6, 17, and 19). If efficient systems are sufficiently advanced, they might take the place of the solar cells that are currently available on the market and have the ability to supply the necessary electricity for environmentally friendly growth.
Acknowledgement
All authors are thankful to H.O.D. Chemistry, University of Rajasthan (UOR), Jaipur, India for lab facility and Renu Kumari (Co-author) is thankful to her supervisor for research guidance.
Conflicts of Interest
Authors have no any conflict of interest.
References
- Gangotri, KM.; Gunsaria, RK.; Meena, RC., Afinidad, 2003, 60,13–20.
- Gunsaria, RK.; Hussain, J., Asian J. Chem., 2004, 16,375–384.
- Gunsaria, RK.; Hussain, J., Asian J. Chem., 2004, 16,385–392.
CrossRef - Gunsaria, RK.; Sindal, RS.; Chandra, M.; Meena, RC., Arab. J. Sci. Eng., 2005, 31,177.
- Gunsaria, RK.; Nadeem, SS.; Meena, RN., Int. J. Basic Appl. Chem., Sci., 2012, 2,77-83.
- Mohan, L.; Gangotri, KM., J. Solar Energy Res., 2022, 7(3),1095-1103.
- Gunsaria, RK.; Meena, RN.,. Int. J. Basic Appl. Chem. Sci., 2012, 2,77-83.
- Tiwari, S.; Mall, C.; Solanki, PP., Surf. Interfaces, 2020, 18,100427.
CrossRef - Koli, P., RSC Adv., 2014, 4,46194-46202.
CrossRef - Stevenson, K.; Ervelding, W., Solar Energy, 1981, 27,139.
CrossRef - Meena, J.; Meena, SK.; Gangotri, KM., Orient J Chem., 2024, 40(1) 288-293.
CrossRef - Gangotri, KM.; Meena, RC., J Photochem Photobiol A Chem., 2001, 141,175-177.
CrossRef - Genwa, KR.; Genwa, M., Sol Energy Mater Sol Cells, 2008, 92, 522-529.
CrossRef - Rathore, J.; Lal, M., Res. J. Chem. Environ.,2018,22(6),53-57.
- Jayshree, R.; Arya, RK.; Pratibha, S.; Mohan, L., Res. J Chem. Environ. 2022, 26,24-29.
CrossRef - Jayshree, R.; Arya, RK.; Pratibha, S.; Lal, M., Ind. J. Sci. Tech., 2022, 15(23),1159-1165.
CrossRef - Lal, M.; Gangotri, KM., Int J Energy Res., 2022, 46(14),19538-19547.
CrossRef - Genwa, KR.; Prasad, H., Orient J Chem., 2023, 39(2),372-377.
CrossRef - Lal, M.; Gangotri, KM., Environ Sci Pollut Res., 2023, 30(44), 98805–98813.
CrossRef

This work is licensed under a Creative Commons Attribution 4.0 International License.
About The Author
![]()
A New Edition of Web of Science
Journal Impact Factor
2022: 0.5
Five Year: 0.8
Journal is Indexed in

Cabells Whitelist
![]()


