DE Fluoridation of Domestic Waste Water by using Activated Diatomaceous Earth in fixed Mattress Column Adsorption System
Department of Chemistry, Sunrise University, Alwar, Rajasthan, India.
DOI : http://dx.doi.org/10.13005/ojc/370311
Article Received on : 15-May-2021
Article Accepted on :
Article Published : 23 Jun 2021
Study aims to eliminate fluoride from treated waste water or ground water through adsorption technique by using Activated Diatomaceous Earth as a sorbent. Study found that there is no change in pH and TDS, but the concentration of Fluoride ions reduced. The most elimination potential of 71.97 mg/kg turned into achieved for activated diatomaceous earth with particle sizes of 0.075-0.425 mm. The absorbance capability of diatomaceous earth (DE) is 20.73% when used as a filtration media. In this analysis, activated diatomaceous earth was used as an adsorbent in a fixed-mattress column adsorption system for DE fluoridation of water. The XRD, BET surface area, FTIR, XRF, Scanning Electron Microscopy (SEM), and pH Point of Zero Charges (pHPZC) evaluation had been executed for adsorbent to explain the mechanisms of absorption and fluoride elimination. The Bradley equation was used to calculate the isothermal data and adsorbent dose. The statistical analyses were performed using Langmuir and Freundlich equations.
KEYWORDS:Activated Diatomaceous Earth; Adsorbent; Defluoridation; Waste Water
Download this article as:| Copy the following to cite this article: Kumar P, Gupta P. DE Fluoridation of Domestic Waste Water by using Activated Diatomaceous Earth in fixed Mattress Column Adsorption System. Orient J Chem 2021;37(3). |
| Copy the following to cite this URL: Kumar P, Gupta P. DE Fluoridation of Domestic Waste Water by using Activated Diatomaceous Earth in fixed Mattress Column Adsorption System. Orient J Chem 2021;37(3). Available from: https://bit.ly/3wWiUfG |
Introduction
For the vast majority of rural communities in countries such as India, the most favored source of drinking water is groundwater. For healthy teeth, fluoride levels in portable water should be between 0.5-1.0 mg/l as described by WHO. “In India, fluoride levels in portable water between 1.0-1.5 mg/l, higher fluorides more than 1.5 mg/l concentrations in human consumable water have been shown dental and skeletal fluorosis” [1]. Fluoride has been shown to disrupt nutrient, enzyme, protein, lipid, carbohydrate and mineral metabolism when consumed in large doses. The kidney and other internal parts of the body are also affected. Defluoridation can be done in a variety of ways. The adsorbent is the most important part of an adsorption-based defluoridation system. The ability of a variety of adsorbents, both natural and modified, to remove fluoride has been investigated. The capacity for defluoridation by natural and synthetic materials has been investigated. Activated alumina, natural and metal oxide-modified bentonite clay, activated coconut charcoal, surface-tailored zeolite, lanthanum hydroxide, and synthetic hydroxyapatite are just a few examples. There is no end to the research into potential defluoridation products. It is preferable for a material used as an adsorbed to be easily available in local market, plentiful, and inexpensive. Diatomaceous earth (DE) is a successful materials for investigation because of these factors. DE is non-toxic and plentiful in nature. In recent years, diatomaceous earth have received significant interest for pollutant removal. Diatomaceous Earth have high surface area, low-cost, easy accessibility, good mechanical resistance, and availability in large quantities. Defluoridation research has previously been done in batch experiments with natural adsorbents. The sorption ability of adsorbents determined by batch equilibrium is useful in providing basic information about the adsorbents effectiveness. None the less, the results of batch studies may not be applicable to continuous processes in which the contact time required to achieve equilibrium is insufficient. As a result, various studies show that continuous processes mode (fixed-bed column set-up) yields reliable information about breakthrough time, sufficient adsorption conditions, and adsorption efficiency stability, which can then be used to assess the capacity of prepared adsorbents for industrial applications. As a result, conducting adsorption experiments in a flow-through device is of interest.
The primary goals was to (i) interrogate the fluoride sorption potential of Diatomaceous Earth and Activated Diatomaceous Earth in a fixed-bed column setup, (ii) compare the adsorption properties of adsorbent, and (iii) compare the adsorption properties with and without activation of DE (iii) evaluate fluoride adsorption mechanisms as a function of solution pH, adsorbent particle size, and flow rate, (iv) investigate the adsorption processes further using mathematical calculation such as given by the Adams–Bohart and Thomas models, and (v) finally check the models’ suitability for the design of flow-through systems can be checked. Fluoride is removed from aqueous solutions using this method.
Experimental
Material and Methods
Materials
Diatomaceous Earth samples were collected in this study from mines in Barmer, Rajasthan State, India, about 50–100 kilometers east of Barmer and Jodhpur city Centre. Since these rocks are readily accessible in about a fifth of the total area of Rajasthan, they are a favored adsorption material due to their low supply costs.
Sample Preparation
Natural deposits in Rajasthan’s Barmer and Jodhpur districts provided the DE for the study. A part of the sample was cleaned with DDW or demineralized water. Centrifugation was used to separate colloidal particles from the suspension. Preliminary functional experiments were performed to test the DE heated up to a temperature at 110°C for 6 to 8 hours in an oven. “Then cooled in a desiccator before being crushed in a mortar until the particles passed through a 250-m test sieve and placed in corked bottles to avoid moisture absorption”[1].
Preparations of Adsorbents
The Diatomaceous Earth samples were washed with deionized water several times before all water-soluble compounds and dust were removed, then dried at 55°C for 48 hours. After allowing samples to cool to room temperature, “sample was crushed and sieved into three different mesh sizes: silt (0.075 mm), fine sand (0.075–0.425 mm), and medium sand (0.425–2.00 mm)” [4]. For later usage, all prepared samples were sealed in airtight plastic bags and placed in a cold, dry location.
Preparations of Adsorbate
Before use, all glassware and bottles were thoroughly cleaned and rinsed with deionized water. An analytical grade chemicals are used in experimental study. Fluoride standard solution freshly developed by mixing 2.21 gm anhydrous NaF in 1000 ml of deionized water. “After diluting the stock solution, the required concentrations of synthetic fluoride were obtained” [14]. The pH of the fluoride solution used in the column experimental experiments was modified as required “with 0.1 M HCl or/and 0.1 M NaOH solutions” [8].
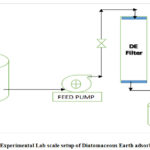 |
Figure 1: Experimental Lab scale setup of Diatomaceous Earth adsorbent filter. |
Column Adsorption Experimental Set-Up and Procedures
The dynamic behavior of fluoride removal using diatomaceous earth was assessed using continuous fixed-bed column adsorption studies. Continuous flow adsorption experiments was carried out in a small-scale cylindrical column with an empty bed volume of 515 cm3 and an internal diameter of 8.1 cm. “A weighted volume of adsorbent of various particle sizes (silt: 0.075 mm, fine sand: 0.075–0.425 mm, and medium sand: 0.425–2.00 mm) was added to the column” [13]. When regulating parameters like pH and flow rate were checked, the same particle size was used. To ensure a tightly packed adsorbed surface, the bed was conditioned with deionized water (pH: 7.00–7.30) for 12 hours (overnight) and to avoid the potential occurrence of voids, channeling, or cracking, which can significantly affect the performance of the column.
To prevent channelling caused by gravity, a synthetic fluoride solution with a concentration of 10 mg/l was pumped into a packed bed column in up-flow mode. The influent volumetric flow rate differed between experiments, but an adjustable peristaltic pump (MS-REGLO, Labortechnik-Analytic, Zürich, Switzerland) was used to keep it constant in each one. The analysis done at room temperature (25°C). An automated fraction collector was used to collect the effluent column sample (RFI, MA-RON GmbH, Germany). Collecting and quantifying the effluent solution at regular intervals confirmed the steady flow rate. When the fluoride concentrations in the effluent exceeded 90% of their initial levels, the column activity was halted. Fluoride concentrations was quantify using ion selective Electrode (make-Hach, U.S.A model HQ440D). Inline dilution, inline dialysis, eluent degasser, CO2 suppressor, and chemical suppressor were used to measure fluoride concentrations in the calibration range of 0.2–200 mg/l. Fluoride ion detection sensitivity is increased by suppression in IC, whereas red fluoride ion detection sensitivity is increased by red fluoride ion suppression. The maximum tolerable breakthrough concentration (Cb) was 1.5 mg/l, which is the maximum appropriate amount for drinking water as recommended by the WHO. The impact of experimental parameters including particle size (silt: 0.075 mm, fine sand: 0.075–0.425 mm, and medium sand: 0.075–0.425 mm), influent solution pH (2.00, 4.00, and 6.00), and influent volumetric flow rate (1.25, 2.50, and 3.75 mL/min) on breakthrough behavior and fluoride removal was investigated.
General procedure
Adsorbent Characterizations
Crystalline Structures
An X-ray diffractometer (XRD-7000, Drawell, Shanghai, China) was used to examine the crystalline structures of the adsorbents using Cu K as a radiation source (1.54056) generate at 30 kV and 25 mA. With a phase width of 2 and a scanning rate of 0.04/min, the diffractograms was obtained.
Chemical Composition
“Using inductively coupled plasma-optical emission spectroscopy, the elemental composition of the adsorbents was determined (ICP-OES). The powder composition of the adsorbent materials was evaluated by X-ray fluorescence (XRF) spectroscopy” [6].
Results and Discussion
Scanning electron microscopic study of Adsorbent
Scanning and recorded at CDU lead detector with an instrument supplied by Hitachi X-650 scanning electron micro analyzer at an output power of 25 kV examining the structure of DE at the surface. Every pinnate diatom had a series of rectangular pores arranged in a regular pattern along the void tubes, as shown in Fig. 2/3
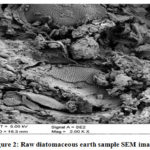 |
Figure 2: Raw diatomaceous earth sample SEM image. |
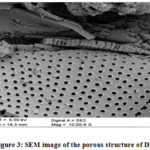 |
Figure 3: SEM image of the porous structure of DE. |
Figure 2/3 shows a scanning electron microscope view of diatomaceous earth.
Physicochemical analysis of adsorbent
Analyzing samples were added to a particle size of 75 m in a milling pot of tungsten carbide. To assess the loss of weight on Ignition (LOI) values, samples was heated up to a temperature of 100°C in an oven and further in muffle furnace up to a temperature of 1,000°C. To develop suitable fused glass bead, one gm. of “sample was mixed with 6 g of lithium tetra borate flux and fused at 1,050°C. The sample was mixed with PVA binder and pressed in an aluminum cup at 10 tonnes for trace element analyses” [1]. Table 1 shows the effects of the main element composition in terms of percentage oxide. The DE’s major component is silica (SiO2) and Al2O3 while other components are minor in quantity, according to the findings. DE without metals has a chemical formula SiO2·nH2O.
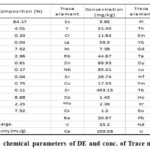 |
Table 1: Physico chemical parameters of DE and conc. of Trace materials in DE. |
X-ray diffraction analysis
A PAN analytical X’Pert Pro powder diffractometer with an X’Celerator detector and variable divergence- and fixed receiving slits with Fe filtered Co-K was used to analyze the DE for mineral composition. The phases were identified using the X’Pert High score plus app [7]. The material is fully amorphous, with no crystalline minor phases” [1], according to DE’s diffractogram as shown below.
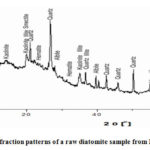 |
Figure 4: X-ray diffraction patterns of a raw diatomite sample from Barmer mines deposit. |
The pore depth, surface area and pore width of DE particles with a diameter of 250 m were calculated using the Brunauer–Emmett–Teller (BET) method. Micrometrics TriStar II Surface Area and Porosity measurements [1,4] are shown in Table 2 as well [1].
Table 2: showing Surface dimension of DE by BET
|
Porosity analysis of DE by BET |
|||
|
Parameters |
Quantity |
||
|
Area (m2/g) |
Volume (cm3/g) |
Pore (nm) |
|
|
Single point surface area |
30.834 |
||
|
BET surface area Single point adsorption |
31.126 |
||
|
Total volume Adsorption |
0.08032 |
||
|
Average pore width (4 V/A by BET) |
10.2564 |
||
FTIR spectroscopy
The ALPHA FT-IR Spectrophotometer was used to conduct a Fourier rework infrared (FTIR) evaluation of the raw DE and DE with fluoride contained in order to distinguish the functional organizations within the cloth [1]. The Si–O–H spreading vibration is described by the 453 cm1 transmittance, whilst the transmittance at 1,1/2 cm1 represents the Si–O–Si spreading vibration. At 453 cm1 and 1,1/2 cm1, the uncooked DE and fluoride-loaded DE bands overlap, indicating that fluoride sorption at the DE floor is low. There become no enormous distinction with inside the purposeful training of the authentic fabric after fluoride sorption (Fig. 5).
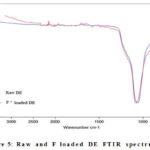 |
Figure 5: Raw and F loaded DE FTIR spectrum. |
Batch adsorption experiment
The batch adsorption equilibration approach was used to investigate fluoride adsorption on DE. 50 ml of Fluoride solutions was pipetted out in a plastic bottle of 250 ml size. 0.1 M HCl or 0.1 M NaOH were used to calibrate the pH, and different masses of adsorbent were weighed into the bottles while keeping track of quantity of acid or alkali used. By adding deionized water, amount of the solution was increased up to 50 ml. “After dilution, a solution containing 10 mg/l fluoride had a final concentration of 8 mg/l. Corked bottles were shaken in a water bath shaker”[1]. With a thermo stated reciprocating motion .The suspensions was mixing at 5,000 rpm for 5 minutes after equilibration in a centrifuge machine. TISAB III was applied to the supernatants at a 1:10 volume ratio to decomplex any potential of iron (III) or aluminum fluoride complexes, avoid ionic strength variations, and maintain a pH between 5.2 and 5.5. For a full reaction, the ingredients were stirred and allowed to sit for 1 hour. By Using ion-selective electrode (Hack, HQ440D,U.S.A make fluoride ion meter by selective electrode) cross checked with fluoride standard. “Fluoride was calculated in supernatants containing TISAB III at a volume ratio of 1:10, as in the samples” [1].
Eq. (1) was used to measure the percent fluoride removal.
Fluoride removal (%)

Whereas C0 (mg/l) is the initial concentration of fluoride and Ce (mg/l) is the equilibrium concentrations of fluoride’ [1].
Determination of pH and Point of Zero Charges (pHPZC)
Adsorbents pH was determined by using a digital pH metre in a ration of 1:10 by adsorbent and water, as per the standard procedure [6]. A SOP was used to determine the pH of the adsorbents at the point of zero charges (pHPZC). 250 mL of 0.01 M NaCl solution was used as an electrolyte in a 298 K vessel, and N2 was bubbled through it to keep the pH intact by keeping CO2 from the air from dissolving. 25 ml electrolyte was applied to 6 Erlenmeyer flasks, and pH adjusted with 0.1 M NaOH or 0.1 M HCl to the desired value (2.00, 4.00, 6.00, 8.00, and 10.00). The same procedure and method were used for the blank electrolyte solution (0.01 M NaCl). Each beaker received 0.25 g of rock samples and was shaken for 48 hours. The filtered suspension final pH was determined. The point of zero charges (pHPZC) was discovered at the intersection point by plotting the initial pH vs. final pH.
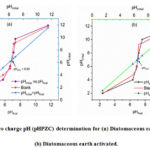 |
Figure 6: Zero charge pH (pHPZC) determination for (a) Diatomaceous earth Raw and (b) Diatomaceous earth activated. |
Adsorption experiment and equilibrium study
To test percent removal at optimum adsorption conditions, “50 mL of 50 mg/l working standard solutions were used. The percentage of metal removal was examined separately by adjusting the pH, adsorbent dose, contact time, and initial M(II) concentration in order to determine the optimum adsorption parameters for Cadmium and Lead. With adsorbent doses ranging from 50 mg to 250 mg, the effect of pH on M(II) adsorption was investigated over a pH range of 2-7. Contact time for 30-150 minutes at the best adsorbent dose and pH was calculated using a rotatory shaking flask containing M(II). The effect of initial concentration in the range of 5-80 mg/l was investigated under ideal conditions. The percentage of Fluoride removal [9] and the number of metal ions adsorbed per unit mass of adsorbent (qt ) is calculated using the following formulas” [2].
Fluoride removal (%)


Where C0 refers to the initial ion concentration of the metal ion, Ct refers to the metal ion at t, V indicates the initial ion solution volume (50 mL) and m indicates the adsorbent mass (50mg).
Adsorption Kinetics
Adsorption kinetics is investigated using kinetics models. For pseudo first order kinetics, Lagergren’s equation is as follows:

Where qt means the amount of metal that has been adsorbed (mg/g) at any given moment, qe is the quantity of metal adsorbed at balance time (mg/g) and K1 represents the first order rate constant in pseudo (min-1) 51 represents the Ho equation for pseudo second order kinetics.

Where, K2 = Pseudo second order rate constant (g/mg min)[3].
Adsorption Isotherm
Langmuir and Freundlich adsorption isotherm models51 were used to express the adsorption isotherm [6].
The Langmuir model can be stated as follows:

The Langmuir monolayer adsorption strength of the adsorbent is qL (mg/g), and the Langmuir adsorption constant is kL (l/mg). qe is the number of metal ions added per mass of adsorbent (mg/g) at equilibrium time te. The difference between the initial concentration (Ci) and the concentration of metal ions extracted is known as Ce-Equilibrium concentration (Ct) [2].
Observed Langmuir isothermal data are
Table 3: showing calculated Langmuir parameters.
|
Intercept |
Slope |
qmax (mg/g) |
KL |
RL |
R² |
|
0.04824 |
0.00422 |
20.72968491 |
11.43128 |
0.001747 |
0.98312 |
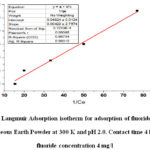 |
Figure 7: Langmuir Adsorption isotherm for adsorption of fluoride on Raw Diatomaceous Earth Powder at 300 K and pH 2.0. Contact time 4 hours and fluoride concentration 4 mg/l |
The Freundlich isotherm is described as follows:

Where, KF-Freundlich constant, 1/n- heterogeneity factor.
Observed Freundlich parameters are
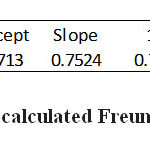 |
Table 4: showing calculated Freundlich parameters. |
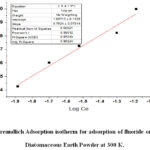 |
Figure 8: Freundlich Adsorption isotherm for adsorption of fluoride on Activated Diatomaceous Earth Powder at 300 K. |
This study about to removal of fluoride from aqueous solutions of treated waste water was examined in a continuous fixed-bed adsorption column system using Diatomaceous Earth as a filtering media and Activated Diatomaceous Earth as a absorbent. The characterizations investigations were performed using XRD, SEM, FTIR, BET, XRF, and ICP-OES equipment to reveal the mechanisms of adsorption and the suitability of the adsorbents for fluoride removal. The pHPZC is 6.98 for raw DE when used as a filtering media and 6.85 for Activated DE when used as a adsorbent. The effects of process parameters such as adsorbent particle size, influent pH, and influent volumetric flow-rate on the performance of the adsorption process in a column were evaluated. “At a particle size of 0.075–0.425 mm and 0.075 mm, respectively, at a lower solution pH (2.00) and flow rate (1.25 ml/min)” [2]. Raw DE had a maximum removal capacity of 20.73 mg/kg and Activated DE had a maximum removal capacity of 71.97 mg/kg. The increase in adsorbent particle size, solution pH, and flow rate decreases the breakthrough and saturation time of the column bed and, consequently, lowers the amount of fluoride removal by raw DE. The breakthrough and exhaustion time on Activated DE was high at a particle size of 0.075–0.425 mm, at lower solution pH and flow rate similar to that of raw DE. Thus, in order to attain optimum performance, suitable experimental parameters are significant for the operation of the adsorption column. “The Thomas and Adams–Bohar models were applied to estimate the breakthrough curves and to determine fixed-bed column kinetic parameters” [3]. Both the Adam–Bohar and the Thomas models could predict very well the entire region of the breakthrough curves for the fluoride reduction through Activated DE and fluoride-reduction by raw DE used as a filtering media. The results show that raw DE and Activated DE could be used in a fixed-bed adsorption column for the removal of excess fluoride from water. Although the adsorbents are inexpensive, an overall cost analysis of the purification system is critical because it has consequences for the adsorption method’s viability (both technically and economically). To confirm that the defluoridation of groundwater and treated waste water using Diatomaceous Earth is a safe and sustainable process, additional testing of the adsorbents is needed, including representative samples tests for potential compositional, mineralogical, and textural changes in time due to weathering, leaching tests, competitive ions effects, and regeneration options.
Conclusion
The fluoride removal from treated waste water was examined in a continuous fixed-bed adsorption column system in this study. Diatomaceous Earth was used as a filtering media and as an adsorbent to remove fluoride from water. The pHPZC is 6.98 for raw DE when used as an adsorbent and 6.85 for Activated DE as a filter. The removal capacity of 20.73 mg/kg for raw. DE and 71.97 mg/ kg for Activate DE were achieved at a particle size of 0.075–0.425 mm. Thus DE is a suitable and easily available adsorbent used for defluoridation of water.
Acknowledgement
Authors convey gratitude to SUNRISE University Alwar, Rajasthan (India), IET College Alwar, Rajasthan (India), and Dr. Pankaj Gupta sir for their guidance and support for providing instrumental facility for the research work.
Conflicts of Interest
The authors declare no conflict of interest.
References
- Anthony, I.A.; Gitari, M.W.; Gumbo, R.J, Desalination and Water Treatment. 2016, 36, 16745-16757
- Mishra, K.U.; Siddiqi, A.; Meikap, H, J. Cleon. Prod. 2021, 279,123645
CrossRef - Mishra, K.U.; Siddiqi, A.; Meikap, H, J. Cleon. Prod. 2020, 381, 120917
CrossRef - WHO Guideline for drinking water, 4th ed, Geneva, ISBN 2011, 978, 154815
- Rango, T.; Vengosh, A.; Whitford, G.M, Sci. Total Environ. 2017, 596-597, 1-11
CrossRef - Demelas, H.; Beyene, A.;, Abebe, Z.; Melese, A, BMC Public Health. 2019, 19, 1298
CrossRef - Cai, J.; Zhang, Y.; Pan, B.; Zhang, W, Water Res. 2016, 102, 109-116
CrossRef - Mohan, S.; Kumar, V.; Singh, D.K.; Hasan, S.H, RSC Adv. 2016, 6, 87523-87538
CrossRef - Araga, R.; Kali, S.; Sharma, C.S, Clean Soil Air Water, 2019, 47, 1-9
CrossRef - Khan, M.I.; Chang, Y.; Sustainability, 2018, 10, 2567
CrossRef - Saha, P.; Shinde, O.; Sarkar, S, Int. J. Phytoremed., 2017, 19, 87
CrossRef - Ali, S.; Abbas, R.Z, Sustainability, 2020, 12, 1960
CrossRef - Ali, M.E.; Hoque, M.E.; Hossain, S.K.; Biswas, M.C, Int. J. Environ. Sci. Technol, 2020, 1, 24
- Baby, R.; Saifullah, B.; Hussein, M.Z, Nanoscale Res. Lett., 2019, 14, 34
CrossRef - Morejón, L.; Delgado, J.A.; Ribeiro, A.A.; Oliveira, M.V.; García, E.M.I.; Alfonso, A.; Poh, P.; Griensven, M.V.; Balmayor, E.R, Int. J. Mol. Med. Sci., 2019, 20, 1790
- Yang, Y.Y.; Jiang, J.; Kang, W, J.Environ Manag., 2018, 206, 929-937
CrossRef - Lingamdinne, L.P.; Koduru, J.R.; Karri, R.R, Intech.,2019, 805, 122–127
CrossRef - Hoang, L.P.; Nguyen, T.M.P.; Van, H.T.; Hoang, T.K.D.; Vu, X.H.; Nguyen, T.V, Water Air Soil Pollut., 2020, 231, 28
- Tsuzuki, T.; McCormick, P.G, Acta Mater, 2000, 48, 2795
CrossRef - Bassem, S.M.; Biodiversity Int J., 2020, 4, 10

This work is licensed under a Creative Commons Attribution 4.0 International License.


0 Comments