Cost Effective Purification of Tannery Waste Water Using Biosynthesized Silver Nanoparticles
A. Arputharaj1,2* and P. Anbarasu2
1Department of Electronics, St. Joseph’s College(Affiliated by Bharathidasan University),Tiruchirappalli 620002, Tamil Nadu, India.
2Department of Electronics, Government Arts College Kulithalai 639120, Tamil Nadu, India.
Corresponding Author E-mail: arputharajj@gmail.com
DOI : http://dx.doi.org/10.13005/ojc/370321
Article Received on : 11-04-2021
Article Accepted on :
Article Published : 13 May 2021
The nanotechnology has reached a greater extent of the research and now it is considered as the best source of alternative in the present world. Nowadays, the contaminants present in the water should be very difficult to remove and it leads to several health issues. It is the primary requisite to know about the different physico-chemical parameters to check the quality of water. Currently, the nanotechnology has been the emerging technology and the green synthesis is acclimating to eco-friendly, non-toxic and this method reduces the pollution. This biological approach is undertaken to diminish toxicity and to reduce pollution. In these current studies, the silver nanoparticles can be synthesized from chrysopogan zizanioides root extract. The synthesised silver nanoparticles were characterized by UV-Vis, TEM, physical and chemical parameters of water quality. The synthesised silver nanoparticles were used to reduce the chemical effluents. The outcome of the synthesis silver nanoparticles is using the vital route of wastewater treatment and also effectively reduces the water contaminations.
KEYWORDS:Chrysopogan Zizanioides Root; Physico-Chemical Parameters.; Silver Nanoparticles; TEM; UV-Vis
Download this article as:| Copy the following to cite this article: Arputharaj A, Anbarasu P. Cost Effective Purification of Tannery Waste Water Using Biosynthesized Silver Nanoparticles. Orient J Chem 2021;37(3). |
| Copy the following to cite this URL: Arputharaj A, Anbarasu P. Cost Effective Purification of Tannery Waste Water Using Biosynthesized Silver Nanoparticles. Orient J Chem 2021;37(3). Available from: https://bit.ly/3hungp4 |
Introduction
Water is essential for living beings it must be protected and saved for the next generation.Water is precious and a most commonly used resource. We cannot live without water 1. Tannery waste water is having the highest amount of organic, inorganic and nitrogeneous compounds, suspended solids, sulphide and dissolved solids 2. Thetannery waste water treatment mustinclude biological oxygen demand (BOD) and chemical oxygen demand (COD) 3. Utilization of nanoparticles is the rapid technique to purify the sediment present in the water sample 4. Nano chemistry is a becoming apparent sub-discipline of chemical and materials sciences. These materials have been explored in many different applications, including uses in electronics, nano appliances, biotechnology, and medicine, and also in the textile industry 5-6. Silver nanoparticles are the most appealing and demandable exploration in the field of nanotechnology 7-9. Silver nanoparticles have the certain unique properties such as highly stablility, good conductivity, and catalytic activity with localised surface plasma resonance. In this study the plant used for the synthesis of sliver nanoparticle is chrysopogan zizanioides root 10. In ancient days chrysopogan zizanioides root is mostly utilised as the waste water purifier. This study is mainly focused on reducing excess amount of chemicals present in the tannery water using green synthesised silver nanoparticles.
Materials and methods
Sample collection
The fresh medicinal herb used in this study ischrysopogan zizanioides root. The chrysopogan zizanioides root was collected from Namakkal district, Tamilnadu, India. The collected fresh root was used for further studies. The tannery effluents water sample was collected from the rear side off leather factory Sembattu -Tiruchirapalli district, Tamilnadu, India.
Preparation of stock solution
The collected plant samples were shade dried for more than twenty days and make it as a powder using mortar and pestle. About 5g of the powdered sample of chrysopogan zizanioides root was taken and mixed with 150ml of double distilled water with constant stirring and heated for 15 minutes, filtered and then cooled at room temperature. The filtrate is transferred into brown bottle and kept in refrigerator under 4◦Cfor further synthesis 11.
Preparation of silver nanoparticles
About 3 mm of silver nitrate solution was prepared by weighing 0.1018g of silver nitrate precisely which dissolved in a double distilled water and the solution was made up to 200 ml standard flask. Measured volume of 1ml silver nitrate solution was taken in an ependdrof. To this 750µl of the chrysopogan zizanioides root extract was added drop by drop. After the addition, the solution is kept aside for 15 minutes without any disturbance. Within half an hourthe silver nanoparticles were formed without any agglomeration 12.
UV-visible spectroscopy
The formation of silver nanoparticles was confirmed by calculating the SPR band of reaction mixture in UV-Vis spectrum of U-2900 Spectrophotometer at a resolution of 1nm in 2ml quartz cuvette in 1cm path wavelength. The aspect of the peak shows that the surface Plasmon resonance of silver nanoparticles.
The green synthesized silver nanoparticles were studied under the UV-Visible spectrum. The sample was first dissolved in the deionised water.It is used to find out the optical properties of synthesized silver nanoparticles. The absorption of light by the sample shows the information regardingthe formation of nanoparticles.The silver nanoparticles was scanned in the wavelength of range from 300-800 nm using the Systronic Spectrometer. These solutions were scanned again at regular intervals of time. So that the characteristic peaks were detected. The peak value was also recorded using UV-Visible spectra.
TEM
TEM analysis is a microscopic technique used to determine the shape and structure of synthesized nanoparticles. The transmission electron microscope is a powerful and sensitive tool. The size and shape of nanoparticles can be identified with the help of TEM. A picture is formed by the connections between the electrons and the sample as the beam is transmitted along the synthesized silver nanoparticles.
Demand parameters
BOD
The sample was placed in the air tight bottle and it is incubated for specific conditions for a particular time. Dissolved Oxygen was measured initially and after incubation, the BOD was enumerated from difference between the initial DO and final DO. A desired volume of distilled water with 1ml per litre of phosphate buffer, MgSO4, CaCl2 and FeCl3 is mixed and aerated for 30 minutes. It is called dilution water. The water samples were diluted using standard dilution tables and dilution water. Two sets of BOD bottles are filled with respective solutions. One bottle was incubated at 20o Celsius in a BOD incubation for 3 days. Initial DO level was estimated and other set of bottles are noted below. After 3 days final DO was estimated and the BOD was calculated by using the formula,

COD
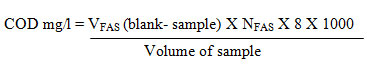
About 20ml of the sample was taken in a round bottom flask, add pinch of mercuric sulphate. Antibumping granules are added. Accurately measured 5ml of sulphuric acid- silver sulphate mixture was added into the flask containing the solution and mixed well until the dissociation of mercuric sulphate. To this solution we have to add 10ml of potassium chromate and 25ml of sulphuric acid- silver sulphate mixture in a round bottom flask. It should be kept in ice cold water bath to prevent the escape of fatty acids due to higher temperature. Then the round bottom flask is connected to the reflexed condenser for 2 hours. After 2 hours, the flask was cooled and diluted by using distilled water and mixed well, then it is titrated against FAS using indicator has ferroin. The color changes from blue green to wine red are the endpoint indication. Similarly, the blank was conducted using distilled water using the same volume of chemicals.
Results and discussion
Characterization of silver nanoparticles
UV-visible spectroscopy
The optical properties of the solution can be governed by using absorbance spectroscopy. When the light is passed through the sample solution and it gives the amount of light absorbed by the sample through particular wavelength. It is the authentic and simple method to examine the nanoparticles stability present in the solution. The silver nanoparticles were synthesised by using 1ml root extract which was added slowly with 0.75ml of standard solution of 3mM silver nitrate and the peak was perceived in the range of 447nm clearly fulfil the presence of silver nanoparticles. The yellow color of the solution turned into dark brown due to shift in the surface Plasmon resonance band 13. The Uv-Visible spectroscopy of the synthesized nanoparticles is shown in figure 1.
 |
Figure 1: UV-visible spectroscopy of synthesized silver nanoparticles. |
Transmission electron microscope
The TEM image helps to identify the size and shape of the green synthesized silver nanoparticles. The TEM was recorded by placing the silver nanoparticles on copper grid and dried under ambient conditions 14. The size of the nanoparticles was around 50nm and 200nm. The TEM image of synthesized silver nanoparticles was spherical in shape. The TEM image of synthesized silver nanoparticles using chrysopogan zizanioides root was represented in figure 2.
 |
Figure 2: TEM image of synthesized silver nanoparticles. |
Water treatment using silver nanoparticles
The water treatment analysis is used to analyse the chemical components present in the tannery waste water. About 1ml of the synthesized silver nanoparticles solution was treated with 1000ml of the domestic water sample taken in a standard flask. The physical, chemical and demand parameters of water can be carried out by using APHA standards15.
Determination of pH
pH was a chemical property of water which gave an idea about the quality of tannery waste water 16. pH is an negative logarithmic concentration of the hydrogen ion (H+) .Generally , The pH value ranges from 0 to 15.The value of pH=7 is said to neutral. The value of pH ranges in-between 0 to 6.9 was said to be an acidic and 7.1 to 15 are said to be alkaline. The pH of the water before and after treatment of water is 7.52 and 7.16 respectively. The standard pH of drinking water is 7.0 to 8.5. Both the samples are in acceptable pH range.
Measurement of turbidity
Turbidity in the water was due to the presence of suspended matters like clay, slit and phytoplanktons, etc. Turbid water becomes unsuitable for industrial and domestic use because of the presence of Fe, Mn, Ni, Co and Pb which may cause strain on cloths 17. The turbidity of the of the tannery water before and after treatment of water is 7.10 and 5.60 NTU respectively. The accepted range is 1 to 5 NTU. Addition of silver nanoparticles can drastically reduce the turbidity level.
Measurement of electrical conductivity
Electrical conductivity is mainly due to the dissociated ions. Electrical conductivity varies for different solutions 18. The presence of suspended particles and other pollutants affect the rate of conductivity. The electrical conductivity of the tannery water before and after treatment of water sample is 2922.00 and 1366.00 µS respectively. The higher the electrical conductivity is due to the presence of more number of strong electrolytes like HCl, H2SO4 in the distillery effluent. From added the nanoparticles in water, rigorously reduce the electrical conductivity.
Estimation of total solids, total dissolved solids and total suspended solids
A large number of salts were found in natural water, the common chemical salts were carbonate, bicarbonate, chloride, sulphate, phosphate, Nitrate etc. A high content of the dissolved solids elevate the density of water and unable for drinking water, irrigation and industrial process. All these parameter (TS, TDS, and TSS) are the important. The given sample having the total solids were 2200 and 1200 mg/L respectively. The water sample taken from the tannery waste water was having the more number of Total solids. While adding the nanoparticles to water sample can reduce the TS, TDS and TSS.
Estimation of total hardness
Hardness of water is due to the presence of calcium and magnesium salts. Temporary hardness can be removed by certain methods like boiling and permanent hardness cannot easily remove. The hardness of the before and water treatment of water is 1100.00 and 320.00 mg/L. After the treatment it is come under the permissible limit.
 |
Figure 3: Total hardness of water. |
Estimation of calcium hardness (calcium and magnesium)
The before and after treatment of calcium hardness was530.0 and 145.0 mg/L respectively. From this we have to calculate the amount of calcium and magnesium present in the water sample. Similarly, the calcium present in the water sample was 212.42 and 68.11 mg/L and the amount of magnesium present in the water sample were 140.94 and 63.63 mg/L respectively. Before the treatment, the water sample having the unfit for commercial purposes, after the treatment of silver nanoparticles it shows the better result.
 |
Figure 4: Analysis of calcium hardness in tannery water. |
Estimation of alkalinity
Alkalinity was a measure of water’s capacity to absorb hydrogen ions without significant pH Changes (ie) to neutralise the acids. The naturally alkalinity in water is caused due to carbon dioxide. The water sample shows the 9 mg/l and 6 mg/L before and after treatment. Both were below the permissible limit. The determination of alkalinity was very useful in water and waste because it provides buffering to resist the changes in pH value.
Estimation of acidity
The acidity level of water shows 125.0 and 95.00 mg/L respectively. After treatment of water with synthesised silver nanoparticles shows the better result of acidity, have to minimize the acidity level drastically with the help of nanoparticles.
Estimation of fluoride
Fluoride was required in minimal amount, if it decreases leads to dental cavies in humans and it increases causes dental and skeletal fluorosis. The permissible level of fluoride in drinking water was 0.500mg/L. The fluoride content of water, before and after treatment was0.34 and 0.10 mg/L respectively. Before and after treatment of tannery waste water, both show the better result for fluoride.
Estimation of sulphate
Sulphate occurs usually in natural water. In this study, before and after treatment of sulphate was 11.05 and 9.00 mg/L.After the addition of nanoparticles to the tannery waste water shows the better result.
Estimation of nitrate
The nitrate was found commonly in all water bodies. When it exceeds the concentration of 50 mg/L , it affects the infants leads to disease called methemoglobinemis .The permissible level of nitrate in drinking water was 20 mg/L. Before and after treatment were 15.40 and 11.00mg/L respectively. Both having the minimal level when it treats the nanoparticles potently shows the better results.
Estimation of chloride
The acceptable level of chloride in drinking water is 250 mg/L. Before and after the treatment of water, it shows the 730.62 and 124.42 mg/L respectively. Before adding the synthesized nanoparticles into the water contains hazard and it was unhealthy. After the treatment it comes under the accepted range and fit to drinking water.
 |
Figure 5: Analysis of chloride in tannery water. |
Estimation of potassium
Before and after the treatment of potassium with tannery water sample was 40.80 and 9.50 mg/L. The accepted range of the 100 mg/L, water samples comes under the permissible limit before and after treatment. After adding the nanoparticles, it shows the superior results than normal water.
Estimation of BOD and COD The accepted range of BOD was less than 5 mg/L for drinking water. The water sample before and after addition with tannery waste water shows the result of 1.60 and 1.63 mg/L respectively. Both comes under the permissible level, before adding the nanoparticles it shows least amount of BOD and after adding the nanoparticles it slightly enhances the oxygen demand.Chemical oxygen demand of before treatment of water was 184.00 mg/L and after treatment was 160.00 mg/L. The maximal amount of COD is 120 mg/L. Before the treatment of water into nanoparticles it was unfit to use and after addition of nanoparticles, it comes under the category to drinking water.
 |
Figure 6: COD titration, COD digestion apparatus. |
Conclusion
The main concern of the nanotechnology-based studies is the green synthesis and an eco-friendly approach. In this green synthesis, plant extracts can used as a major resource. From chrysopoganzizanioides root extract, the silver nanoparticles were successfully synthesized without use of hazardous chemicals. The outcome of the work is to mainly the purification process of water and how the nanoparticles influence the parameters of waste water treatment can be studied. The SPR band in the UV-visible spectrum shows the range of 447 nm which clearly indicates the formation of nanoparticles. TEM analysis shows that the synthesized nanoparticles were spherical in shape. Hardness of the water can be drastically reduced with the help of synthesize nanoparticles and it comes to the category of drinking purpose and commercial use is monitored. Physical parameters like pH, electrical conductivityand turbidity shows better result after the treatment of tannery water with the nanoparticles. The total dissolved solids of water are 2200 mg/L is present in the examined sample and it was minimized by using synthesis nanoparticles by experimental methods. The synthesis silver nanoparticles effectively remove the fluoride, chloride and sulphate present in the water sample. The BOD of the water treatment shows the permissible limit, after adding the nanoparticles slightly enhances the biological oxygen demand. The COD was carried out by using COD digestion apparatus and titration methods. The outcome of the synthesis of silver nanoparticles is using the vital route of waste water treatment and also effectively reduced the water contaminations. In future, further studies and experiments may be determined to enhance the water treatment at minimal cost.
Acknowledgment
This research did not receive any specific grant from funding agencies in the public, commercial,or not-for-profit sectors.
Conflicts of interest
The authors declare no conflict of interest.
References
- Wagner, W.;Pruß, A. J. Phys. Chem. Ref. Data 2002,31(2), 387–535.
CrossRef - Kadam,P.; Patil, M.; Yadav, K.Pharmacogn.Mag. 2018,10(6),1076–1078.
CrossRef - Karr, J. R.; Dudley, D. R.Environ. Manage.1981,5(1), 55–68.
CrossRef - Tyagi, S.; Sharma, B.; Singh, P.;Dobhal, R.Am. J. Water Resour. 2013,1(3), 34–38.
CrossRef - Boxi, S.;Paria, S. Dalton Trans.2015,44, 20464–20474.
CrossRef - Balan, I.N.;Shivakumar, M.; Kumar, P.D.M. Chronicles Young Scient.2012,3(2), 146–150.
CrossRef - Gleisner, H.;Einax, J. W.;Morés, S.;Welz, B.;Carasek, E.J. Pharm. Biomed. Anal.2011,54(5), 1040–1046.
CrossRef - Gu, J.-A.; Lin, Y.-J.; Chia, Y.-M.; Lin, H.-Y.; Huang, S.-T.Microchim. Acta.2013, 180(9–10), 801–806.
CrossRef - Kalhor, K.;Ghasemizadeh, R.; Rajic, L.;Alshawabkeh, A. Groundw. Sustain. Dev.2018, 8, 104–108.
CrossRef - Sharma, V. K.;Yngard, R. A.; Lin, Y.Adv. Colloid InterfaceSci.2009,145(1–2), 83–96.
CrossRef - Toisawa, K.; Hayashi, Y.; Takizawa, H. Mater. Trans.2010,51, 1764–1768
CrossRef - Iravani, S.;Korbekandi, H.;Mirmohammadi, S. V.;Zolfaghari, B. Res. Pharm. Sci.2014,9, 385–406
- Abbasi, T.; Abbasi, S.A.Water quality indices. Elsevier, Amsterdam, 2012
CrossRef - Parham, H.; Rahbar, N.J. Pharm. Biomed. Anal.2009,50(1), 58–63.
CrossRef - Chowdhury R.M., Muntasir S.Y. and Hossain M.M., (2012) “Study on ground water quality and its suitability or drinking purpose in Alathur block -Perambalur district”, Archiv. Appl. Sci. Res., 4(3). 1332-1338.
- Sharifinia, M., Ramezanpour, Z., Imanpour, J., Mahmoudifard A. and Rahmani, T., (2013).“Water quality assessment of the Zarivar Lake using physico-chemical parameters and NSF- WQI indicator, Kurdistan Province-Iran”, Int. J. Adv. Bio. Biomed. Res., 1(3). 302-312.
- Srinivas, J., Purushotham, A.V. and Murali Krishna, K.V.S.G.,(2013). “Determination of water quality index in industrial areas of Kakinada, Andhra Pradesh, India”, Int. Res. J Env. Sci., 2(5). 37- 45.
- Abdulwahid, S.J., (2013) “Water quality index of delizhiyan springs and shawrawa river within soran district, erbil, kurdistan region of iraq”, J. Appl. Environ. Biol. Sci., 3(1). 40-48.

This work is licensed under a Creative Commons Attribution 4.0 International License.
About The Author
![]()
A New Edition of Web of Science
Journal Impact Factor
2022: 0.5
Five Year: 0.8
Journal is Indexed in

Cabells Whitelist
![]()


