Development and Validation of Stability Indicating RP-HPLC Method for Estimation of Larotrectinib in its Formulations
Mahreen Fatima1, Anupama Koneru2, M.Mushraff Ali Khan3, Murali Balaram Varanasi1 and Imam Pasha Syed1*
1Department of Pharmaceutical Quality Assurance, Sultan-ul-Uloom College of Pharmacy, Mount Pleasant, #8-2-249, Road No.3, Banjara hills, Hyderabad-500034, Telangana, India.
2Department of Pharmacology, Sultan-ul-Uloom College of Pharmacy, Mount Pleasant, #8-2-249, Road No.3, Banjara hills, Hyderabad-500034, Telangana, India.
3Department of Pharmaceutics, Sultan-ul-Uloom College of Pharmacy, Mount Pleasant, #8-2-249, Road No.3, Banjara hills, Hyderabad-500034, Telangana, India
Corresponding Author E-mail: impazam@gmail.com
DOI : http://dx.doi.org/10.13005/ojc/360216
Article Received on : 28 Nov 2019
Article Accepted on : 11 Apr 2020
Article Published : 01 May 2020
A stability indicating HPLC method for the quantification of Larotrectinib in capsule form was developed and validated as per the ICH guidelines. Separation and quantification of Larotrectinib was carried out on column Sunsil C18 using mobile phase as KH2PO4 and methanol in 1:1 ratio. Larotrectinib was eluted at 3.432 minutes. Linearity was observed in between 50-150 µg/ml. LOD and LOQ were found to be 0.065 µg/ml and 0.217 µg/ml respectively. % RSD for the precision of the method was found to be 0.115. Accuracy was well within the regulated limit that is 100.13% and the recovery was found to be to 100.47%. Forced degradation analysis was carried out on Larotrectinib which established stability indicating power of the developed method.
KEYWORDS:HPLC; ICH Guidelines; Larotrectinib; Method Development
Download this article as:| Copy the following to cite this article: Fatima M, Koneru A, Khan M. M. A, Varanasi M. B, Syed I. P. Development and Validation of Stability Indicating RP-HPLC Method for Estimation of Larotrectinib in its Formulations. Orient J Chem 2020;36(2). |
| Copy the following to cite this URL: Fatima M, Koneru A, Khan M. M. A, Varanasi M. B, Syed I. P. Development and Validation of Stability Indicating RP-HPLC Method for Estimation of Larotrectinib in its Formulations. Orient J Chem 2020;36(2). Available from: https://bit.ly/2KQIc8w |
Introduction
A medication, Vitrakvi (Larotrectinib), IUPAC term (3S)-N-{5-[(2R)-2-(2,5-difluorophenyl)-1-pyrrolidinyl]pyrazolo[1,5-a]pyrimidin-3-yl}-3-hydroxy-1-pyrrolidinecarboxamidesulphate was authorized by US Food & Drug Administration (FDA) to manage tumors with particular genetic modification regardless of cancer type. Vitrakvi (Larotrectinib) is authorized managing adults and children having solid tumors which give positive test for NTK genes [1]. Tumors with that kind of genetic modification are not prevalent but it can be seen in salivary gland cancer, pulmonary cancer and sarcoma in tissue. Tumors which have distributed or not surgically removed and have grew up during earlier medicines must be treated with Larotrectinib. Present work is aimed to develop a new, efficient and reproducible HPLC method for the analysis of Larotrectinib. The developed method is validated according to ICH guidelines for various parameters specified in guidelines [2,3, 4]. Separation and quantification of Larotrectinib was carried on column Sunsil C18using mobile phase as KH2PO4 and methanol in 1:1 ratio. Larotrectinib was eluted at 3.432 minutes. The method was validated for parameters such as specificity, linearity, precision, accuracy, system suitability limit of detection, limit of quantification and robustness.
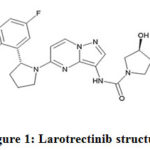 |
Figure 1: Larotrectinib structure |
Material and Methods
Table 1: Instruments used
|
Instrument |
Model |
Description |
|
HPLC system |
2695 model |
Water alliance |
|
Column |
Sunsil C18 |
250 mm×4.6 mm, 5µm |
|
Software |
Empower |
Water alliance |
|
Photodiode array |
2998 Model |
Water alliance |
Table 2: Drug, chemicals and solvents used
|
Material |
Source |
|
Larotrectinib |
Octapharma pvt.ltd, India |
|
Dipotassium hydrogen phosphate |
Sd Fine-Chem Ltd, India |
|
Hydrochloric acid |
Sd Fine-Chem Ltd, India |
|
Sodium hydroxide |
Sd Fine Chem Ltd, India |
|
Hydrogen peroxide |
Sd Fine Chem Ltd, India |
|
Phosphoric acid |
Sd Fine Chem Ltd, India |
|
Methanol |
Merck specialities Ltd, India |
Table 3: HPLC method conditions
|
Column with temperature |
Ambient |
|
pH units |
4.3 units |
|
Injection vol sample |
10 µl |
|
Column rate of flow |
1ml/min |
|
Run time |
5 minutes |
|
Wavelength detection |
228 nm |
Preparation of Mobile Phase
KH2PO4 with strength 0.1 M and methanol mixed in 50:50 v/v ratios and the pH was fixed to 4.3 with the aid of phosphoric acid. As both mobile phase and diluent, this solvent mix was used.
Preparation of Stock Solution
100mg of standard Larotrectinib was dissolved in 100ml volume of mobile phase. Stock Larotrectinib solution-1000 µg/ml concentration.
Assay Methodology
Larotrectinib capsules (label claim – 100 mg/capsule) were emptied. Capsule powder weight equivalent to 100 mg Larotrectinib was taken to standard flask (100 ml). 25 ml mobile phase was added and dissolved and make up the volume to 100ml. Concentration of Larotrectinib in solution (stock capsule solution) was 1000 µg/ml. 1 ml stock capsule solution is mixed with 9 ml of diluent. Then concentration of Larotrectinib in this capsule solution was 100 µg/ml. This capsule solution was analyzed employing proposed HPLC conditions. The Larotrectinib amount in capsule was calculated with acquired peak areas.
ASSAY%
Table 4: Optimized chromatographic conditions
|
Mobile Phase |
Na2HPO4 (50 ml) and methanol (50 ml) |
|
pH of mobile phase |
4.3 |
|
Chromatographic column |
Phenomenex, C18, length – 250 mm, Identification -4.6 mm, particle -5 µm |
|
Flow Rate |
1.0 ml/min |
|
Injection Volume |
10 µl |
|
Temperature of column |
25 ˚C |
|
Detection wavelength |
228 nm |
|
Time of run |
5 minutes |
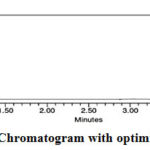 |
Figure 2: Chromatogram with optimized conditions |
Assay of Formulation
Standard and sample solutions were injected separately into the system and chromatograms were recorded. The drug present in sample was calculated using mentioned formula.
Table 5: Assay of formulation
|
S.NO |
% Assay |
|
1 |
99 |
|
2 |
99 |
|
3 |
99 |
|
4 |
99 |
|
5 |
99 |
|
6 |
100 |
|
Average assay: |
99 |
|
Standard deviation |
0.11 |
|
%RSD |
0.12 |
 |
Figure 3: Sample chromatogram |
Method Validation [5, 6, 7]
Selectivity
Interference of blank diluent, placebo and excipient in capsule solution was assessed. Analysis was done on blank diluent, placebo and excipient in capsule solution and compared with Larotrectinib standard (100 µg/ml). Interference peaks were not noticed at the retention time of Larotrectinib in chromatograms of blank diluent, placebo and capsule solution. This clearly showed ability of method to selectively analyze Larotrectinib.
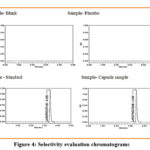 |
Figure 4: Selectivity evaluation chromatograms |
System Suitability
To test system effectiveness 10μl of Larotrectinib standard (100µg/ml) injected five times. Result of system suitability (Plate count, RSD of peak area, retention time and tailing factor) were computed. The results were well within the limits of ICH prescribed.
Prescribed Limits
More than 2000-Plate count
Less than or equal to 2%- Peak area RSD
Retention time- reliably less Less than or similar to 2% – Tailing factor
Table 6: Results for system suitability
|
Peak Name: Larotrectinib |
|||||
|
S.NO |
Sample Name |
Rt |
Area |
USP Plate Count |
USP Tailing |
|
1 |
Sample 1 |
3.436 |
5547055 |
12095 |
1.29 |
|
2 |
Sample 2 |
3.425 |
5549323 |
12105 |
1.29 |
|
3 |
Sample 3 |
3.434 |
5538730 |
12289 |
1.29 |
|
4 |
Sample 4 |
3.436 |
5546059 |
12179 |
1.29 |
|
5 |
Sample 5 |
3.435 |
5536725 |
12211 |
1.29 |
|
Mean |
5543578.2 |
|
|||
|
%RSD |
0.1 |
|
|||
Linearity
Five calibration samples of Larotrectinib were made (50 µg/ml, 75 µg/ml, 100 µg/ml, 125 µg/ml and 150 µg/ml) and injected into chromatographic system. Plot the graph of measured Peak area Vs. concentration and calculated the regression coefficient. Good linear relationship is observed with correlation coefficient of 0.9998.
Table 7: Results of linearity
|
%Concentration with respect to target conc. |
Larotrectinib area |
Larotrectinib conc.( µg/ml) |
|
50 |
2767034 |
50 |
|
75 |
4153769 |
75 |
|
100 |
5539444 |
100 |
|
125 |
6921686 |
125 |
|
150 |
8318378 |
150 |
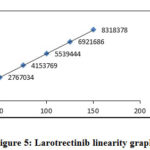 |
Figure 5: Larotrectinib linearity graph |
LOD and LOQ
The concentration of Larotrectinib with signal to noise ratio 3:1 is taken as LOD and 10:1 as LOQ.
Table 8: Signal to noise details in LOD and LOQ
|
S.no |
Sample name |
Rt |
Area |
S/N ratio |
|
1 |
LOD |
3.531 |
31853 |
3.96 |
|
2 |
LOQ |
3.537 |
29391 |
10.28 |
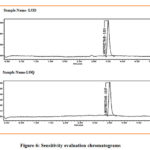 |
Figure 6: Sensitivity evaluation chromatograms |
Precision
Standard Larotrectinib solution is injected (n= 6 times) in the system. Measured mean area and RSD for 6 injections. The RSD for area of 6 injections is lower than 2%, which shows good precision.
Table 9: Results of precision
|
Larotrectinib-100mg |
|
|
S.No |
Area |
|
1 |
5529736 |
|
2 |
5525264 |
|
3 |
5523125 |
|
4 |
5523255 |
|
5 |
5530329 |
|
6 |
5539924 |
|
Average area |
5528803 |
|
STD |
0.114 |
|
%RSD |
0.115 |
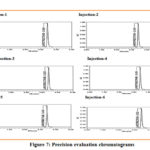 |
Figure 7: Precision evaluation chromatograms Click here to View Figure |
Accuracy
Accuracy was determined through analysis (n = 3) for different three concentrations (49.5 µg/ml – 50% level; 99 µg/ml – 100% level; 148.5 µg/ml – 150% level) of Larotrectinib spiked to already analyzed capsule solution. Mean recovery at different three concentrations were computed. The values are nearby 100%, which shows good accuracy.
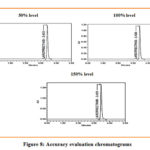 |
Figure 8: Accuracy evaluation chromatograms |
Table 10: Results of accuracy evaluation
|
Level added |
Larotrectinib area |
µg/ml Larotrectinib added |
µg/ml Larotrectinib found |
%Larotrectinib recover |
Mean |
|
50% |
2755478 |
49.500 |
49.56 |
100.11 |
100.13 |
|
50% |
2756510 |
49.500 |
49.58 |
100.15 |
|
|
50% |
2755948 |
49.500 |
49.57 |
100.13 |
|
|
100% |
5525880 |
99.000 |
99.38 |
100.39 |
100.36 |
|
100% |
5520131 |
99.000 |
99.28 |
100.28 |
|
|
100% |
5527423 |
99.000 |
99.41 |
100.41 |
|
|
150% |
8295365 |
148.500 |
149.19 |
100.46 |
100.47 |
|
150% |
8292770 |
148.500 |
149.14 |
100.43 |
|
|
150% |
8298628 |
148.500 |
149.25 |
100.50 |
Robustness
Robustness was checked by determining parameters for system suitability by making small but deliberate variations in assay conditions as given:
Flow 1: 0.9 ml/min
Flow 2: 1.1 ml/min
Temperature 1: 23oC
Temperature 2: 27oC
pH 1: 4.1 unit
pH 2: 4.5 unit
Methanol composition at 45% and 55%
Table 11: Results of robustness evaluation
|
Peak name : Larotrectinib |
||||
|
Sample name |
Rt |
Area |
USP Tailing |
USP plate count |
|
Flow-1 |
2.937 |
4687232 |
1.26 |
11621 |
|
Flow-2 |
3.235 |
5215096 |
1.27 |
11925 |
|
Temp-1 |
4.026 |
6541959 |
1.29 |
12290 |
|
Temp-2 |
4.618 |
7286964 |
1.28 |
13298 |
|
Comp-1 |
2.937 |
4687232 |
1.26 |
11621 |
|
Comp-2 |
4.026 |
6541959 |
1.29 |
12290 |
|
pH-1 |
3.433 |
5539736 |
1.28 |
12220 |
|
pH-2 |
3.435 |
5545264 |
1.28 |
12237 |
There were no substantial changes to the values. This proves the robustness of the method.
Degradation/Stability Test for Larotrectinib
Stability check/degradation study of Larotrectinib was carried out using ICH criterion with capsule solution of 1000 µg/ml concentration.
Acid Degradation [8-12]
1 ml of stock Larotrectinib solution is mixed with 1 ml 0.1 N HCI followed by sonication for nearly 30 min at 25±2oC temperature. The mixture was made to 10 ml volume by diluent (100 µg/ml). This degraded capsule solution was analyzed employing proposed HPLC conditions. The Larotrectinib amount degraded and remained in capsule was calculated with acquired peak areas.
Alkali Degradation [13, 14]
1 ml of stock Larotrectinib solution is mixed with 1 ml 0.1 N NaOH followed by sonication for nearly 30 min at 25±2oC temperature. The mixture was made to 10 ml volume by diluent (theoretical Larotrectinib concentration – 100µg/ml). This degraded capsule solution was analyzed employing proposed HPLC conditions. The Larotrectinib amount degraded and remained in capsule was calculated with acquired peak areas.
Peroxide Degradation [15, 16]
1 ml of stock Larotrectinib solution is mixed with 1 ml of 30% hydrogen peroxide followed by sonication for nearly 30 min at 25±2oC temperature. The mixture was made to 10 ml volume by diluent (theoretical Larotrectinib concentration – 100µg/ml). This degraded capsule solution was analyzed employing proposed HPLC conditions. The Larotrectinib amount degraded and remained in capsule was calculated with acquired peak areas.
Thermal Degradation [17-19]
Capsule powder weight similar to 100 mg Larotrectinib was placed in petri plate and exposed to 100oC for nearly 6 hr. Cool the sample to 25±2oC temperature and transfer to standard flask (100ml).To which 25 ml of mobile phase added and dissolved and make up the volume to 100 ml. 1 ml prepared solution is mixed with 9 ml diluent (theoretical Larotrectinib concentration – 100µg/ml). This capsule solution was analyzed employing proposed HPLC conditions. The Larotrectinib amount in capsule was calculated with acquired peak areas.
Photo Degradation [20-23]
Capsule powder weight equivalent to 100 mg Larotrectinib was placed in petri plate and exposed to sunlight for nearly 6 hr. Cool the sample to 25±2oC temperature and transfer to standard flask (100ml). 25 ml mobile phase added and dissolve the drug through sonication. Mobile phase volume of 75 ml is added and properly mixed. 1 ml of prepared solution is mixed with 9 ml of diluent (theoretical Larotrectinib concentration – 100µg/ml). This capsule solution was analyzed employing proposed HPLC conditions. The Larotrectinib amount in capsule was calculated with acquired peak areas.
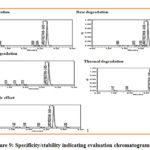 |
Figure 9: Specificity/stability indicating evaluation chromatograms |
The generation of separate peaks with distinct retention times with the peak of Larotrectinib showed its degradation. The retention time of additional peaks was completely different from retention time of Larotrectinib which proved specificity and stability indicating power.
Table 12: Results of Larotrectinib stability evaluation
|
Condition |
Larotrectinib area after degradation |
% remained after degradation |
% remained after stress applied |
|
Acid |
4902388 |
88.17 |
11.83 |
|
Alkali |
5211566 |
93.73 |
6.27 |
|
Peroxide |
5388047 |
96.9 |
3.1 |
|
Thermal |
5020477 |
90.29 |
9.71 |
|
Photolytic |
5296807 |
95.26 |
4.74 |
Discussion
The method development and validation of Larotrectinib was performed and the results were within the guidelines as mentioned in the standards i.e. the relative standard deviation was found to be not more than 2%, method precision was found to be not more than 2.0%, accuracy was found to be between 98% – 102%, robustness was found to be within the regulated limits [24].
Conclusion
In the present investigation a simple, sensitive and accurate RP-HPLC procedure was developed for evaluation of Larotrectinib in capsule dosage form. Degradation analysis was done and concluded that Larotrectinib is more stable in peroxide and less stable in acid form. From the above studies it was concluded that the proposed RP-HPLC method can be successfully used for the estimation of Larotrectinib in capsule form. This method can be used for the routine analysis in research institutions, QC departments in industries.
Acknowledgment
Authors are thankful to Management & Principal of Sultan-ul-Uloom College of pharmacy, for providing research facilities for this work.
Conflicts of Interests
The authors declare that they have no conflict of interest
References
- Drilon, A.; Laetsch, T.W.; Kummar, S., J. Med,2018, 378,731-39
- ICH Q2A; Guidelines on validation of analytical procedure; Definitions and terminology, Federal Register, 60, 11260 (1995).
- ICH Q2B; Guidelines on validation of analytical procedure; Methodology, Federal Register, 60, 27464 (1996).
- ICH harmonized tripartite guideline, stability testing of new drug substances and products, Q1A (R2), 1‑15 (2003).
- Geetha, M.; Venkat, R.; ShakilL, S.; Sripal, R. P., Orient. J. Chem. 2013, 29, 579-87
- Lloyd,B., Physics and Engineering Sciences, 2008, 366 (1879): 3301-3318.
- Arévalo, J.C.; Wu, S.H., Cell and Molecular Life Sciences, 2006, 63 (13), 1523-1537.
- Kawamura, K.; Kawamura, N.; Fukuda, J., J.Dev. Biology, 2007,311 (1), 147–158.
- Heidurnezhad, Z.; Heydari, F.; Bahranian, E., Orient. J. Chem., 2013, 29(1), 69-74
- Kawamura, K.; Kawamura, N.; Kumazawa, Y., J. of Endocrinology, 2011, 152 (3), 1090–1100.
- Kawamura, K.; Kawamura, N.; Sato, W., Journal of Endocrinology, 2009, 150 (8), 3774–3782.
- Imam, P.S.; Murali,B.V.; Ibrahim, M., J. Chem., 2017, 33(2), 925-929
- Chao, M.V. Nature Reviews Neuroscience, 2003, 4 (4), 299-309.
- Shaikh, S.; Muneera, M.S,; Thusleem, O.A., J. Chem., 2013, 29(2), 579-87.
- Russell, J.P.; Powell, D.J.; Cunnane, M.,Oncogene, 2000, 19 (5), 5729-35.
- Tognon,C.; Knezevich, S.R.; Huntsman, D., Cancer Cell, 2002, 2 (5), 367-76.
- Vaishnavi,A.; Capelletti,M.; Le,A.T., Nature Medicine, 2013, 19 (11), 1469-72.
- Wiesner, T.; He, J.; Yelensky, R., Nature Communications, 2014, 5, 3116-21.
- Vaishnavi, A.; Le ,A.T.; Doebele,R.C., Cancer Discovery, 2015, 5 (1), 25-34.
- Hong,D.S.; Bauer,T.M.; Lee,J.J; Dowlati,A.; Brose, M.S.; Farago, A.F., Annals of Oncology, 2019, 30 (2), 325-331.
- Berger,S.;Martens,U.M.; Bochum,S., Recent Results Cancer Research, 2018; 211, 141-51.
- Rolf, W.S.; Yaogeng,W.; Alfred,H.S.; Jan, H.M.S.; Jos,H.B., of Chrom. B, 2018, 10, 167-72.
- Akram ,N.M.; Umamahesh,M., J. Chem., 2017, 33(3), 1492-1501 92-1501

This work is licensed under a Creative Commons Attribution 4.0 International License.
![]()
A New Edition of Web of Science
Journal Impact Factor
2022: 0.5
Five Year: 0.8
Journal is Indexed in

Cabells Whitelist
![]()


