Microwave Dielectric Measurements of 4-Nitroacetanilide at Different Temperatures in Carbon Tetrachloride Solution
Department of Physics, IIS, deemed-to-be-University, Mansarovar, Jaipur -302020, India.
Corresponding Author E-mail: manrochitra@gmail.com
DOI : http://dx.doi.org/10.13005/ojc/340658
Article Received on : 20-09-2018
Article Accepted on : 12-11-2018
Article Published : 19 Nov 2018
The dielectric properties of 4-Nitroacetanilide have been discussed at four different temperatures in the dilute solution of carbon tetrachloride at a fixed frequency of 9.27GHz. The values of dielectric constant (εʹ), dielectric loss (εʺ), permittivity at an optical frequency (ε∞) and permittivity at a static frequency (ε0) are measured at different temperatures and mole fractions. The values of these dielectric parameters are used to calculate the values of relaxation time for overall molecular rotation (τ1), relaxation time for intramolecular rotation (τ2), most probable relaxation time (τ0) and dipole moment (μ) at different temperatures. In the present investigation we have found higher values of τ2 which indicate the existence of more than one relaxation process in the solution. The values of energy activation parameters for dielectric relaxation process (∆Fε, ∆Hε and ∆Sε) and viscous flow process (∆Fη, ∆Hη and ∆Sη) are also determined and compared for 4-Nitroacetanilide with carbon tetrachloride at different temperatures. It is observed that we may treat both the process as a rate process.
KEYWORDS:Dielectric parameters; Dipole moment; Energy Activation Parameters; 4-Nitroacetanilide; Rate Process
Download this article as:| Copy the following to cite this article: Manroand C, Jain R. Microwave Dielectric Measurements of 4-Nitroacetanilide at Different Temperatures in Carbon Tetrachloride Solution. Orient J Chem 2018;34(6). |
| Copy the following to cite this URL: Manroand C, Jain R. Microwave Dielectric Measurements of 4-Nitroacetanilide at Different Temperatures in Carbon Tetrachloride Solution. Orient J Chem 2018;34(6). Available from: http://www.orientjchem.org/?p=52899 |
Introduction
4-Nitroacetanilide (IUPAC name N-(4-nitrophenyl)acetamide) is a chemical compound in the form of solid and in crystalline powder in yellow to green-yellow or yellow to green-brown color. Its chemical formula is C8H8N2O3 andmolecular weight is 180.163 (g/mol). It is used as a raw material to prepare some products.1 Sometimes it is also used to make dyes.2 It should be used very carefully because it could cause skin irritation, respiratory irritation and eye irritation etc. Its chemical structure is given as:
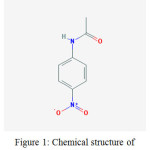 |
Figure 1: Chemical structure of 4-Nitroacetanilide.
|
Dielectric investigations of solutions are useful in finding construction and development of complexes in them because they are having different variety of connecting molecules. The dielectric relaxation studies in microwave region have been done by many researchers for polar molecules and their binary mixtures in the dilute solution of non polar solvents.3-9 The dielectric investigations on binary mixtures of ethanol and N, N-dimethylformamide (DMF) with benzene at various temperatures and at a fixed frequency is done by Sharma et. all,10 with the help of standing microwave techniques. They found the existence of solute-solvent association between the molecules due to the polar nature of both solute and solvent. They also confirm that both the dielectric relaxation process and viscous flow process behaves as a rate process. In the present study we have performed some experiments to investigate dielectric properties and relaxation process of 4-Nitroacetanilide in the dilute solution of carbon tetrachloride. Such relaxation studies deliver useful outcomes regarding the self association, solute-solute type and solute-solvent type of association between polar molecules in microwave region. They are also important to recognize the Hydrogen bonding and inter molecular associations among the molecules in solution. To understand the relaxation behavior of 4-Nitroacetanilde in the dilute solution of carbon tetrachloride in microwave frequency region, the experiments are done at various weight fractions and temperatures.
Experimental
4-Nitroacetanilide used in this investigation was purchased from the Central Drug House, Delhi. Carbon tetrachloride was procured from Merck and was used as a solvent without any further purification. The measurements of ε′ and εʺ are done by using X-Band microwave bench. The samples are prepared by dissolving five different mole fractions (0.01, 0.015, 0.02, 0.025, and 0.03) of 4-Nitroacetanilide in 1 mole of carbon tetrachloride. The values of (εʹ, εʺ, ε0 and ε∞) help to find the values of different relaxation times of samples in the solution. The dielectric relaxation studies suggest that the dielectric relaxation process depends on solute-solute association. The energy activation parameter (∆Fε) for dielectric relaxation process is determined by using Eyring rate equation at various temperatures.
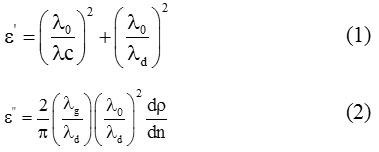
The double minima method given by Heston et al,11 for low loss liquid is used to determine the values of εʹand εʺ. According to this method, we can write:
where

and

Here, λ0 is the wavelength of free space, λc is the cut-off wavelength, λg is the wavelength in the empty waveguide and λd is the wavelength in the dielectric medium. ‘ρ’ denotes the inverse voltage standing wave ratio, ∆x represents double minima width and ‘ρ’ represents total number of minima. The accurateness of the measurements of the given X-band microwave test bench is ±0.01 cm. This helps to find error in the estimated values of dielectric constant. For simplicity, some errors caused by non-zero impedance of the short circuit plunger are ignored. We can measure these errors by using error analysis which is a conventional method to calculate such errors.12 The values of dielectric permittivity at static frequencies (ε0) are calculated by using dipole meter. Refractive indices are determined from Abbe’s refratometer which then gives the values of permittivity at optical frequencies (ε∞).13
The dielectric parameters (εʹ, εʺ, ε0 and ε∞) can be illustrated as a linear function of concentration for dilute solution in carbon tetrachloride. So they can be written as:

Here subscript 1 stands for pure solvent, 2 stands for the solute, 0 is for the zero frequency measurements in the static field and ∞ is for the values at very high frequency, W2 represents the weight fraction of the solute. The slopes of these linear equations are denoted as aʹ, aʺ, ao and a∞ respectively.
The values of relaxation times (τ1, τ2 and τ0) are determined by the method given by Higasi et al.,14
The relaxation time for overall molecular rotation (τ1) is defined by:

While the relaxation time for intramolecular rotations (τ2) is given by:

Here ‘ω’ is the angular frequency.
The most probable relaxation time (τ0) is then obtained by employing the following relation:
![]()
The value of the dipole moment (μ) of the solute molecules is evaluated by using Higasi’s method. According to this method the value of dipole moment is given by:

Where M2 is the molecular weight of solute, d1 is the density of solvent, k is the Boltzmann constant, N is the Avogadro’s number and T is the temperature at which the experiment is performed. Thus if the value of a0 and a∞ are known, we can obtain μ from equation (9) at different temperatures.
The temperature dependence characteristics of relaxation time can be used to determined different thermo dynamical parameters like molar free energy of activation (∆Fε), molar enthalpy (∆Hε) and molar entropy (∆Sε).
From the Eyring theory the relaxation time can be represented as:

In which
![]()
Where A=h/k and the other symbols have their usual meanings
Taking logarithm on both side of equation (10), we get

By knowing the value of T and τ, we can calculate the value of ∆Fε
From equation (10) and (11), we get.

When a graph is plotted between ln(τT) and 1/T, a straight line is obtained. When its slope is multiplied by R, it gives the value of ∆Hε.
Now by knowing the values of ∆Fε and ∆Hε , we can calculate the value of ∆Sε by using the following relation.
![]()
Now for the viscous flow process Eyrings equation15 is given by

Where
![]()
Where B=hN/V and V is the molar volume which is equal to M/d. Here M is the molecular weight and d is density and η is the viscosity of the non polar solvent at temperature T K.
Taking logarithm on both the sides of (15), we get.

Knowing the values of η, V and T, ∆Fη can be calculated.
From equation (15) and (16), we may get

Plot of ln η against 1/T gives a straight line whose slope (∆Hε/R) is when multiplied by gas constant ‘R’ gives the value of ∆Hη
Knowing ∆Fη and ∆Hη, ∆Sη can be calculated from the following equation.
![]()
Result and Discussion
In the present study, dielectric investigations are done for 4-Nitroacetanilide using carbon tetrachloride as a solvent. The permittivity at optical frequency (ε∞), permittivity at static frequency (ε0), dielectric loss factor (εʺ) and dielectric constant at microwave frequency (εʹ) for solutions of 4-Nitroacetanilide with carbon tetrachloride are measured at different mole fractions and different temperatures and mentioned in Table: 1.This table shows that εʹ, εʺ ε0 and ε∞ are varying linearly with the weight fraction of 4-Nitroacetanilide in dilute solution of carbon tetrachloride. It indicates that the entities of rotating molecules do not change their nature in the solution of carbon tetrachloride.16 The variation of these dielectric parameters with weight fractions are mentioned in Figures: 2, 3, 4 and 5. a′, aʺ, a0 and a∞ are the slope values of these plots and listed in Table: 2. These slope values help to determine the values of different relaxation times (τ1, τ2 and τ0) and dipole moment (μ) which are listed in Table: 3. From this table we can see that the values of τ1 and τ2 are falling steadily with the rise in temperature in solution and such type of behavior may occurs due to the increased dipole size and molar volume with temperature.17 From Table: 3 also shows that the observed values of intramolecular rotations are significantly higher than overall molecular rotation and this significant difference in the values of τ1 and τ2 represents the existence of more than one mechanism in the solution which shows that an additional intramolecular relaxation process exist along with the overall relaxation process in solution.18 It also indicates the dominance of intramolecular rotations over intermolecular rotations in solution. In the present study, the value of τ0 is also found to decrease with the temperature of the solution. From Table: 3, we can see that the dipole moments values are increases with the increase in temperature. This change in the dipole moment values may occur due to the stretching in band moment and change in the bond angle.19
For the solution of 4-Nitroacetanolide with carbon tetrachloride, we observed a linear relation graphically between ln(τT) & (1/T) (Figure: 6) and ln(η) & (1/T) (Figure: 7) which shows that relaxation time values decaying exponentially with temperature in both dielectric relaxation process and viscous flow processes. The values of ∆Fε, ∆Hε and ∆Sε are evaluated by Eyring’s equation and the values of ∆Fη, ∆Hη and ∆Sη are evaluated by considering that the viscous flow process is also a rate process. These values of energy parameters for the dilute solution of 4-Nitroacetanolide with carbon tetrachloride at different temperatures is mentioned in Table: 4. From the present investigation, it is found that that we can treat both the process as a rate process.
From Table: 4, it is found that the values of ∆Fη are higher than the values of ∆Fε.1 It confirms that the viscous flow process has both rotational and translational motion form whereas dielectric relaxation process possess only rotational form of motion.20 We can also found from Table: 4 that the values of ∆Fε increase with temperature which may be due to the increased thermal agitation of solvent. When thermal agitation of the solvent increased with temperature, the energy require by the molecules of system becomes high to overcome the excited state.21 The Table: 4 shows that the values of enthalpy of activation for viscous flow (∆Hη) is greater than the values of enthalpy of activation for relaxation process (∆Hε) and this difference in these values suggest that both viscous flow process and relaxation process include bond breaking with adjacent molecules in a unique way.22 Here we also found that ∆Sε is negative which means that the molecules of the system are surrounded by co-operative environment.23
Table 1: Experimental values of dielectric parameters for 4-Nitroacetanilide in dilute solution of ccl4 at frequency 9.27 GHz using X-Band microwave bench at different temperatures.
|
Weight Fraction |
ε′ |
εʺ |
ε0 |
ε∞ |
|
Temperature: 303K |
||||
|
0.01158 |
2.289 |
0.019 |
2.349 |
2.106 |
|
0.01726 |
2.330 |
0.022 |
2.394 |
2.109 |
|
0.02289 |
2.358 |
0.026 |
2.423 |
2.111 |
|
0.02845 |
2.399 |
0.029 |
2.464 |
2.112 |
|
0.03394 |
2.439 |
0.032 |
2.503 |
2.115 |
|
Temperature: 313K |
||||
|
0.01158 |
2.279 |
0.017 |
2.331 |
2.094 |
|
0.01726 |
2.313 |
0.021 |
2.371 |
2.097 |
|
0.02289 |
2.344 |
0.023 |
2.400 |
2.099 |
|
0.02845 |
2.383 |
0.025 |
2.448 |
2.101 |
|
0.03394 |
2.429 |
0.031 |
2.481 |
2.102 |
|
Temperature: 323K |
||||
|
0.01158 |
2.265 |
0.017 |
2.312 |
2.085 |
|
0.01726 |
2.297 |
0.019 |
2.351 |
2.086 |
|
0.02289 |
2.329 |
0.022 |
2.386 |
2.089 |
|
0.02845 |
2.374 |
0.025 |
2.425 |
2.091 |
|
0.03394 |
2.412 |
0.029 |
2.464 |
2.094 |
|
Temperature: 333K |
||||
|
0.01158 |
2.250 |
0.015 |
2.299 |
2.069 |
|
0.01726 |
2.284 |
0.018 |
2.338 |
2.072 |
|
0.02289 |
2.319 |
0.021 |
2.369 |
2.073 |
|
0.02845 |
2.356 |
0.024 |
2.418 |
2.075 |
|
0.03394 |
2.399 |
0.027 |
2.446 |
2.078 |
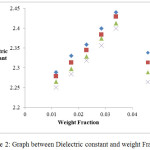 |
Figure 2: Graph between Dielectric constant and weight Fraction. |
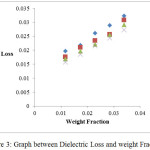 |
Figure 3: Graph between Dielectric Loss and weight Fraction.
|
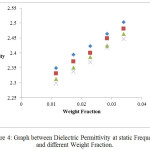 |
Figure 4: Graph between Dielectric Permittivity at static Frequency and different Weight Fraction.
|
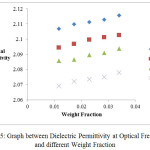 |
Figure 5: Graph between Dielectric Permittivity at Optical Frequency at different Weight Fraction.
|
Table: 2 Values of Slopes aʹ, aʺ, ao and a∞ for 4-Nitroacetanilide in the dilute solution of carbon tetrachloride at four different temperatures 9.27 GHz using X-Band microwave bench.
|
Temperature |
a′ |
aʺ |
a0 |
a∞ |
|
303 |
6.623 |
0.578 |
6.765 |
0.366 |
|
313 |
6.621 |
0.556 |
6.743 |
0.367 |
|
323 |
6.618 |
0.539 |
6.728 |
0.366 |
|
333 |
6.613 |
0.521 |
6.712 |
0.365 |
Table 3: Values of different relaxation times (τ1, τ2 and τo in pico sec.) and Dipole moment (μ in Debye) of 4-Nitroacetanilide in the dilute solution of Carbon tetrachloride at four different temperatures using X-Band microwave bench.
|
Temperature |
τ0 |
τ1 |
τ2 |
μ |
|
303 |
2.59 |
1.59 |
4.23 |
2.45 |
|
313 |
2.40 |
1.53 |
3.78 |
2.49 |
|
323 |
2.28 |
1.48 |
3.51 |
2.53 |
|
333 |
2.16 |
1.43 |
3.27 |
2.56 |
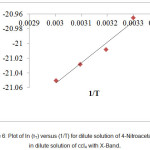 |
Figure 6: Plot of ln (τT) versus (1/T) for dilute solution of 4-Nitroacetanilide in dilute solution of ccl4 with X-Band.
|
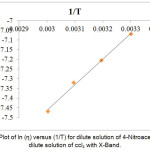 |
Figure 7: Plot of ln (η) versus (1/T) for dilute solution of 4-Nitroacetanilide in dilute solution of ccl4 with X-Band.
|
Table 4: Experimental Values of Energy Activation Parameters (∆Fε, ∆Hε and ∆Sε) for dielectric relaxation Process and Energy Activation Parameters (∆Fη, ∆Hη and ∆Sη) for Viscous Flow Process in (cal/Mol) of 4-Nitroacetanilide in the dilute solution of Carbon tetrachloride at four different temperatures using X-Band microwave bench.
|
Temperature |
∆Fε |
∆Hε |
∆Sε |
∆Fη |
∆Hη |
∆Sη |
|
303 |
1676.49 |
553.31 |
-3.71 |
3196.64 |
2618.46 |
-1.908 |
|
313 |
1705.06 |
-3.68 |
3218.43 |
-1.917 |
||
|
323 |
1746.64 |
-3.69 |
3247.85 |
-1.948 |
||
|
333 |
1786.30 |
-3.70 |
3251.33 |
-1.900 |
Conclusion
In the present paper, values of different dielectric parameters, dielectric relaxation times and activation energies have been calculated and discussed for the dilute solution of 4-Nitroacetanilide with carbon tetrachloride at various temperatures and mole fractions using standard methods. The dielectric parameters are varying with the weight fractions of the solute in carbon tetrachloride. The values of relaxation times show the presence of more than one relaxation process in the system. The variation of dipole moment values with temperature may be due to the increase in the size of dipole. The values of the energy parameters for the dielectric relaxation process and for the viscous flow process are measured and compared which suggest that the dielectric relaxation process may be treated as a rate process just like the viscous flow process.
Acknowledgement
The authors are thankful to the Vice Chancellor, The IIS University for providing the necessary facilities for this work.
References
- Chemical Book
- Dyes and Dye Intermediates” in Kirk‑Othmer Encyclopedia of Chemical Technology, Peter Gregory
- Gedam, S. B.; Suryavanshi, B. M. Int. J. Appl. Phys & Maths. 2013, 3, 302.
CrossRef - Khan, A. M. A.; Subramanian, M. Int. J. Innov. Res. sci. Eng. Technol. 2014, 3, 16014.
- Subramanian, M.; Sathish. Int. J. of Scientific Research & Education. 2016, 4, 4810.
- Thakur, N.; Sharma, D. R. Ind. J. Pure & Appl. Phys. 2000, 38, 328.
- Vyas, A. D.; Rana, V. A.; Ind. J. Pure & Appl. Phys. 2002, 40, 69.
- Choudhary, A.; Ahire, S.; Mehrotra S. C.; J. Mol. Liq. 2001, 94, 17.
CrossRef - Rewar, G. D.; Bhatnagar, D. Ind. J. Pure & Appl. Phys. 2002, 40, 430.
- Sharma, V.; Thakur, N.; Sharma, D. R.; Negi, N. S.; Rangra, V. S. Ind. J. Pure & Appl. Phys. 2007, 45,163.
- Heston, W. M.; Franklin, A. D.; Hennelly, E.J.; Smyth, W.P., J. Amer. Chem. Soc. 1950, 72, 3443.
CrossRef - Fishbeck, H. J.; Fischbech, K. H. Formula, facts and constants (Springer-Verlag, USA) 1987.
- Aggaraval, C.; Arya, R.; Gandhi, J. M.; Sisodia, M. L. J. Mol liq. 1990, 44,161.
- Higasi, K. Bull Chem Soc. 1966, 39, 2157.
CrossRef - Glasstone, S., K. J. Laidler and H. Eyring (1941) The Theory of Rate Process, p. 611, McGraw Hill, New York.
- Jain, R.; Bhargava, N.; Sharma,,K..S.; Bhatnagar, D. Ind. J. Pure & Appl. Phys. 2011, 49, 401.
- Jain, R.; Bhargava, N.; Sharma, K. S.; Bhatnagar, D. Int. J. Sci. Environ. Technol. 2013, 2, 416.
- Ganesh, T.; Maria Sylvester, M.; Bhuvaneswari, S.; Jeevanantham, P.; Kumar, S. J. appl. Phys. 2014, 6, 59.
- Nemmaniwar, B. G. Int. Res. J of. Science. & Engineering. 2017, 5,31.
- Kalaivani, T.; Krishnan, S. Ind. J. Pure & Appl. Phys. 2009, 47, 383.
- Singh, A. K. J. ultra sci. phys.sci. 2017, 29,171.
- Kumar, R.; Rangra, V. S.; Sharma, D. R.; Thakur, N.; Negi, N. S. Z. Naturforsch. 2006, 61a, 197.
- Kumar, R.; Kumar, R.; Rangra, V. S. Z. Naturforsch. 2010, 65a, 141.

This work is licensed under a Creative Commons Attribution 4.0 International License.


