Optimization of Lipase-Catalyzed Synthesis of Fatty Hydroxamic Acids from Terminalia Catappa L. Kernel Oil
Dedy Suhendra , Erin Ryantin Gunawan, Emmy Yuanita and Muhammad Nazili
Department of Chemistry, Faculty of Mathematics and Science, University of Mataram Jl. Majapahit No. 62, 83125, Mataram, Indonesia.
Corresponding Author E-mail: dedysuhendra@unram.ac.id
DOI : http://dx.doi.org/10.13005/ojc/340518
Article Received on : 03-05-2018
Article Accepted on : 02-10-2018
Article Published : 16 Oct 2018
Fatty hydroxamic acids (FHA) have been successfully synthesized from Terminalia catappa L. (local name: ketapang) kernel oil by a one-step lipase catalyzed reaction. The use of immobilized lipase as a catalyst to synthesize FHA has several advantages such as a simple purification of product and environmentally friendly. In addition, it also allows the reaction to be carried out under mild conditions, which reduces the reaction’s side products. The optimal reaction condition obtains were 40°C temperature reaction for 25 h with the ratio of ketapang seeds oil (g): hydroxilamin (mmol) is 1 : 2.861 mmol and the ratio of lipase enzyme (g): ketapang kernel oil (g) is 0,015: 1. Amount of hydroxamic group in 1 gr of sample is 2.46 mol. Qualitative test of FHAs was carried out by color test and FTIR. Complex colors of the FHA with copper (II) and iron (III) are green and dark red, respectively. For FTIR analysis of FHAs group, various peak appeared such as C=O amide (1685 cm-1), O-H (3434 cm-1), N-H (3261,09 and 1568,64 cm-1) and C-N (939,91 cm-1).
KEYWORDS:Enzymatic Reaction; Fatty Hydroxamic Acids; Ketapang Kernel Oil
Download this article as:| Copy the following to cite this article: Suhendra D, Gunawan E. R, Yuanita E, Nazili M. OOptimization of Lipase-Catalyzed Synthesis of Fatty Hydroxamic Acids from Terminalia Catappa L. Kernel Oil. Orient J Chem 2018;34(5). |
| Copy the following to cite this URL: Suhendra D, Gunawan E. R, Yuanita E, Nazili M. Optimization of Lipase-Catalyzed Synthesis of Fatty Hydroxamic Acids from Terminalia Catappa L. Kernel Oil. Orient J Chem 2018;34(5). Available from: http://www.orientjchem.org/?p=50925 |
Introduction
Hydroxamic acid (N-hydroxy carboxylic acid) is a derivative compound of nitrogen compound that binds hydrogen in its hydroxilamine molecular with -CO-NH-OH (R = alkyl or aryl).1 Hydroxamic acid derivatives have received much attention because of its biological activity, like as an antibiotic, anti-fungal, additives in food, cell division factors,2 anti corrosion,3 enzyme inhibitors, inhibitors of tumor and cancer.4 Hydroxamic acid complexes with several metal ions have been used in analytical chemistry as reagents for gravimetric, and for extracting metal ions from the aqueous phase.5-6 One of type of hydroxamic acid is a long chain hydroxamic acid, such as FHA. Long chain hydroxamic acid is widely used as a surfactant in the pharmaceutical and soap industries.7,8
The FHA can be synthesized in two ways such as chemically and enzymatically. Hydroxamic acid can be chemically synthesized using the Blatt method.6 Alkyl or aryl ester is reacted with hydroxylamine using an alkaline catalyst. However, this reaction is not complete. The use of a base could evoke the decomposition or degradation of the double bond on the product.9 In addition, hydroxamic acid can also be synthesized by using Chi procedure10 by reacting the ester with hydroxylamine and using KCN catalyst. However, this reaction faces problems like if the reacted compounds contain reactive groups such as double bonds, prior protection of functional groups should be performed so that the synthesis procedure becomes longer.
In addition to the chemical methods, hydroxamic acid or FHA synthesis can be performed by enzymatic methods. One of the enzymatic methods of FHA synthesis can be performed by Suhendra et. al. method6. In this method, FHA is synthesized from palm oil with hydroxylamine and lipase enzymes as the catalyst, then it is reacted in a water bath shaker with n-hexane solvent. The advantage of the enzymatic synthesis method is a specific reaction, mild reaction condition, environmentally friendly process and simple purification process.11,12
The other studies of enzymatic synthesis of FHA is the tiohydroxamic synthesis of palm oil with lipase catalyst,7 the enzimatic synthesis of FHA of coconut oil,6 and the synthesis of fatty phenyl hydroxamic acids of coconut oil with the lipase enzymes.8 From a few studies that have been mentioned above, the raw material use edible oil. Therefore, it is required the other raw material such as non-edible oil.
One of the non-edible vegetable oil sources is Ketapang kernel oil (Terminalia catappa Linn). Ketapang kernel oil contains long and medium chain fatty acids so this oil has great potential to be used as raw material in the fatty hydroxamic acids synthesis. Ketapang plants are widely distributed in Indonesia and are not included in the seasonal plants, meaning that ketapang can bear fruit throughout the year.
Ketapang kernel oil content (triglyceride) is fifty six percent, aproximately. The fatty acids composition of ketapang kernel oil are palmitic acid (35.26%), palmitoleic (0.38%), stearic (4.55%), oleic (38.72%), linoleic (20.57%), Arakhidat (0.51%) and others 0.01%.11,13 Ketapang oil also has a characteristic physical-chemical properties so that it is suitable to be used as a base materials.11, 12, 13 For that reason, ketapang kernel oil has the potential to be used as raw material of FHA synthesis.
Experimental
Materials
The chemicals used were pro analysis grade including hexane, silica gel, hidroxilamine hydrochloride from Sigma Aldrich USA, Sodium Sulfat from Merck Germany, commercial enzyme (Lipozyme TL. IM, from Novo Nordisk) and Terminalia catappa L.(ketapang) kernel.
Apparatus
The apparatus used in this research were rotary evaporator, horizontal water bath shaker, FT-IR spectrophotometer from Perkin Elmer Model Frontier, Column Chromatography, and Kjeldahl Flask
Extraction of Ketapang Kernel
Ketapang kernel extraction uses soxhletation method. Previously, the ketapang kernel was dried and mashed. The soxhletation process was running for 6 h with 250 ml of n-hexane solvent. The oil is then evaporated to remove the n-hexane solvent with a rotary evaporator at 40°C with a rotation speed of 120 rpm and it is added of Sodium Sulfate to remove the moisture.
Optimization of Fatty Hydroxamic Acids Synthesis
Optimization of Ketapang Oil Mass
Fatty hydroxamic acids synthesis is done by varying the amount of ketapang oil mass, such as 0.5, 1.0 , 1.5, 2.0, 2.5, 3.0, 3.5 and 4 g while other variables are remained with the composition of 0.02 g of lipase, 10 mmol of hydroxilamine hydrochloride and 15 mL of n-hexane. The mixture is incubated in a water bath shaker for 24 h at the temperature of 40°C with a rotation speed of 100 rpm. Then, the hydroxamic acids purification process is performed. The pure product of hydroxamic acids was quantitated gravimetrically.
Optimization of the Amount of Lipase
Fatty hydroxamic acids synthesis is done by varying the amount of lipase, such as 0.01, 0.02, 0.03, 0.04, 0.05 and 0.06 g. The others variables are remained with the composition and treatment as in described earlier. The optimum of ketapang oil mass was used in this step.
Optimization of Reaction Temperature
Fatty hydroxamic acids synthesis is done by varying the synthesis temperature, such as 30, 35, 40, 45 and 50°C. The other variables are remained with the composition and treatment as in describe earlier. The optimum of ketapang oil mass and amount of lipase were used in this step.
Optimization of Reaction time
Fatty hydroxamic acids synthesis is done by varying the synthesis time, such as 5, 10, 15, 20, 25, 30, 35 and 40 h. The other variables are remained with the composition and treatment as in as in describe earlier. The optimum of ketapang oil mass, amount of lipase and temperature were used in this step.
Fatty Hydroxamic Acids Synthesis in Optimum Condition
FHA were synthesized at the optimum condition that has been obtained in previous experiments. FHA was formed at the interface of water -hexana. To obtain a solid FHA, fraksi n-hexane is cooled in a freezer (<-5°C) for 4 h and it was filtered. The next step, FHA solid was washed with n-hexane and It was dried in the desiccator that has been filled with phosphorus pentaoksida for 24 h.
Characterization of Fatty Hydroxamic Acid
Qualitative Test
Color Test
Qualitative analysis of hydroxamic acid with color test is performed by reacting FHA with a solution of iron (III) and copper (II) in methanolic solution. Cu solution used is 1 M of CuSO4 and 2% of FeCl3. The positive test is indicated by the formation of colored complex in the solution indicating the presence of hydroxylamine group in the sample solution.
Fourier Transform Infrared (FTIR) Spectroscopy
Qualitative analysis of the functional groups of FHA formed is performed by measuring the FTIR spectrum by using KBr pellets. Spectrum of FHA was then compared with the FTIR spectrum of ketapang oil. To ensure that the C=O ester has changed to C=O amide and the formation of the C-N bond.
Quantitative Test
Quantitative analysis was performed by determining the amount of nitrogen contained in FHA synthesized by using the Semi Macro Kjeldhal. Amount of FHA (0.5 g), 2 g of Na2SO4-CuSO4 (20: 1) and 5 mL of H2SO4 concentrated were inserted into the Kjeldahl flask. The next stage, all ingredients were heated in an electric heater until a clear blue solution (destruction process). The destruction product was cooled and it added 150 mL distilled water, 25 mL 40% NaOH. Then, the distillation process was running. The distillate is collected to a volume of 150 mL in the erlenmeyer flask where the flask was filled 2% of borax acid by 10 mL and mixed indicator. Distillate was then titrated with 0.1M of HCl until the equivalence point that is indicated by the change of color from yellow to pink. The blank was also gets the similar treatment as the samples.14
Results and Discussion
Extraction and Purification of Ketapang Kernel Oil
Based on the results of the process of sokletasi and purification, ketapang kernel oil content is 59.75% of 60 g of dried kernel powder. Oil content obtained is slightly higher than the amount of oil obtained by Janporn et. al.13 that is equal to 57,5 %. It can be influenced by the geographical conditions where the plants grow which result in the differences in oil content.15
Optimization of FHA Synthesis
Optimization of Ketapang kernel Oil Mass
Optimization of Ketapang kernel oil mass is aimed to investigate at the effect of the amount of substrate (oil) on the synthesis of FHA. The variation of the oil mass used in this study is 0-4 g with an interval of 0.5 g while the other variables remain. From the observation, it is obtained the following data:
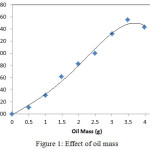 |
Figure 1: Effect of oil mass. |
Based on the graph (Fig. 1.), it appears that the product increases with the increased substrate. It is starting from 0 to 3.5 g. How ever, after the amount of substrates is over 3.5 g, the product is decreased. According to Worthington,16 the amount of excess substrate can inhibit the action of enzymes. The reason is that if considerable substrate will cause competition among the substrate to stick to the active side of the enzyme surface. This causes the active side of enzyme is blocked and also it prevent the other substrates to react. Therefore, the addition of substrate after reaching the maximum point will be the cause of the decline of FHA products. It is also supported by Gunawan and Suhendra’s study17 when the substrate concentration is excessive, it can increase the viscosity of the solution so that interaction between the reactants become ineffective and be able to inhibit the reaction.
Optimization of Amount of Enzyme
Based on the finding of the research, it can be seen in the lipase mass at interval of 0.01 to 0.03 g, the product (FHA) increased significantly with the addition of enzyme lipase. This is due to the higher amount of lipase used, the reaction rate will be increased so that the optimum point will be more quickly achieved.
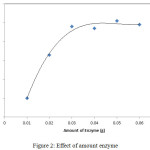 |
Figure 2: Effect of amount enzyme. |
The optimum point in the enzymatic reaction is usually achieved by the use of enzymes in 1.5% of the subtrate mass.17 This relationship can be used when there is no limiting factors such as low subtrate concentrations, the existence of activators, inhibitors, or the effect of mass transfer. However, in the addition of enzyme mass of more than 0.03 g, However, in addition of enzyme mass of more than 0.03 g, the product increase becomes insignificant. It shows that the amount of enzyme used has reached the optimum point. The addition of the enzyme amount will not increase the product significantly. This is indicated by a flat curve. The addition of an excess amount of enzyme can lead to an excess of the active side of enzyme molecule. However, if the excess of enzyme is not supported by an adequate amount of substrate it will not significantly increase the amount of products.
Optimization of Reaction Temperature
In this study, temperature optimization was carried out by varying the temperature from 30 to 50°C with 5°C intervals. Based on the results, it was observed that from 30 to 40°C, the product increased significantly as the temperature increased. The increase of this product because if the temperature increases, the substrate solubility will increase. The higher temperatures will also increase the collision between enzymes and substrate molecules so that the reaction rate will increase.18
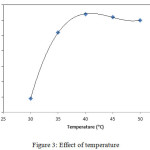 |
Figure 3: Effect of temperature. |
In this study, the optimum temperature of FHA synthesis of ketapang oil is 40°C. At temperatures above 40°C, it appears the decrease of the products. This is because the enzymes can be denatured at high temperatures.19 Islam,20 reported that the lipase is very active at temperatures of 30-40°C. In an enzymatic reaction, the enzyme loses its activity if the temperature is increased beyond its optimum temperature.21
Optimization of Reaction Time
Time is an appropriate indicator to determine the ability of an enzyme to catalyze a reaction. The oppurtune enzymes is an enzyme that has a short time to obtain optimum results (products). The short time to achieve the optimal results, will cause the cost incurred more economically. The optimation of reaction time is performed by varying the reaction time from 0 to 40 h with interval of 5 h. Figure 4 has illustrated that at the reaction time of 0 to 25 h, the product was increased significantly. The fastest time to obtain the optimum result is 25 h.
After the reaction time above 30 h, the graph curve is stable. This is indicates that the product obtained does not increase significantly. The decrease of this reaction rate can be caused by two factors: (i) the mass transfer limitations that cannot be avoided because in the reaction mixture, there is a proportion of solid products that are large enough to limit the interaction between substrate and enzyme, and (ii) the reaction has reached a state of equilibrium in which the forward reaction is equal to its reverse reaction rate.9
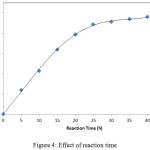 |
Figure 4: Effect of reaction time. |
Fatty Hydroxamic Acids Synthesis
FHA was synthesized by using the optimum conditions (Table 1.) which have been obtained, previously from the optimization study.
Table 1: The optimum conditions of FHA synthesis.
|
No. |
Optimization Parameter |
Condition |
|
1. |
Reaction time (h) |
25 |
|
2. |
Reaction temperature (°C) |
40 |
|
3. |
Ratio of the enzyme lipase (g): Oil (g) |
0.015 : 1 |
|
4. |
Ratio of hydrochloride (g): Oil (g) |
2.86 : 1 |
At this stage, FHA synthesized by reacting hydroxylamine hydrochloride (NH2OH.HCl) with ketapang kernel oil and lipase enzyme. Before The reaction process, hydroxylamine hydrochloride was dissolved in water (distilled water) while oil was diluted in n-hexane. Selection of water as a solvent because water is a very easy solvent to dissolve polar substances such as hydroxylamine hydrochloride. In addition, water is a solvent that is very abundant, cheap and it does not form byproducts so it can ease to the purification process of the desired products.22 Hydroxylamine hydrochloride that have been dissolved then it was neutralized by added of 2 M NaOH. The addition of NaOH aims to neutralize HCl contained in NH2OH.HCl that forms salts (NaCl) and water (H2O). The neutralization is particularly important because the lipase enzyme can work optimally at pH of 7. PH is too low or too high from the optimum pH enzyme activity can lead to the denaturation process resulting in decreased activity.16 Meanwhile, selection of n-hexane as an oil solvent because it is non-polar that can easily dissolve oil which is also non-polar. According to Holdy et. al. 23 the solvent that gives the best results for the FHA synthesis from vegetable oils is n-hexane.
Based on the observations, after each reactant is mixed, it appears that the formulation of two immiscible solution phase, the phase of n-hexane contains the oil which is above and the aqueous phase (hydrochloride solution) is below. The separation process occurs because the hexane and aqueous phases have different polarity characteristic.24, 25 The density of water is greater when compared to n-hexane, so the aqueous phase is below hexane phase. The density of water is (ρ = 0.997 g/cm3), while n-hexane is (ρ = 0.66g/cm3) at a temperature of 298 K.26 Then after the reactants are added with lipase enzyme, it appears that the enzyme is in the aqueous phase. This is because the enzyme lipase is polar. According to Zambon et al.,27 and Oh et. al.,28 lipase is a polar catalyst and it has a high solubility in water. However, because it has shaped immobilized lipase, so the lipase becomes insoluble and it is on layers of n-hexane and water. The formation reaction of hydroxamic acid occurs between the water layer with n-hexane layer. The triglycerides or oil dissolves in n-hexane and hydrochloride dissolve in water, so the maximum reaction occurs between the water layer and the n-hexane layer.29
After the reactant was reacted in a water bath shaker for 25 h at 40°C, the reaction proceeded to be turbid. These changes indicated the occurrence of reactions on the reactants. The appearance of turbidity in the n-hexane fraction is due to the formation of a novel product which is a FHA which is soluble in n-hexane. If the reaction product is cooled to -4oC the FHA in the hexane fraction will be freeze. The FHA can be separated from solvent through degradation process of temperature reduction.30
The reaction scheme among of ketapang oil and hydroxylamine with an enzyme catalyst is illustrated as below. The reaction products are FHA and glycerol as by products. Glycerol is dissolves in water, therefore, it is easily separated from the main product. The scheme is as follows:
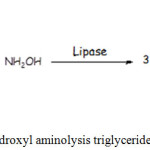 |
Figure 5: Hydroxyl aminolysis triglycerides reaction. |
The reaction indicates that triglyceride reacts are assumed to have two oleic chains and one palmitate chain since the ketapang seed oil contains mostly an oleic and a palmitic fatty acid of 38.72% and 35.26%, respectively.13 Hence, it can be assumed also most of the FHA formed is hydroxamic oleic acid (liquid form) and hydroxamic palmitic acid (Solid form).
The percentage of FHA is 50.05%, approximately. This synthesis results are not much different from FHA of coconut oil that is 49.59%.6 However, the percentage is lower when compared to the percentage of FHA synthesis of palm olein and stearin.23 The low percentage could be influenced by the differences in the composition of fatty acids in triglycerides or a minor part of FHA liquid form is still dissolved in hexane.
Characterization of Fatty Hydroxamic Acids
Qualitative Analysis
Color Test
The product is reacted with Fe(III) and Cu(II) solutions, and the observable colors of both reactions are dark red and green, respectively. This is appropriate with the typical characteristics of fatty hydroxamic acids, in which the hydroxamic groups will form a complex with a dark red color with Fe (III) and a complex with green color with Cu (II).
FTIR Test
FTIR spectrum of FHA synthesized, it appears that the typical absorption that is at 3434.48 cm-1 a OH bond, and at the wave number of 3261.09 cm-1 is N-H bond and is supported by N-H absorption at 1568.64 cm-1. At the wave number of 2921 cm –1 and 2850 cm-1, there is a C-H streaching of long aliphatic alkyl chain. Besides, it appears that the absorption of C=O amida is at 1685 cm-1. Meanwhile, The spectrum of the ketapang kernel shows the C=O esters having slightly different wave numbers of 1700 cm-1. This is indicate that FHA has been synthesized from ketapang oil, C = O ester has changed to C = O amide. The other information, at the wave number of 939.91 cm-1 is the absorption of C-N that is previously not appear in the FT-IR spectrum of ketapang oil. The value of wave numbers of hydroxamic acid is appropriate with the results of Al-Mulla, et. al., Holdy et. al., and Stuart7,23,31
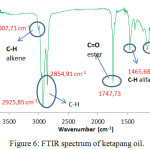 |
Figure 6: FTIR spectrum of ketapang oil. |
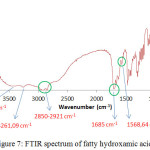 |
Figure 7: FTIR spectrum of fatty hydroxamic acids. |
Quantitative Analysis
From the analysis, the total amount of N contains in the sample of FHA is 3.45%. This shows that there are 2.46 mmol of hydroxamic groups in 1 g of sample of FHA synthesized from the ketapang kernel oil. The total amount of nitrogen in these FHA is lower when compared with the amount of FHA synthesized from acids from coconut oil (4.32%).6 This is due to alkyl chain of the fatty acid in ketapang oil is longer than the coconut oil.
Conclusions
FHA has been successfully synthesized via enzymatic reaction from ketapang kernel oil and the percentage yield of 50.05 %. The optimum reaction conditions have been successfully investigated. It is necessary to conduct research on the application of FHA synthesized from ketapang kernel oil for the further development of utilization.
Acknowledgement
This project was financed by the Directorate General of Research and Development Strengthening, The Ministry of Research Technology and Higher Education of Republic of Indonesia.
References
- Lee, T.S., Jeon D.W. Kim J.K ., Hong, S.I. Fibers and Polymers 2001. 2(1): 13-17.
CrossRef
- Kurzak, B., Kozlowski A., Farkas F. Coordin. Chem. Rev. 1992. 114: 169-200.
CrossRef - Deng, H., Nanjo H., Qian P., Xia Z., Ishikawa I., Suzuki T.M. Electrochim Acta 2008. 53: 2972-2983.
CrossRef - Anandan, S.K., Ward, J.S., Brokx, R.D., Mark, T.D., Bray, R., Patel, D.V., Yi Xiao, X. Biorg. Med. Chem. Lett. 2007. 17: 5995-5999.
CrossRef - Suhendra, D., Haron, M.J., Silong, S., Basri, M, Wan Yunus, W.M.Z. Ind. J. Chem. 2006. 6(2): 165-169.
- Suhendra, D., and Gunawan, E.R. J. Natur Ind. 2012, 14(2): 160-164.
- Al Mulla, E. A. J., Wan Yunus, W.M.Z., Ibrahim, N.A, Rahman, M.Z.A. J. of Oleo Sci. 2010. 59(11): 569-573.
CrossRef - Jahangirian, H., Haron, M.J, Silong, S., Yusof, N.A. J. Oleo Sci. 2011. 60(6), 281-286.
CrossRef - Suhendra, D., Wan Yunus W.M.Y., Haron, M.J., Basri, M., Silong, S. J. Oleo Sci., 2005. 54(1): 33-38.
CrossRef - Ho, C.Y. and Strobel, E.D. Preparation Of Hydroxamic Acids From Ester In Solution And On The Solid Phase 2006, United States Patent, USA.
- Suhendra, D., Gunawan, E.R., Nurita, A.D., Adriano, T., Komalasari, D. J. Oleo Sci. 2017. 66(3): 209-215.
CrossRef - Gunawan, E.R., Suhendra, D., Nurita, A.D., Komalasari, D. Asian J. Chem. 2017. 29(10): 2107-2112.
CrossRef - Janporn, S. Ho, C.T. Chavasith, V., Pan, M. Chittrakorn,S., Ruttarattanamongkol, K., Weerawatanakorn, M. J. food drug anal. 2015. 23(2): 201-209
CrossRef - Latimer, G. W. Jr. (Editor), Official Methods of Analysis of AOAC Internasional-20th 2016.
- Manzoor, M., Anwar, F., dan Iqbal, T. JAOCS 2007. 84: 413-419.
CrossRef - Worthington, V. Introduction to Enzymes 2010. Worthington Biochemical Corporation, New Jersey.
- Gunawan, E.R. and Suhendra, D. JMS, 2008. 13(3): 76-83.
- Moghaddam, M.G., Ahmad, F.B.H., Basri, M., Rahman, M.B.A., , J. App. Sci., 2010, 10(4): 337-342.
- Gunawan, E.R., Basri, M. Rahman, M.B.A. Rahman, R.N.Z., Salleh, A.B. J. Oleo Sci., 2004. 53(1): 471-477.
CrossRef - Islam, M. E., Parveen, F., Hossain, K., Khatun, S., Karim, M.R., Kim, G.S., Absar, N., and Haque, M.S., Thai. J. Agr. Sci. 2009. 42(2): 71-80.
- Daniel, R.M. Peterson, M.E. Michael J, Lee, C.K. Biochem. J. 2009. 425(2): 353-60.
CrossRef - Kno1chel, P., Modern Solvents in Organic Sythesis, Germany : Springer-Verlag Berlin Heidelberg 1999.
- Holdy, W.H, Ahmad, M. B., Al Mulla, E. A. J. Wan Yunus, W. M. Z, N.A. Ibrahim, J. Oleo Sci. 2010. 59(1), 15-19.
- Liauw, M.Y., Natan, F.A., Widiyanti, P., Ikasari, D., Indraswati, N., Soetaredjo, F. E., J. Eng. App. Sci., 2008. 3(3): 49-54.
- Otto, S. and Engberts, J.B.F.N, Pure App. Chem., 2000. 72(7):1365–1372.
CrossRef
- Tikhonov, A.M. J. Exp. Theoritic. Phy. 2010. 110(6): 1055-1057.
CrossRef - Zambon, A., Bertocco, S., Vitturi, N., P olentarutti, V., Vianello, D. dan Crepaldi, G., Biochem. Soc.Transactions, 2003. 31(5): 1070-1074.
CrossRef
- Oh, J.M., Lee, D.H., Song, Y.S., Lee, S.G., Kim, S.W. J. Ind. Eng. Chem. 2007. 13(3):429-433.
- Isha, A., Yusof, N.A.,Ahmad, M., Suhendra, D., Yunus, W.M.Z.W., Zainal, Z. Spectrochim. Acta Part A: Mol and Biomolec. Spec. 2007. 67(5): 1398-1402.
- Blattner, C., 2005, Biocatalysis using lipase immobilised in organogels in supercritical carbon dioxide, Disertation, University of Regensburg.
- Stuart, B. 2004, Infrared Spectroscopy : Fundamentals and Aplications, England: John Willey and Sons, Ltd.
CrossRef

This work is licensed under a Creative Commons Attribution 4.0 International License.


