Synthesis, Characterization and Applications of Zno/Tio2/Sio2 Nanocomposite
Chitra Manoharan1,2, Venckatesh Rajendran2 and Rajeshwari Sivaraj2
1R and D Centre, Bharathiar University, Coimbatore – 641 046, India.
2Department of Chemistry, Government Arts College, Udumalpet – 642 126, India.
Corresponding Author E-mail: rvenckat@gmail.com
DOI : http://dx.doi.org/10.13005/ojc/340319
Article Received on : November 16, 2017
Article Accepted on : February 17, 2018
Article Published : 06 May 2018
ZnO/TiO2/SiO2 (ZTS) nanocomposite was synthesized using microwave assisted sol-gel method and characterized using UV–Visible spectroscopy, XRD, SEM, EDX, FT-IR and TEM analysis. XRD results showed the crystallite in anatase phase. FT-IR reports bands that appeared at 1108 and 862 cm-1which shows the formation of Si-O-Si and Zn-O-Ti bonds. SEM and EDX analysis showed the incorporation of ZnO nanoparticle with the TiO2/SiO2 nanocomposite which increase the separation of electron-hole pairs and can enhance in photocatalytic activity on methylene blue dye under sunlight irradiation. Ultrasound irradiation was applied for the impregnation of ZTS nanocomposite with homogeneous distribution on cotton fabrics. The antibacterial activities of the ZTS impregnated cotton fabrics observed against Escherichia coli (Gram negative) and Staphylococcus aureus (Gram positive) cultures was significant. The effectiveness of fabric treatment is assessed by excellent Ultraviolet protection factor (UPF).
KEYWORDS:Nanocomposite; Microwave Irradiation; X-ray Diffraction; SEM; TEM; Antibacterial Activity
Download this article as:| Copy the following to cite this article: Manoharan C, Rajendran V, Sivaraj R. Synthesis, Characterization and Applications of Zno/Tio2/Sio2 Nanocomposite. Orient J Chem 2018;34(3). |
| Copy the following to cite this URL: Manoharan C, Rajendran V, Sivaraj R. Synthesis, Characterization and Applications of Zno/Tio2/Sio2 Nanocomposite. Orient J Chem 2018;34(3). Available from: http://www.orientjchem.org/?p=45518 |
Introduction
Metal oxide nanoparticles have attracted great attention in recent years on account of their special electronic and chemical properties [1]. Titanium dioxide (TiO2) is mostly used due to its high physical and chemical stability, low cost and toxicity [2, 3]. Due to the large band gap of silicon dioxide (SiO2), enhances the photocatalytic activity of other oxide materials with the addition of it [4, 5]. Kim et al. [6] also proposed that, the introduction of silicondioxide to other metaloxides increases the band gap energy.
TiO2/SiO2 composite has increased potential application in the field of varied photocatalysis, as they show improved photocatalytic and thermal properties simultaneously when compared to pure TiO2 [7]. Coupled semiconductor photocatalyst of TiO2/ZnO has been reported to enhance the photo degradation efficiency of TiO2 catalyst and studies on improving the photocatalytic efficiency have been reported [8-11]. Zinc oxide has achieved applications in various areas such as optical, magnetic and gas sensing and apart from these, zinc compounds have been generally regarded as safe [12]. In recent years, ZnO and TiO2 nanostructures have attracted great attention in both fundamental studies and applications [13].
The rapid heat transfer of microwave irradiation allows the chemical reactions much faster as compared to usual heating methods, ensuing increased product yield. [14].The kinetic or thermodynamic pathways of the temperature sensitive reactions can be selectively tuned by microwave irradiation [14]. Microwave synthesis is the convenient method for the synthesis of metal oxide semiconductor nanoparticle [15]. Nano coating on the surface of textiles and clothing enhance the material for UV blocking; antimicrobial and self-cleaning properties have also been reported [16].
Sonochemical irradiation has been proven as an effective technique for the synthesis [17], as well as for the deposition and insertion of nanoparticle on/into fabrics [18-20]. The deposition of nanoparticles on fabrics involves the formation of microjets from auditory bubble, which push the nanoparticle onto the surface of the fabric at a high speed causes [21].
The aim of this work is to synthesize and characterize the ZTS nanocomposite using microwave assisted sol-gel method. The photocatalytic studies were performed for methylene blue dye and antibacterial activity of the sonochemically coated cotton fabrics has also been investigated.
Materials and Methods
Materials
The chemicals such as titanium tetraisopropoxide (TTP) (Ti{OCH(CH3)2}4 ,99.9%, Merck), as a titanium precursor, Silicic acid (H2SiO3, 99.9%, Merck) as silica source, zinc acetate dihydrate (Zn (CH3COO) 2·2H2O, 98.0%, Merck) as zinc oxide source, Congo red (Merck), ethanol (C2H5OH, 99.9%, Merck), hydrochloric acid (HCl) (99.9%, Merck), isopropanol( (CH3)2CHOH, 99.0%, Merck), tetrahydrofuran (THF) ((CH2)4O, 99.5%, Merck) and potassium hydroxide (KOH) (85.0%, Merck) were used in this study.
Synthesis of ZnO/TiO2/SiO2 [ZTS] Nanocomposite
Firstly, ZnO nanoparticle were synthesized by alkali precipitation method from the aqueous solution of Zn (CH3COO) 2·2H2O and KOH [22].
TiO2/SiO2 sol was prepared by mixing the sols of TiO2 and SiO2, which were prepared by stirring HCl, ethanol and TTIP (Titanium tetraisopropoxide) (1:4:2 ratio) and silicic acid with THF (Tetrahydrofuran) (1:2 ratio) [23].
The ZnO suspension was prepared by dispersing the calculated amount of ZnO in 100ml deionised water, and isopropanol was added to the mixture in order to immerse ZnO thoroughly. Then the suspension was added to the TiO2/SiO2 sol, stirred magnetically for 30 min. The resulting aqueous solution was introduced in microwave irradiation for 15 min. The reaction products were filtered and washed with deionised water followed by ethanol to remove the ions probably left over in the final product and dried in hot air oven at 800C to obtain the ZTS nanocomposite.
Characterization of Synthesized ZTS Nanocomposite
The optical properties of the synthesized ZnO/TiO2/SiO2 nanocomposite were analysed using UV-Visible spectrophotometer (UV-1700 Series, Shimadzu), the crystalline structure analysed by D8 Advance X-ray diffraction (Shimadzu lab X-6000) .Surface morphology was determined by scanning electron microscopy (SEM) (Model JSM 6390LV, JOEL, USA), the elemental analysis by EDX and the functional groups by Fourier transform infrared spectroscopy (FTIR) (Bruker, Germany). The morphology and size were determined by transmission electron microscopy (TEM) (JEOL JEM-3100F).
The photocatalytic activity of the synthesized ZTS nanocomposite was studied by the decolourization of the aqueous solution of methylene blue under sunlight. All the experiments were carried out in an open 100 ml Pyrex vessel under identical conditions [24]. The experiments were conducted at different concentrations (20, 40, 60, 80, 100 mg/l) of dye solutions at a photocatalyst load from 0.1 to 0.5 g. The efficiency of the catalyst was calculated using the following equation
R (%) = (A0 – (A/A0)) × 100 —- (1)
Where A0 and A are the absorbance of dye solution before and after decolourization respectively [25].
The coating process was carried out by using ultrasonicator.1 piece of 10 X 10 cm fabric (100% cotton) and ZTS nanocomposite was added to the solution of 4:1 ethanol/ ethylene glycol in a 100ml sonication flask. The sonication was conducted by 70% amplitude of 750W booster sonicator (Ti-horn, 20 kHz). The reaction mixture was irradiated for 2hrs with high intensity ultrasonic horn and the fabric was washed with ethanol and dried out under vacuum [21].
The morphology of the cotton fabric alone and the nanocomposite coated cotton fabrics were studied by SEM analysis. The UPF (Ultraviolet protecting Factor) of ZTS nanocomposite coated cotton fabric was assessed by using the most accepted standard AATCC test method 183.
The antibacterial activity of the cotton fabrics against Staphylococcus aureus (gram positive) and Escherichia coli (gram negative) bacteria strains were tested using well diffusion method [26, 27].
Results and Discussion
Characterization of Synthesized ZTS Nanocomposite
UV-Vis absorption spectra of ZTS nanocomposite is shown in Fig.1.The peak observed at about 222nm can be attributed to the transfer of an electron from O2- to Ti4+ ions of the highly dispersed tetrahedral coordinated TiO4 unit. Anbo et al., have reported that the tetrahedral coordination of titanium oxides can be chemically supported onto silica matrix [28]. An excitonic absorption peak is found at about 248 nm due to the ZnO nanoparticle which lie much higher than the band gap wavelength of 358 nm (E g =3.46 eV) due to the inverse relationship of the energy of a photon (E) and the wavelength of the light (λ) [29].
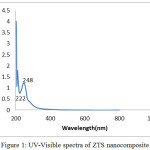 |
Figure 1: UV-Visible spectra of ZTS nanocomposite Click here to View figure |
FT-IR spectrum of the ZTS nanocomposite (Fig.2) has two distinctive bands that appeared at around 862 cm-1 and 1108 cm-1 which are responsible for TiO2, ZnO and SiO2 matrix in the nanocomposite. The peak at 1108 cm-1show Si-O-Si bending vibrations [23] and the peak around at 862 cm−1 can be devoted to symmetric stretching vibration mode of Zn-O-Ti groups [25, 30, 31]. Stretching vibrations of Zn-O-Si was found to be absent as no band appeared at 950 cm-1 [32]. The peaks observed at 1621 cm-1 and at above 3000 cm-1 indicates the bending and stretching vibrations of –OH groups [23].
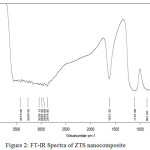 |
Figure 2: FT-IR Spectra of ZTS nanocomposite Click here to View figure |
Fig.3 shows the XRD pattern of ZTS nanocomposite which confirms the phase formation and crystalline nature of the samples. The size of the nanoparticle (D) has been calculated by the most intense XRD line using Scherer’s formula.
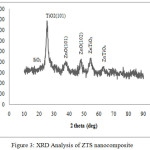 |
Figure 3: XRD Analysis of ZTS nanocomposite |
D = k λ / β Cos θ ——- (2)
Where λ is the wavelength of X-ray, β is the full width half maxima, θ is Bragg’s angle, k is the shape factor which has the value 0.9. The most intense peak (2θ) at 25.30 assigned for anatase TiO2 (d101) was observed in the ZTS nanocomposite [23]. The broad peaks observed (2θ) at about 20.6, 22.20 indicates that the overlapping of 100 plane (quartz) and the amorphous state of SiO2 respectively [33, 34].The diffraction peaks observed (2θ) at 37, 47.9o are indexed as 101 and 102 planes of ZnO hexagonal wurzite phase and 54.4, 63o for ZnTiO3 [1, 24,35].The crystallite size of ZTS nanocomposite, calculated from the most intense peak was about 46 nm.
Fig. 4 shows the SEM image of ZTS nanocomposite in which TiO2 nanoparticle are deposited on the surface of the SiO2 spheres and there were no isolated TiO2 particles formed separately [36]. ZnO nanoparticle was coordinate with the surface of the TiO2/SiO2 nanocomposite as view as white patches. The EDAX results showed the atomic ratio of Zn/Ti/Si as 52.54/19.66/8.05. The results show ZnO to be incorporated into TiO2/SiO2 to form ZTS nanocomposite (Fig. 5).
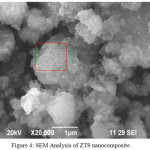 |
Figure 4: SEM Analysis of ZTS nanocomposite |
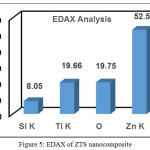 |
Figure 5: EDAX of ZTS nanocomposite |
Fig. 6 clearly refers the morphology of the composites to be spherical shape and some of the composites as agglomerates with the mean crystallite size of 46-50 nm which is approximately in conformity with XRD.
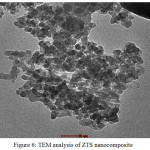 |
Figure 6: TEM analysis of ZTS nanocomposite |
Photocatalytic Activity
The photocatalytic activity of ZTS nanocomposite was measured by photo decomposition of methylene blue by using sunlight as the light source by taking into consideration of various parameters such as contact time, catalyst dosage and pH.
Effect of Contact time and Initial Concentration of the Dye
The removal of methylene blue was evaluated for various concentrations of dye ranging from 20 to 100 ppm (as per industry usage) at different time periods were shown in Fig.7 (a). It depicts that an increase in dye removal with increase in time and reached the optimal at 180 min. As the dye concentration was increased from 20 to 100 ppm, the removal of dye decrease from 100% to 90% at equilibrium. It is clear that the removal of dye depends on the time and initial concentration of the dye.
Effect of Catalyst Loading
The dosage of the nanocomposite decides the capacity of the photocatalyst for the concentration of the dye solution. The results are shown in Fig 7(b) which shows that the percentage removal of the dye increased rapidly with increase in catalyst dose (0.1 to 0.5 g/l) and after optimum dose, the removal percentage remained constant. The availability of the active sites on the photocatalyst surface, increasing the number of OH radicals with the increase in dosage, resulting the decolourisation of dye solution [37].
Effect of pH
The pH of the reaction has a significant effect on the surface properties of the catalyst, which include the surface charge of the particles. The effect of pH on the photocatalytic degradation of methylene blue showed higher the pH, higher is the decomposition of the dye, Fig 7. (c). at pH 2, the maximum decomposition was11% and with increase in the pH 12, the degradation percentage reached 90%, at lesser time than equilibrium which may be due to the surface charges. The electrostatic attraction of the negatively charged sites and the dye cation favoured the decomposition of the dye by the pH increases. [38].
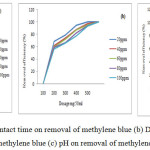 |
Figure 7: Effect of (a) contact time on removal of methylene blue (b) Dosage of catalyst on removal methylene blue (c) pH on removal of methylene blue |
Fig. 8 shows the FT-IR spectrum of ZTS nanocomposite after decomposition of methylene blue dye. The appearance of characteristic bands of ZTS (1100, 860 cm-1) and there is no band appeared at around 782 cm-1which is the characteristic band for C-S functionality [39], shows that the cleavage of the C–S+=C functional group in methylene blue, by the OH. radicals generated by the Oxidation of water by holes formed by ZTS .Columbic interaction with the surface of ZTS and the cleavage of the bonds occur. The conversion of C–S+=C to C–S (=O)–C induces the opening of the central aromatic ring through the heteroatoms, S and N [40].
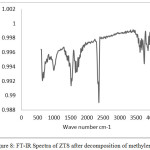 |
Figure 8: FT-IR Spectra of ZTS after decomposition of methylene blue |
Structure and Morphology of the Nanocomposite Coated Fabrics
Fig.9a and 9b shows the cotton fabrics before and after sonochemical treatment. Fig.10b shows a uniform distribution of the particles along the fibre which shows that ultrasound irradiation can be used as an effective method for coating textiles.
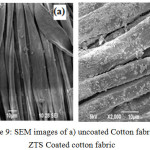 |
Figure 9: SEM images of a) uncoated Cotton fabric b) ZTS Coated cotton fabric |
The UV-protection factor rating of the ZTS coated cotton fabric was in the range of >50 and the transmission percentage was less than 2.5 which are related to the standard UV-protection factors rating (Table 1).
Table 1: Standard UPF Values
|
UPF Range |
Protection Category |
UV-R Transmission (%) |
|
15-24 |
Good |
6.7-4.2 |
|
25-39 |
Very good |
4.1-2.6 |
|
40-50, > 50 |
Excellent |
Less than 2.5 |
The UPF values were obtained against minimum transmission (i.e. Maximum UPF) of UV radiation in the range of 387-388nm for five scans, thus conforming the ability of ZTS to work effectively in UV-A range (320-400nm), recognised as a major cause of pigmentation and premature ageing [41].
Fig.10 reports the antibacterial activity of the ZTS nanocomposite coated cotton fabrics tested against Staphylococcus aureus and Escherichia coli bacteria strains. Strong bactericidal effect was observed for the nanocomposite coated clothes for both bacteria strains (19 mm zone of inhibition observed for Staphylococcus aureus and 18 mm for Escherichia coli).
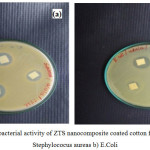 |
Figure 10: Antibacterial activity of ZTS nano composite coated cotton fabric against a) Staphylococus areas b) E.Coli. Click here to View figure |
Conclusion
The ZnO based TiO2/SiO2 nanocomposite shows efficient photodegradation on methylene blue dye at higher concentration under sunlight. The sonochemical coating method of nanocomposite on fabrics provide a uniform deposition. Strong antibacterial activities and efficient UPF values were observed for the coated cotton fabrics. The nanocomposite coated fabrics can comprise probable applications in wound dressing, as bandages and designing of UV protecting fabrics.
Acknowledgement
The authors are grateful to the Bharathiar University, Coimbatore and Karunya University, Coimbatore for instrumentation facility.
References
- Stoyanova, H.; Hitkova, A.; Bachvarova-Nedelcleva, R.; Iordanova, N.; Ivanova, M.; Sredkova. Chem. Technol Metallurgy. 2013, 48, 154-161
- Diamandeseu, L.F,; Vasiliu, D.; Tarabasanu-minaila, M.; Feder, A.M.; Vlaicu, M.; Trodorescu, D.; Macovei, I.; Enculescu, V.; Paravulescu, E.;Vasile. Mater. Chem. Phy. 2008, 112, 146-153
- Tong, T.; J. Zhang, B.; Tian, F.; Chen, D.; He. J. Hazard.Mater. 2008, 155, 572-579.
CrossRef - Ali, M.; Mohammad Ali, B.; Naser, M. Ind.J. Chem. 2010, 49, 1593-1600
- Elias, S.; Panagiotis, L.; Chritophoros, K. J. Phys. Chem. 2001, 105, 3486-3492
CrossRef - Kim, S.W.; Kang, M.; Choung, S.J. J. Ind. Eng. Chem. 2005, 11, 416-424
- Nilchi, A.; Janitbar-Darzi, S.; Rasouli-Garmarodi, S. Mater. Sci. Appl. 2011, 2, 476-480
- Liao, D.L.; Badour, C.A.; Liao, B.Q. J. Photochem. Photobiol.A:Chem. 2008, 194, 11-19
CrossRef - Wang, J.; Jiang, Z.; Zhang, L.; Kang, P.; Xie, Y.; Lv,Y.; Xu, R.; Zhang, X.Ultrason. Sonochem. 2009, 16, 225-231
CrossRef - Xu, X.; Tian, J.; Wang, X.; Dai, J.; Liu, X . Cer. Intl. 2011, 37, 2201-2206
CrossRef - Janitabar-Darzi, S .; Mahjoub, A.R. J. Alloys Comp. 2009, 486,805-808
CrossRef - Wahab, A.R.; Mishra, A.; Yun, S.I.; Kim,Y.S. ; Shin, H.S. Appl. Microbiol. Biotechnol., 2010, 87,1917-1925
CrossRef - Awang, N. J.; Aziz.; Madzlan, M.; Yusoff, A. R. J. Solid St. Sci. and Technol. Letters, 2008, 16 , 45-54
- Biswa Mohan Sahoo.; Ravikumar, B.V.V.; Panda, I. ; Dinda, S.C. J. Nanoparticles, 2013, 2013,1-7
- Singh, A.K.; Nakate, U.T. J. Nanoparticles, 2013, 6, 66-70
CrossRef - Hoon Joo Lee. Text Res J, 2005, 75, 551-556
CrossRef - Gedanken, A. Ultrason. Sonochem. 2004, 11, 47–55
CrossRef - Kotlyar, A.; Perkas, N.; Amiryan, G.; Meyer, M.; Zimmermann, W.; Gedanken, A. J. Appl. Polym. Sci. 2007, 104, 2868–2876
CrossRef - Pol, V. G.; Srivastava, D. N.; Palchik, O.; Palchik, V.; Slifkin, M. A.; Weiss, A. M.; Gedanken, A. Langmuir. 2002, 18, 3352–3357
CrossRef - Pol, V. G.; Wildermuth, G.; Felsche, J.; Gedanken, A.; Calderon-Moreno, J. J. Nanosci. Nanotechnol .2005, 5, 975–979
CrossRef - IlanaPerelshtein.; Applerot, G.; Perkas, N.A.; Gedanken , App.Mat.& Interfaces, 2010, 2, 1999-2004
- Sini Kuriakose.; Neha Bhardwaj.; Jaspal Singh.; Biswarup Satpati.; Satyabrata Mohapatra.; Beilstein, J. Nanotechnol., 2013, 4, 763–770
- Balachandran, K.; Venckatesh, R.; Rajeshwari Sivaraj. Int.J. Eng.Sci. Tech, 2010, 2, 3695-3700
- Chandraboss, V.L.; Karthikeyan, B.; Kamalakkannan, J.; Prabha, S.; Senthilvelan, S. Hin. Pub. Cor. J. Nanopar., 2013, 2013,17-24
- Tian, J.; Chen, L.; Yin, Y.; Wang, X.; Dai, J.; Zhu, Z.; Liu, X; Wu, P. Surface and Coatings Technology, 2009, 204, 205–214
CrossRef - Kulandhaivel, M.; Palaniswamy, M. International Journal of Pharmaceutical and Biological Archives, 2012, 3, 604-609
- Agbabiaka, T.O.; Samuel, T.; Sule ,I. O.; Ethnobotanical Leaflets, 2010, 14, 876-88
- Abdolreza Nilchi.; Simin Janitabar-Darzi.; Somayeh Rasouli-Garmarodi. Mate.Sci.Appl, 2011, 2, 476-480
- Zhang, D.H.; Xue, Z. Y.; Wang, Q. P. J. Phys.D. 2002, 35, 2837–2840
CrossRef - Karthik, K.; Pandian, S. K.; Jaya, N.V. Appl. Sur. Sci.2010, 256, 6829–6833
CrossRef - Wang, J.; Li, J. ;Xie, Y. ; Li, C.; Han, G.; Zhang, L.; Xu, R.; Zhang , X. Journal of Environmental Management, 2010, 91, 677–684
CrossRef - Djouadi, D.; Chelouche, A.; Aksas, A.; Sebais, M. Phy. Procedia, 2009, 2, 701-705
CrossRef - Ruchi Nandanwar.; Purnima Singh.; Fozia Haque, Z. Ame. Che. Sci. Journal, 2015,5,1-10
CrossRef
- Zhong li.; tiejun shi.; liying guo, J. Serb. Chem. Soc., 2010, 75, 385–394
- Thambidurai, M.; Jun Young Kim.; JiyunSong .; YoungjunKo.; Hyung-jun Song.; Chan-mo Kang.; Muthukumarasamy, N.; Dhayalan Velauthapillai.; Changhee Lee. Elec. Supp. Mat. (ESI) J. Mat. Chem.C, The Royal Society of Chemistry, 2013, 1, 8161-8166
- Mahesh, K.P.O.; Kuo, D.H.; Huang, B.R.; Ujihara, M.; Imae, T. Appl.Catal.A:Gen, 2014, 475, 235-241
CrossRef - Goncalves, M. S. T.; Oliveira-Campos, A. M. F. ; Pinto, E. M. M.S.; Plasencia P. M. S. ; Queiroz, M. J. R. P. Chemosphere, 1999, 39, 781-786
CrossRef - Majid Aliabadi.; Toktam Sagharigar. J. Appl. Environ. Biol. Sci., 2011,1, 620-626
- Liang, S.; Guo, X.; Feng, N.; Tian, Q. J. Hazard.Mater, 2010, 174, 756–762
CrossRef - Houas, H.; Lachheb, M.; Ksibi, E.; Elaloui, C.; Guillard, .; Herrmann, J.M. Appl.Catal. B, 2001, 31, 145–157
CrossRef - Chakraborty, J.N.; Vivek Sharma. Preeti Gautam, JTATM, 2014, 9, 1-17.

This work is licensed under a Creative Commons Attribution 4.0 International License.


