Catalytic Conversion of CO2/H2 Into Alcohol using Modified Lampung – Zeolite as Catalyst
Department of Chemistry, University of Lampung, Indonesia.
Corresponding Author E-mail: rudy.tahan@fmipa.unila.ac.id
DOI : http://dx.doi.org/10.13005/ojc/340139
This work was carried out to study the potency of modified lampung-zeolite as catalyst for conversion of CO2/H2 into alcohol compounds. The zeolite was activated using 0.1N nitric acid, by soaking the zeolite in the acid for 2 hours and then impregnated by Fe2O3 with varied content of 1 – 7% (g/g). To examine its activity, the catalyst was used in CO2/H2 conversion experiment at different temperatures (200 to 400oC). The experimental results indicated the zeolite impregnated by iron ions exhibits catalytic activity, and the highest alcohol formation (26000 ppm) was achieved by 5%Fe2O3 doped zeolite at 200oC. X-ray diffraction of washed-zeolite revealed that its crystalline phase is a clinoptilolite type of zeolite with monoclinic structure. Infra-red spectra analysis proved that 5% Fe2O3 doped zeolite has BrØnsted-Lowry and Lewis acid sites presenting at wavenumber of 1466 and 1648 cm-1 respectively. Furthermore, SEM analysis implied that Lampung zeolite has a channel pattern and relatively good porous distribution.
KEYWORDS:Zeolite; CO2; Hydrogenation; Acid Sites; Alcohols
Download this article as:| Copy the following to cite this article: Situmeang R. Catalytic Conversion of CO2/H2 Into Alcohol using Modified Lampung – Zeolite as Catalyst. Orient J Chem 2018;34(1). |
| Copy the following to cite this URL: Situmeang R. Catalytic Conversion of CO2/H2 Into Alcohol using Modified Lampung – Zeolite as Catalyst. Orient J Chem 2018;34(1). Available from: http://www.orientjchem.org/?p=42447 |
Introduction
In respond to fossil fuels depletion and concern on environmental impacts, primarily due to CO2 produced from their utilization, conversion of CO2 into various chemicals useful as alternative and renewable fuel has been intensively investigated in the last few decades. For this purposes, different catalysts has been tested and in general, the results obtained indicate that catalysts play very important roles in governing the yield and type of product resulted. As an example, Cu20Mo2C/M41 catalyst abled to produce 5.5% yield of methanol at a CO2 conversion of 8.8%1. Other groups of research using different kinds of catalysts such as Fe-Zn-Zr/HY composite catalyst abled to obtain isoalkanes at 340oC as much as 20% CO2 conversion, 45% selectivity to i-C4, and 9% yield2; CuO-ZnO-TiO2 catalyst operated at 493 K gave 35% conversion of CO2 with the selectivity of 52.3% to ethanol3; K/Cu-Zn-Fe catalyst abled to produced ethanol at 300oC as much as 90% CO2 conversion and 85% selectivity to ethanol4; Co-Fe bimetallic catalyst operated at 200 – 270oC obtained 27% of CO2 conversion and 71% of CH4 selectivity 5.
Another type of materials that exhibit catalytic activity is natural zeolite, that can be found in many different places around the world. In Indonesia, one of the regions that has natural zeolite deposit is Lampung Province. Due to their availability and chemical as well as physical characteristics, natural zeolites have been used as catalyst for different reactions, for examples, pure phase β-zeolite operated at 120oC and atmospheric pressure abled to obtain 90% yielf of ethyl acetate from 80% acetic acid conversion6; Pacitan-Natural zeolite as catalyst support for transesterification of palm oil abled to produce 96% yield of both methyl palmitate and stearate at 60oC7; and H-Mordenite type of zeolite operated at 423K abled to produce 12% glucose from 0.05g Cellulose in 5 mL water 8.
To improve their catalytic performance, natural zeolites are commonly activated or modified by addition of other active sites. Several studies revealed that addition of active sites significantly increased catalytic activity of natural zeolites. For examples, clinoptilolite type of natural zeolite impregnated by KOH and operated at 350 – 440oC and abled to gain 90% yield of liquid fuel from natural triacylglicerol9; modified natural zeolite from Kidul mountain of java island abled to convert ethanol as much as 15% and produced 3% yield of diethyl ether at 140oC10; and modified natural clinoptilolite from Bayah – Indonesia operated at 60 – 80oC and abled to obtain almost 100% glycerol carbonate from 25% conversion of glycerol11. In hydrogenation of CO2 reaction, modified natural zeolite with 5% Nickel abled to produce methane with the 96% selectivity and 10% conversion of CO2 at 300oC reaction temperature 12.
In recognizing the important role of additional active sites on performance of natural zeolites, in this study, Lampung zeolite was modified by addition of different amounts of iron oxides as active sites. The modified zeolites were subsequently calcined at 600oC and then tested as catalysts for conversion of CO2 into alcohol at a temperature range of 200 – 400oC.
Material and Methods
The chemical used in this study, natural zeolite, nitric acid, Fe-nitrates, and NH3 are reagents grade obtained from Merck. The main equipments used in this study are Fourier Transform Infrared (FTIR) spectrophotometer (Shimadzu Prestige-21), Scanning Electron Microscope (SEM, Philips-XL), Philips X-ray diffractometer (XRD) model PW 1710 with Cu-Kα radiation, and Gas Chromatography (Agilent 7890B) with Flame Ionization detector.
Modification of Natural Zeolite
Modification of natural zeolite was carried out in two steps. The first treatment was carried out by soaking the sample in 0.1N nitric acid solution for 2 hours with continuous shaking. The mixture was filtered and the solid was repeatedly rinsed with distilled water to remove the excess of acid. At the second step, the solid was calcined at 600oC for 2 hours (increased by 2oC min-1), and then impregnated with 1 – 7% Fe2O3 by soaking zeolite in Fe-nitrates solution and heated at 80oC until water solvent evaporated. Finally, the samples were recalcined at 600oC for 2 hours.
Characterizations
XRD Analysis
The XRD powder patterns were obtained in a Philips diffractometer Model PW 1710, using Cu Ka radiation and operating at 40 kV and 40 mA. The scanning range of 2q angle was set from 5 to 70o, with a step size of 0.02o/ s. The crystalline phases identification of the samples was analysed and calculated by using Search and Match Program (Version 2.1) and Rietveld Method, respectively 13.
FTIR Analysis
Sample was treated in vaccumized dessicator after heating at 120oC and then, the vapour of liquid pyridine was allowed to contact the sample located inside of vaccumized dessicator for 24 hours. After taking out from dessicator and allowing on air for 2 hours, a small amount of sample was finally mixed to KBr powder (sample/KBr ratio less than 1%) to form a pellet at ambient temperature and was ready to be analysed by putting it on quartz cell of FTIR (Shimadzu) in the wavenumber range of 400 – 4000 cm−1. This procedure had already been used in the previous work 14, 15.
SEM Analysis
A small quantity of the sample was mounted on a stub with an adhesive coated by 40 – 60 nm of gold or other conducting materials. Then, the crystal morphology and size of the samples were observed 16, 17.
Results and Discussion
Structural Analysis
Materials that have been prepared were characterized using some instruments such as X – ray diffraction, (FTIR) spectroscopy, and TEM as explained as follow:
X-Ray Diffraction Analysis
Qualitative XRD analysis was conducted by comparing the diffraction lines of zeolite sample with those in standard from the ICCD files and showed that the major phase obtained for the sample is clinoptilolite phase. The minor phases was also obtained such as Quartz and cristobalite as shown in Figure 1 below. This washed zeolite, however, cliptonilolite is accordance with JCPD File # 39-138318, which has a monoclinic structure.
Furthermore, to obtain quantitative information from the zeolite, Rietveld analysis is used to obtain unit cell parameters and distinguish the phase composition clearly. As shown in Figure 2, one of the XRD Rietveld analysis has been plotted for the zeolite. This result was satisfied by examining the goodness of fitting value (χ2 ≤ 4).
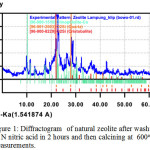 |
Figure 1: Diffractogram of natural zeolite after washing with 0.1N nitric acid in 2 hours and then calcining at 600oC measurements. Click here to View figure |
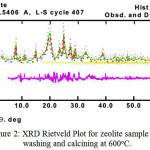 |
Figure 2: XRD Rietveld Plot for zeolite sample after washing and calcining at 600oC. Click here to View figure |
The Observed data are shown by the (+) red sign, and the calculated data by a solid line (Green). The vertical lines (Yellow, Green and purple, indicates hkl indices of three phases), The purple line below the vertical lines is the difference profile.
In addition, this fitting plot indicates the accomplishment of the Rietveld refinement, in which the different plot between calculated and observed patterns show relatively minor fluctuation. This result also proved that the output of the refinement can be used to provide further information such as phase composition, unit cell parameters, and atomic position in space.
Table 1: Rietveld Refinement results of Lampung Zeolite (Rwp = 21.51; Rp = 16.97 ; χ2 = 1.317)
|
No. |
Phase Identification |
Unit Cell Parameters |
Crystal System |
Weight Percentage (% wt) |
||||||
|
a ( Å ) |
b ( Å ) |
c ( Å ) |
V ( Å3 ) |
α |
β |
γ |
||||
| 1. | Clinoptilolite |
19.586 |
19.177 |
7.888 |
2661.6 |
90o |
116.7o |
90o |
Monoclinic |
65.9 |
| 2. | Quartz |
4.985 |
4.985 |
5.287 |
113.7 |
90o |
90o |
120o |
Hexagonal |
31.6 |
| 3. | Cristobalite |
17.632 |
17.941 |
7.400 |
2097.0 |
90o |
90o |
90o |
Tetragonal |
2.5 |
Table 1 shows phase composition, unit cell parameters, crystal system, and weight percentage from Rietveld refinement with XRD data for zeolite sample washed and calcined at 600oC for 2 hours. Evidently, the weight percentage for clinoptilolite, quartz, and crystoballite phases is 65.9, 31.6, 2.5, respectively. The relatively high quantity of quartz is probably affected by both acid washing and calcining at 600oC since natural zeolite dehydrated when it had been heated above 500oC13,19. Then, structrural phases, the samples, with different iron oxides content were characterized and the X-ray diffraction patterns of the samples were compiled in Fig. 3. As can be shown in Fig. 3, the diffractogram are generally similar, with only some differences in the intensity of certain position of the representative peaks of zeolite (clinoptilolite form). For instanse, at 2q of 32.93o as a major peak of Fe2O3 (PDF-330664) is more pronounced as quantity of Fe2O3 – dopant increased, as particular for 7% Fe2O3 dopant. In a ragion of 20o through 33o, as shown in Fig.3, represent clinoptilolite type and then the representative peaks (i.e intensity and 2q) changed slightly as dopant content augmounted. The effect of dopant addition into zeolite parameter cells is investigated by Rietveld calculation.
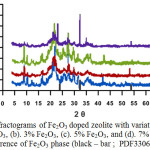 |
Figure 3: Diffractograms of Fe2O3 doped zeolite with variation of dopant: (a). 1% Fe2O3, (b). 3% Fe2O3, (c). 5% Fe2O3, and (d). 7% Fe2O3 and a reference of Fe2O3 phase (black – bar ; PDF330664). Click here to View figure |
To evaluate the effect of the iron oxides quantities on the stability of Lampung – zeolite.
Quantitative analysis of modified zeolite using Rietveld method is presented in Table 2 below, and analysis of Rietveld calculation has shown a very good result since its Goodness of Fitting value (c2 or GOF) had been obtained satisfying the required values of £ 4. The effect of Fe2O3 addition into zeolite, proved that structure of zeolite is not sufficiently influenced by the formation of hematite – Fe2O3 crystalline phase. In the other word, the formation of hematite-Fe2O3 is not happened exactly inside the channels of zeolite since the crystalline structure of a washed natural zeolite has still existed. This evident is also found by Cheng et al., while loading of Fe and Ni into HZSM – 5 catalyst 20.
Table 2: Rietveld refinement results of Zeolite doped
|
No. |
Zeolite added with |
Unit cell Parameters |
Crystalline Phase(s) dominant |
|||
|
a(Å) |
b(Å) |
c(Å) |
c2 (GOF)*
|
|||
| 1 |
0% Fe2O3 |
19.586 | 19.197 | 7.888 | 1.317 |
clinoptilolite |
| 2 |
1% Fe2O3 |
19.588 | 19.196 | 7.898 | 1.429 |
clinoptilolite |
| 3 |
3% Fe2O3 |
19.587 | 19.198 | 7.888 | 1.547 |
clinoptilolite |
| 4 |
5% Fe2O3 |
19.589 | 19.197 | 7.889 | 1.671 |
clinoptilolite |
| 5 |
7% Fe2O3 |
19.587 | 19.199 | 7.886 | 1.537 |
Clinoptilolite & Hematite |
Microstructure Analysis
The surface characteristic is very important to the catalytic application involving the surface interaction (adorption – desorption) process. For this reason, the samples investigated in this study were characterized using SEM technique17. The SEM micrographs of some samples are shown in Fig. 4. As can be seen in Fig. 4, The SEM micrographs of washed-zeolite and some Fe2O3 doped zeolite samples display clearly a porous structure. The topography of these samples told that its texture is relatively homogeneous and amorphous. Also, its morphology suggesting there is the effect of Fe2O3 dopant on its shape and channel. However, by careful inspection of certain region, the varied diameter size of channel and some ductiles spots are observed. Furthermore, some ductiles has a diameter of 0.1 – 3 mm (red-arrow) and other have diameter even higher than 3 mm. Also there are some brittle channel parts (green-arrow) . This brittle channel part is happened probably because of washing, dopant-adding and calcining process. In general the Fe2O3 addition into zeolite did not damage the channel structure of zeolite as can be seen.
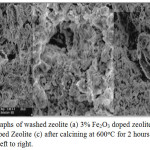 |
Figure 4: Micrographs of washed zeolite (a) 3% Fe2O3 doped zeolite (b) and 5% Fe2O3 doped Zeolite (c) after calcining at 600oC for 2 hours (Mag. = 2.00k x), from left to right. Click here to View figure |
Acidity Analysis
To identify the functional group present in the sample which is primarily to know the existence of Lewis and Bronsted-Lowry acid sites, the Fourier transform infra-red spectroscopy is applied in this study. These characteristics are very important to determine the performance of catalyst. The FTIR spectrum of washed – zeolite as an example is shown in Fig. 5.
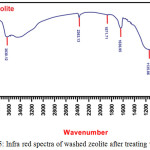 |
Figure 5: Infra red spectra of washed zeolite after treating with Ammonia. Click here to View figure |
As can be seen in Fig. 5 above, the absorption bands representing both acid sites were proved by the existing of Zeolite – NH3 (as Lewis acid site) and/or zeolite – NH4+(as BrØnsted – Lowry acid site) vibrations. In general, wavenumber region of 3100 – 3700 cm-1 refers to stretching vibrations and wavenumber below 2500 cm-1 relates to bending and rocking vibrations. In Fig. 5, Lewis acid sites appeared to wavenumber of 1636.95 cm-1 and little peaks in region of 1450 – 1550 cm-1. However, BrØnsted – Lowry acid sites appeared at wavenumber of 1400 – 1440 cm-1. Furthermore region below 1200 cm-1 belongs to fingerprint pattern of zeolite. Strong stretching vibrations of the bond Si – O – Si, Al – O – Si, and Al – O – Si appeared at the wavenumber range of 1000 – 1136 cm-1 and 789 cm-1. These peaks indicate that tetrahedral linkage arrangement in tetrahedron (Al,Si)O4 still remain after washing and calcining at 600oC. The peaks that were appeared at 476 and 608 cm-1 show the bending vibrations of tetrahedral linkage.
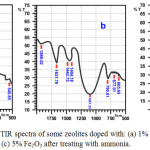 |
Figure 6: FTIR spectra of some zeolites doped with: (a) 1% Fe2O3, (b) 3% Fe2O3, and (c) 5% Fe2O3 after treating with ammonia. Click here to View figure |
In the Fe2O3 doped zeolites samples investigated, as can be seen in Fig. 6, the spectra are pratically similar in terms of the absorption bands for acid sites characteristics, with only some minor differences in intensities and wavenumbers, depending on the quantity of Fe2O3 doped into zeolite. The existence of Lewis acid sites is indicated by the vibration bands resulted from stretching vibration, located at 1628 cm-1 for 1% Fe2O3 doped zeolite; 1650 and 1632 cm-1 for 3% Fe2O3 doped zeolite, and then 1648 and 1628 cm-1 for 5% Fe2O3 doped zeolite. While the existence of BrØnsted-Lowry acid sites is shown by the vibration bands resulted from stretching vibration, located at 1466 and 1400 cm-1 for 1% Fe2O3 doped zeolite; 1443 and 1404 cm-1 for 3% Fe2O3 doped zeolite, and then 1466 and 1408 cm-1 for 5% Fe2O3 doped zeolite. By comparing the intensities of the absorption bands corresponding to Lewis and BrØnsted-Lowry acid sites, it can be concluded that acid property of the Fe2O3 doped zeolite samples is dominated by the Lewis acid sites, and there is a tendency that the Lewis acid strength relatively increases with increased Fe content in the samples. The increase of acid properties is also found while Fe and Co was loaded in SiO221. In finger print region of spectra, the absorption band representing stretching and bending vibrations of Fe-O were detected at 613, 677, and 663 cm-1 for 1%, 3%, and 5% Fe2O3 doped, respectively22, 23.
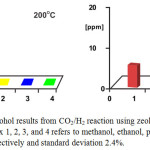 |
Figure 7: Alcohol results from CO2/H2 reaction using zeolite washed as catalyst. Index 1, 2, 3, and 4 refers to methanol, ethanol, propanol and butanol, respectively and standard deviation 2.4%. Click here to View figure |
Catalytic Activity
Hydrogenation of carbon dioxide was run in the reactor (U-type) with the variation of temperature, 200-400oC and the gas flow of 3 L/hour consisting CO2/H2 ratio of 0.25. The results are displayed in Fig. 7 and Fig. 8 below.
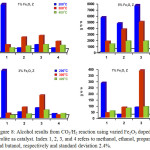 |
Figure 8: Alcohol results from CO2/H2 reaction using varied Fe2O3 doped zeolite as catalyst. Index 1, 2, 3, and 4 refers to methanol, ethanol, propanol and butanol, respectively and standard deviation 2.4%. Click here to View figure |
As can be seen in Fig. 7, zeolite washed is active to convert CO2 into alcohol eventhough its activity was low, 1000 ppm of methanol at 200oC was obtained. It can be explained that CO2 and H2 molecules was attached strong enough to form C1 ionic molecule on the surfaces of catalyst before forming CH3OH molecules. In higher temperature, 300 and 400oC, its activity became very low. It can be implied that as temperature increase the contact time between CO2 and H2 molecules into zeolite surfaces shorter so that there are no sufficient interaction to produce more methanol. Other alcohols such as ethanol, propanol, and butanol were also formed but its amount was too small compared to methanol formation at 200oC. Besides insufficient interaction, it can also be explained that the most methanol formed was oxidized in advance as temperature increased.
 |
Scheme 1: Illustration of alcohols formation in CO2/H2 reaction on Lampung Zeolite Catalyst Click here to View figure |
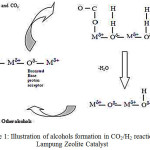
The effect of Fe2O3 dopant in zeolite activity to convert CO2 into alcohol is shown in Fig. 8. In general, the activity of zeolite is abruptly increased by adding Fe2O3. Eventhough, Fe2O3 itself that has been prepared with the same method did not show a good activity. In addition, by looking at certain temperature, for instance 200oC, the alcohol result is quite well distributed using 5% Fe2O3 doped Zeolite. The well distribution of alcohol results (i.e. CH3OH, C2H5OH, C3H7OH, and C4H9OH) using 5% Fe2O3 doped zeolite can be explained that both CO2 and H2 molecules adsorbed on the surface of this catalyst have enough time to form C+, C2+ , C3+ and C4+ species, so higher alcohol can be obtained as illustrated on Scheme 1 below 24, 25. Another reason why a longer chain of alcohol was not formed greater than that of methanol is the Lewis acid sites of zeolite located at relatively high wavenumber, about 1640 cm-1, plays an important role in binding CO2 and H2 molecules on the surface. Therefore, further oxidation is happened.
Conclusion
It can be concluded that modified zeolite of Lampung is active as a catalyst for converting CO2 and H2 into alcohol in the temperature range of 200 – 400oC. By adding and varying Fe2O3 content into zeolite, its activity is ameliorated and the higher alcohol result is formed. Regarding on its acid behaviour, it can be implied that the activity of modified Lampung-zeolite becomes better as acid characteristic more pronounced.
Acknowledgement
The author wish to thank and appreciate the Directorate General Higher Education Republic of Indonesia for research funding provided through Competitive Research Grant program with a contract no. 267/H26/PL/2016.
References
- Liu, X.; Song, Y.; Geng, W.; Li, H.; Xiao, L.; Wu, W. Catal. 2016, 6, 75 – 87.
CrossRef - Ni, X.; Tan, Y.; Han, Y.; Tsubaki, N. Catal. Commun. 2007, 8, 1711 – 1714.
CrossRef - Xiao, J.; Mao, D.; Guo, X.; Yu, J. Energy Technol. 2015, 3, 32 – 39.
CrossRef - Li, S.; Guo, H.; Luo, C.; Zhang, H.; Xiong, L.; Chen, X.; Ma, L. Catal. Lett. 2013, 143, 345 – 355.
CrossRef - Muthu, K.; Gnanamani, G.J.; Hamdeh ,H.H.; Shafer, W.D.; Liu, F.; Hopps, S.D.; Thomas, G.A.; Davis, B.H. ACS Catal. 2016, 6, 913 – 927.
CrossRef - Yue, Y.; Liu, H.; Zhou, Y.; Bai, Z.; Bao, X. Appl. Clay Scie. 2016, 126, 1 – 6.
CrossRef - Kusuma, R.I.; Hadinoto, J.P.; Ayucitra, A.; Soetaredjo, F.E.; Ismadji, S. Appl. Clay Scie. 2013,74, 121 – 126.
CrossRef - de Vyvwe, S.V.; Peng, L.; Geboers, J.; Schepers, H.; de Clippel, F.; Gommes, C.J.; Goderis, B.; Jacobs, P.A.; Sels B.F. Green Chem. 2010,12, 1560.
CrossRef - Cvengroš , J.; Buzetzki, E.; Švaňová, K. 44th Intern. Petrol. Conf. 2012, Bratislava, Slovak Republic, September 21 – 22nd, 1 – 8.
- Widayat, W.; Roesyadi, A.; Rachimoellah, M. Internat. J. Sci. Eng. 2013, 4, 6 – 10.
- Mahdi, H.I.; Irawan, E.; Nuryoto, N.; Jayanudin, J.; Sulistyo, H.; Sediawan, W.B.; Muraza, O. Waste and Biomass Valor. 2016, 7, 1349 – 1356.
CrossRef - Bacariza, M.C.; Garcia, I.; Westermann, A.; Ribeiro, M.F.; Lopes, J.M.; Henriques, C. Topics in Catal. 2016, 59, 314 – 325.
CrossRef - Hutching, G.J.; Comninos, H.; Copperthwaite, R.G.; van Rensburg, R.; Hugo, M. J. Appl.Crystallogr. 1969, 2, 65 – 71.
CrossRef - Parry E.P., J. Catal. 1963, 2, 371 – 379.
CrossRef - Situmeang, R.; Manurung, P.; Sulistiyo, S.T.; Hadi, S.; Simanjuntak, W.; Sembiring, S. Asian J. Chem. 2015, 27, 1138 – 1142.
CrossRef - Drbohlavova, J.; Adam, V.; Kizek, R.; Hubalek, J.; Int. J. Mol. Sci. 2009, 10, 656 – 673.
CrossRef - Hanke L.D., Handbook of Analytical Methods for Materials. Materials Evaluation and Engineering Inc. Plymouth, USA .2001,35 – 38.
- Gottardi G., Galli E., Natural Zeolite: Pottasium Sodium Calcium Alumminum Silicate hydrate (Clinoptilolite), Springer – Velag, Tokyo. 1985, 341.
- Breger, I.A.; Chandler, J.C.; Zubovic, P. The Am. Miner. 1970, 55, 826 – 840.
- Cheng, S.; Wei, L.; Julson, J.; Muthukumarappan, K.; Kharel, P.R. Fuel Proc. Tehcn. 2017, 167, 117 – 126
CrossRef - Cheng, S.; Wei, L.; Julson, J.; Rabnawaz, M. Energ. Conv. Manag. 2017, 150, 331 – 342.
CrossRef - Zhiqiang, W.; Hongxia, Q.; Hua, Y.; Cairong, Z.; Xiaoyan, Y. J. Alloys. Compd. 2009, 479, 855 – 858.
CrossRef - Kim, J.S.; Ahn, J.R.; Lee, C.W.; Murakami, Y.; Shindo, D. J. Mater. Chem. 2001, 11, 3373 – 3376.
CrossRef - Kienneman, A.; Boujana, S.V.S.; Diagne, C.; Chaumette, P. Stud. Surf. Sci. Catal. 1993, 75B, 1479 .
CrossRef - Jung, K.T.; Bell, A.T. J. Catal. 2001, 204, 339 – 347.
CrossRef

This work is licensed under a Creative Commons Attribution-NonCommercial-ShareAlike 4.0 International License.

This work is licensed under a Creative Commons Attribution 4.0 International License.


