New Analytical HPLC Method Development and Validation for the Simultaneous Quantification of Paritaprevir Ombitasvir and Ritonavir in Spiked Human Plasma
Phani R. S. Ch1 , K. R. S. Prasad1 and Useni Reddy Mallu2
1Department of Chemistry, K.L. University, Vaddeswaram-522502, Andhra Pradesh, India.
2R.V.Labs, Guntur-522007, Andhra Pradesh, India.
Corresponding Author E-mail: phani.r.s.ch@gmail.com
DOI : http://dx.doi.org/10.13005/ojc/330528
A rapid HPLC bio-analytical method has been developed and validated for the simultaneous quantification of Ombitasvir (OMBTSR), Ritonavir (RTNVR), Paritaprevir (PTVR) in human plasma. OMBTSR and PTVR are used to control Hepatitis-C infection. RTNVR is used in the treatment of HIV/AIDS. The method was developed with Column (Intersil ODSC18, 250 mm × 4.6 mm×5µ) at230 nm wave length and at flow rate of 1.0mL/min. The mobile phase consisted of 20% Acetonitrile, 20%Methanol, 60%1mM NH4H2PO4Buffer(PH 6.5 v/v). The retention times of RTNVR, OMBTSR, PTVRare 5.7 min, 7.8min and 12.8 min respectively. The method was developed and validated in terms of linearity, interday precision, intraday precision, accuracy, LOQ, LOD and stability study. The proposed method is useful in pharmacokinetic studies using HPLC or LC-MS.
KEYWORDS:Ombitasvir; Ritonavir; Paritaprevir; HPLC Method; Bio Analytical Method
Download this article as:| Copy the following to cite this article: Ch P. R. S, Prasad K. R. S, Mallu U. R. New Analytical HPLC Method Development and Validation for the Simultaneous Quantification of Paritaprevir Ombitasvir and Ritonavir in Spiked Human Plasma. Orient J Chem 2017;33(5). |
| Copy the following to cite this URL: Ch P. R. S, Prasad K. R. S, Mallu U. R. New Analytical HPLC Method Development and Validation for the Simultaneous Quantification of Paritaprevir Ombitasvir and Ritonavir in Spiked Human Plasma. Orient J Chem 2017;33(5). Available from: http://www.orientjchem.org/?p=38613 |
Introduction
Ritonavir (RTNVR) is an antiretroviral drug used along with other medications to treat HIV/AIDS and hepatitis C.[1-3]. Ombitasvir (OMBTSR) is an antiviral drug for the treatment of hepatitis C virus. Mostly it is used in the combinations with in combination with Paritaprevir, Ritonavir and Dasabuvir[4]. Paritaprevir (PTVR) is best drug in the treatment of hepatitis C. The usual side effects of this combination are Diarrhea, Vomiting, loss of appetite and numbness of the hands and feet. The serious side effects are liver problems, pancreatitis, allergic reactions, and Arrhythmias.[5]From last few decades, Pharmacokinetics playing major important role in drug development. At the time of identification of drug’s biological properties,metabolic feature of the drug and understanding of pharmacokinetic the bioanalytical methods playing key role. The bio analytical method used to determine the drug and its metabolites in serum, plasma, urine. [6-12].
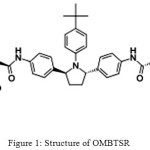 |
Figure 1: Structure of OMBTSRFig.2 Structure of RTNVR
|
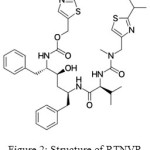 |
Figure 2: Structure of RTNVR |
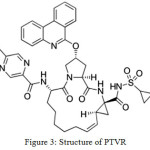 |
Figure 3: Structure of PTVR |
Literature survey revealed that NourahZoman et al[12]submitted a method for the estimation of RTNVR, OMBTSR, PTVR in pharmaceutical formulations. Other methods are reported for analysis of individual and combination of two drugs. From the literature survey there is no bio analytical method reported. Andrew J Ocque et al [13] developed a method to determination of Paritaprevir and Ritonavir in rat liver tissue samples. In this method accuracy range is 6.68 to 10.1%. Jyoti M. Salunke et al [14] developed a method to estimate and RTNVR and Lopinavir in combined dosage form with C18 column (250 x 4.6mm id,5µm) at 1.5 mL/min flow rate. Methanol, Acetonitrile and Potassium Dihydrogen Phosphate as a mobile phase. Rajasekhar et al [15] developed a method for LCMS method to determination of Lopinavir and RTNVR in Human Plasma by Protein Precipitation method. The method was developed with mobile phase consisting of CH3CN and 5mM CH3COONH4buffer. The linearity range of the method is 50.67–10,008.82 ng/mL for Lopinavir and 5.066–1,000.693 ng/mL for Ritonavir. K Vinod Kumaret al [16] reported a HPLC method developed for the simultaneous quantification of RTNVR and Lopinavir in tablet dosage form and in plasma. The concentration range of Ritonavir and Lopinavir are 5-50 µg/ml, 20-200 µg/ ml respectively. The method was carried out on RP C18 column and methanol: water (85:15v/v) as a mobile phase. M Jagadeeswaran et al[17]submitted a method developed a method for quantitative estimation of Lopinavir and RTNVR. The method was reported with reversed-phase C18 Column, mixture of Buffer: Acetonitrile (45:55 v/v) as mobile phase at pH 4.5.The recovery of the method was between 102.1% and 100.1% for Lopinavir and Ritonavir respectively. Suneetha.A et al [18] developed a method for estimation of Lopinavir and RTNVR in combined dosage. The method was developed with Potassium hydrogen phosphate buffer, CH3CN and CH3OH in the ratio of 50:35:15v/v at pH 6.0linear in the ranges are 400‐600µg/ml for Lopinavir and 100‐150 µg/ml for RTNVR.
Objective
The present study is concerned with the development and validation of RTNVR, OMBTSR and PTVR inspiked human plasma by HPLC.
Materials and Methods
Apparatus
The new method was developed and validated with Peak LC P7000HPLC (Isocratic) system rheodyne injector with 20 µL and UV/Vis detectorUV7000 and PEAK Chromatographic version 1.06. The Ombitasvir, Ritonavir Paritaprevir were scanned with UV-Visible spectrophotometer (Tech comp-UV 2301, make Japan) with Hitachi software. OMBTSR, RTNVR and PTVR were obtained from Manus Aktteva Biopharma LLP(India). HPLC grade solvents Water, Acetonitrile, Methanol and Tri Ethyl Amine (TEA) were procured from Merck, Mumbai. Method was developed at 230 nm with Intersil ODS C18 column (250 mm × 4.6 mm×5µ).
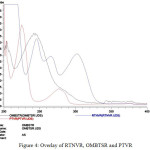 |
Figure 4: Overlay of RTNVR, OMBTSR and PTVR |
Chromatographic Conditions
The HPLC method conditions were optimized by using different columns, different mobile phases and different buffers. The finalized mobile phase is 20% Acetonitrile, 20%Methanol, 60%0.001 M NH4H2PO4 Buffer v/v. The mobile phase PH was adjusted to 6.5 with TEA for perfect separation. Analysis was performed with flow rate 1.0ml/min at ambient temperature.
Standard Stock Solution Preparation [19]
The plasma samples was extracted by liquid-liquid extraction process. The fixed dosages (10mg) are spiked in to 10ml plasma and stored in freezer for 24 Hours. For processing, the stored spiked samples were taken out from freezer and allowed to thaw at room temperature. An aliquot of 500μL was transferred to prelabeled 2.0mL polypropylene centrifuge tubes. Extraction solvent, 20mL of ethyl acetate, was then added to extract the drug. The samples were then kept on a vibramax unit and vortexed for 15 min. Samples were centrifuged at 5000 rpm for 5 min in a refrigerated centrifuge (4°C). Supernatant solution, 1 mL was then transferred into pre-labeled polypropylene tubes and was allowed to evaporate to dryness under N2 at 40°C. The dried residue dissolved in 200μL of mobile phase and transferred into shell vials containing vial inserts for analysis. Samples, 20μL by volume, were then injected into the column and analyzed by HPLC on the same day to avoid any degradation. The column temperature was maintained at ambient temperature.
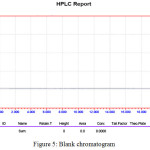 |
Figure 5: Blank chromatogram |
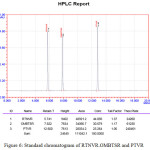 |
Figure 6: Standard chromatogram of RTNVR.OMBTSR and PTVR |
Validation
Linearity Test
The Linearity test was conducted in the range of 25% to 200%. For RTNVR and PTVR the concentrations ranges are 0.15 to 1.2µg/ml. For OMBTR the linearity range is 0.25 µg/ml to 2.0 µg/ml . The results are showed in below Table.1. The target concentration solutions are prepared by serial dilution from standard stock solution. The linearity graph was plotted with peak area against concentration. The intercept, slope and the correlation coefficient were determined.
Table 1: Linearity results of developed method.
|
S.No |
Percentage of Concentration |
Concentration of RTNVR (µg/ml ) |
Peak Area |
Concentration of OMBTSR (µg/ml ) |
Peak area |
Concentration of PTVR (µg/ml ) |
peak area |
|
1 |
25% |
0.15 |
26025 |
0.25 |
14083 |
0.15 |
10440 |
|
2 |
50% |
0.3 |
33830 |
0.5 |
20759 |
0.3 |
16734 |
|
3 |
100 % |
0.6 |
48921 |
1.0 |
34066 |
0.6 |
28054 |
|
4 |
150% |
0.9 |
67191 |
1.50 |
50463 |
0.9 |
42285 |
|
5 |
200% |
1.2 |
79973 |
2.0 |
62630 |
1.2 |
55252 |
|
6 |
r2 |
0.9996 |
0.9990 |
0.9993 |
|||
|
7 |
Slope |
51833.7 |
28204.73 |
42731.1 |
|||
|
8 |
Intercept |
18273.97 |
6785.232 |
3632.409 |
|||
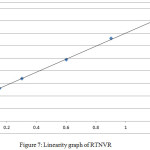 |
Figure 7: Linearity graph of RTNVR |
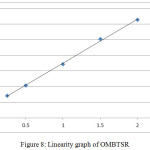 |
Figure 8: Linearity graph of OMBTSR |
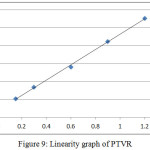 |
Figure 9: Linearity graph of PTVR |
Precision
Intraday precision and Interday precision tests were conducted at standard concentrations of RTNVR, OMBTSR and PTVRi.e0.6µg/ml, 1.0µg/ml and 0.6µg/ml respectively. The Precision was expressed as the percentage of RSD(Relative Standard Deviation). The calculated percentage RSD of intraday and interday precision test of each drug is below 2.0
Recovery
The recovery test was conducted at three different concertinos levels 50%, 100% and 150%. Recovery of RTNVR, OMBTSR and PTVR was evaluated by comparing of observed peak area with standard peak area. The average recovery of RTNVR is 99.81, OMBTSR is 101.42 and PTVR is 100.38. The results were showed in Table.2
Table 2: Recovery results of developed method
| Concentration level | RTNVR | True area | % of recovery | OMBTSR | True area | % of recovery | PTVR | True area | % of recovery |
| 50% | 33982 | 33830 | 100.44 | 21011 | 20759 | 101.21 | 16554 | 10734 | 98.32 |
| 100% | 48689 | 48921 | 99.52 | 34784 | 34066 | 102.1 | 28884 | 28054 | 102.95 |
| 150% | 66845 | 67191 | 99.48 | 50676 | 50463 | 100.42 | 42237 | 42285 | 99.88 |
| Average recovery | 99.81 | 101.42 | 100.38 |
Sensitivity
The sensitivity of method was calculated by signal to noise ratio. The plasma sample solution was diluted serially and injected at developed conditions. Similarly, blank plasma samples were also processed and injected. The results were showed in Table.3
Table 3: LOQ and LOD results of developed method
| S.No | Test | RTNVR | OMBTSR | PTVR |
| 1 | LOQ | 0.0375µg/ml | 0.0625 µg/ml | 0.375µg/ml |
| 2 | LOD | 0.009µg/ml | 0.0156µg/ml | 0.009µg/ml |
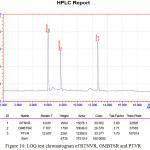 |
Figure 10: LOQ test chromatogram of RTNVR, OMBTSR and PTVR |
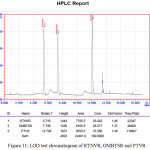 |
Figure 11: LOD test chromatogram of RTNVR, OMBTSR and PTVR Click here to View figure |
Stability
The stability experiments were aimed at testing all possible conditions that the samples might experience after collecting and prior the analysis. Short term BT (Bench-Top)stability test was evaluated after 24hours at room temperature. Auto sampler stability test was evaluated on QCs extracts maintained in the auto sampler at 10oC for 24 Hours, by comparing their concentrations with fresh extracts. Freeze and Thaw stability test evaluated after three cycles at -20° to room temperature, by comparison with freshly prepared. Stability of RTNVR, OMBTSR and PTVR solutions was observed at room and temperature and in refrigerated conditions for period of 48 h. Acceptable stability has been considered as percent difference in concentration lower than 5%. The stability study reports were showed in Table.4.
Table 4: Stability results of developed method.
| S.No | Stability test | RTNVR | percentage of change | OMBTSR | Percentage of change | PTVR | percentage of change |
| 1 | Blank | 00 | 00 | 00 | 00 | 00 | 00 |
| 2 | Freshly prepared | 48893 | 0.0 | 34365 | 0.0 | 28082 | 0.0 |
| 3 | Bench top | 48091 | 1.65 | 33449 | 2.67 | 27800 | 1.01 |
| 4 | Auto sampler | 47367 | 3.13 | 33270 | 3.19 | 27989 | 0.34 |
| 5 | Freeze &Thaw | 49590 | 1.42 | 33666 | 2.04 | 27921 | 0.58 |
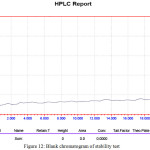 |
Figure 12: Blank chromatogram of stability test |
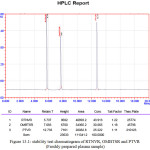 |
Figure 13.1: stability test chromatogram of RTNVR, OMBTSR and PTVR (Freshly prepared plasma sample) Click here to View figure |
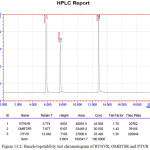 |
Figure 13.2: Bench-topstability test chromatogram of RTNVR, OMBTSR and PTVR
|
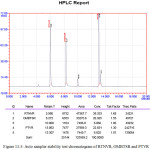 |
Figure 13.3: Auto sampler stability test chromatogram of RTNVR, OMBTSR and PTVR |
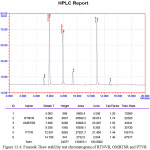 |
Figure 13.4: Freeze and Thaw stability test chromatogram of RTNVR, OMBTSR and PTVR |
Results and Discussion
The developed method was simple, accurate and precise than reported methods. In this method the primarily chromatographic experiments were set to elute selected analytes in biological fluid. The method was validated over the concentration range of 0.15-1.2 µg/ml for RTNVR, PTVR and 0.25-2.0 µg/ml for OMBTSR. The mean percent recovery of RTNVR is 99.81%, OMBTSR is 101.42% and PTVR is 100.38. The intraday and inter day precision was conducted at standard concentration limits, the Percentage of RSD is below 2%. The LOQ concentrations are 0.0375 µg/ml for RTNVR, PTVR and 0.0625 µg/ml for OMBTSR. Stability (Bench top, Auto sampler, Freeze thaw) of compounds was established in a series of stability studies.
Conclusion
This method is suitable use in clinical studies to determination optimal therapeutic ranges for RTNVR, OMBTSR and PTVR and then for regular analysis and therapeutically drug monitoring of RTNVR, OMBTSR and PTVR.
Competing Interests
No competing interests.
References
- The selection and use of essential medicines: Twentieth report of the WHO Expert Committee 2015 (including 19th WHO Model List of Essential Medicines and 5th WHO Model List of Essential Medicines for Children).WHO. 2015, 71.
- Papaseit Intensive Care Medicine, 2012, 38(7),1239–1240.
- British National Formulary (69 ed.), Pharmaceutical Pr.2015,426.
- Jordan J. Feld , N Engl J Med, 2014, 370,1594–1603.
CrossRef - Kowdley , New England Journal of Medicine, 2014,370 (3),222–232
- Ghosh C. J Bioequiv Availab, 2011,3,020-025.
- Wu XL J Bioequiv Availab, 2011,3,032-037.
- Nanjwade BK J Bioequiv Availab, 2011, 3, 011-015.
- Wulandari M, J Bioequiv Availab, 2011, 3,016-019.
- Jang IJ, J Bioanal Biomed, 2011, 3,059-063.
- Rajender G., Pharm Anal Acta, 2010,1,101.
CrossRef - NourahZoman Al-Zoman., Chem Cent J, 2017,11,1.
CrossRef - J Ocque., Bioanalysis, 2016, 8(13),1353-1363
CrossRef - Jyoti M. Salunke Der Pharmacia Lettre, 2013, 5(4),1-6
- Rajasekhar., Chromatographia, 2010,71(9) 815–824
- K Vinod Kumar., IJPRR (2014),3(9)1
- Jagadeeswaran M., Pharmaceut Anal Acta 2012, 3,160
- Suneetha A., International Journal of Pharmacy and Pharmaceutical Sciences,2011,3(1), 49-51
- B. Prasanthi., Journal of Analytical Chemistry, 2015,70(8),1015–1022
CrossRef

This work is licensed under a Creative Commons Attribution 4.0 International License.


