Dielectric and Optical Band Gap Studies of Nanostructured Manganese Nickel Oxide and Cobalt Nickel Oxide
C. R. Indulal1, R. Biju2, Deepak Nand2 and R. Raveendran2
1Department of Physics, S.G. College, Kottarakara, Kerala, India.
2Nanoscience Research laboratory, S.N. College, Kollam, Kerala, India.
Corresponding Author E-mail: ltdrindulal@gmail.com
DOI : http://dx.doi.org/10.13005/ojc/330365
Nano oxides of Manganese Nickel and Cobalt Nickel were synthesized by chemical co-precipitation method from the reaction of respective metal sulfides of manganese, nickel, cobalt and sodium carbonate using ethylene diamene tetra acetic acid as an effective capping agent. The carbonate precursors were heated at different temperatures so as to form their oxides. Through the X-ray line broadening technique, the mean particle sizes were calculated at different temperatures. The elastic micro strains versus particle size variations were thoroughly studied. The metal oxide formations of Manganese Nickel and Cobalt Nickel were confirmed with the help of FTIR spectra. EDX spectra of Manganese Nickel oxide and Cobalt Nickel oxide provide chemical composition of the samples. The crystallite shapes were studied using the scanning electron microscopy images. The optical direct band gap values of both Manganese Nickel and Cobalt Nickel oxides were calculated using Tauc’s relation.
KEYWORDS:Nanoparticles; SEM; EDX; Optical band gap; Dielectric properties
Download this article as:| Copy the following to cite this article: Indulal C. R, Biju R, Nand D, Raveendran R. Dielectric and Optical Band Gap Studies of Nanostructured Manganese Nickel Oxide and Cobalt Nickel Oxide. Orient J Chem 2017;33(3). |
| Copy the following to cite this URL: Indulal C. R, Biju R, Nand D, Raveendran R. Dielectric and Optical Band Gap Studies of Nanostructured Manganese Nickel Oxide and Cobalt Nickel Oxide. Orient J Chem 2017;33(3). Available from: http://www.orientjchem.org/?p=34039 |
Introduction
Oxides of cobalt are stable and are available in abundance which are cheaper than other noble metals. In the recent past, oxide nanomaterials have been drawing wide attention due to their comparatively excellent electrical, optical[1-2] or magnetic [3] properties. Generally nanoparticles have large surface to volume ratio. So their properties such as electrical, optical, etc. can be tuned by engineering size, morphology or composition. Nano oxides of Manganese Nickel and Cobalt Nickel with large surface area can be used in gas sensors. These nano oxide systems may have entirely different properties compared to their parent bulk materials [4]. The ultra fine oxide nanoparticles exhibit unique UV absorbing ability, excellent stability at elevated temperatures, very high hardness and reactivity as catalyst [5-6]. Manganese-Nickel oxide and Cobalt-Nickel oxide systems can be considered as potential candidates for electrodes in batteries, in super capacitor, in sensors, switches etc.
Materials and Methods
The nano particles of both Manganese-Nickel oxide (MnNiO) and Cobalt-Nickel oxide (CoNiO) were synthesized by arrested precipitation from AR grade 0.4M cobalt sulphate, 0.4M nickel sulphate, 0.4M manganese sulphate and 0.6M sodium carbonate using ethylene diamene tetra acetic acid as an effective capping agent. The carbonate precipitates so formed were separated from the reaction combination and were washed with distilled water and ethanol to remove all impurities. The dried precipitates at room temperature were thoroughly grounded using an agate mortar to obtain their metal carbonate precursor in the form of fine powder. On heating to sufficient temperatures (400, 600 and 800ºC), these carbonate precursor decomposes to their corresponding metal oxides.
Characterization
XRD is one of the ideal techniques used for the determination of crystallite size of the nano powders. Based on the broadening of diffraction peaks, a few techniques involving Scherrer equation, Integral breadth analysis or Hall-Williamson approach and Fourier method of Warren-Averbach etc. were developed [7-9]. Warren and Averbach proposed the first theory related with the broadening of diffraction peaks. XRD studies were done on XPERT-PRO powder diffractometer with Cu- Ka radiation in the 2q range 10° to 70° at 30mA, 40kV. The surface morphological studies of the powder samples were evaluated by a scanning electron microscope. The energy dispersive analyses of X- rays were carried out on the nano samples to ascertain its precise composition. The ultra violet spectroscopic studies were carried out using Shimadzu UV-2550 UV visible spectrophotometer.
Results and Discussion
XRD Studies
The nano crystallanity of the powder samples are verified using XRD analysis. The nano particle sizes are calculated using Debye-Scherrer equation, d = 0.9l/bCosq [10], where b represents the full width at half maximum of XRD lines, l = 1.54060 [Å]. Figure 1A and 1B represents the XRD patterns of MnNiO and CoNiO sintered at 600ºC. The most intense peaks are obtained from the (311) planes. The crystallite sizes of MnNiO and CoNiO at 400, 600 and 800ºC using Debye-Scherrer equation are as recorded in Table 1A and 1B respectively. On analyzing the table, it is confirmed that when the temperature increases, the particle size also increases. So temperature of the reaction can be considered as one of the prime parameters on the crystallites size [11]. The reason for increasing particle size with increase in sintering temperature is either due to the Ostwald ripening or oriented attachment. Ostwald ripening happens mainly because, larger particles are energetically more stable than smaller ones and it is also due to the effect of potential energy difference between larger and smaller particles which may happens through solid state diffusion. The crystallographic phases and cubic structure of the synthesized nano particles are confirmed by comparing it with JCPDS files (File No 01-1110 and 20-0781). The basic reason for the broadening of the peaks in the XRD pattern is micro straining of the crystal structures which are arising from the various defects like dislocations/twinning. They are supposed to be connected with chemically synthesized nanoparticles. At the time of crystals growth, the ligand may get only negligible time to diffuse to an energetically positive site which results in crystal defects [12].
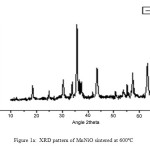 |
Figure 1a: XRD pattern of MnNiO sintered at 600ºC |
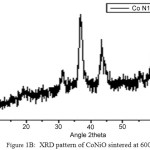 |
Figure 1b: XRD pattern of CoNiO sintered at 600ºC. Click here to View figure |
Table 1A
| Sintering temp ºC | Particle size (nm) | Elastic strains | Band gap (eV) |
| 400 | 8 | 0.00262 | 1.44 |
| 600 | 17 | 0.00131 | 1.41 |
| 800 | 41 | 0.00056 | 1.37 |
Table 1B
| Sintering temp ºC | Grain size (nm) | Elastic strains | Band gap (eV) |
| 400 | 6 | 0.00382 | 1.43 |
| 600 | 20 | 0.00116 | 1.39 |
| 800 | 42 | 0.00069 | 1.33 |
The elastic strain of MnNiO and CoNiO are found out using the values of full width at half maximum of XRD lines [13]. From the table 1A and 1B, it is confirmed that, as the nano particle size increases elastic strain decreases. This strain is one of the major reasons behind the broadening of the XRD peak of the nanomaterials.
Microstructural Studies
For the surface morphological studies, the nano powders heated at 600ºC were transferred in to the SEM chamber. SEM images along with EDX of both MnNiO and CoNiO nanoparticles are shown in the Fig. 2A, 2B, 3A and 3B respectively. The nanoparticles are found to be almost spherical with some agglomerations.
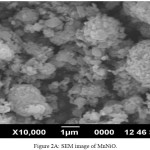 |
Figure 2a: SEM image of MnNiO. |
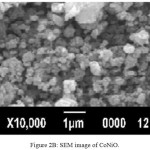 |
Figure 2b: SEM image of CoNiO. |
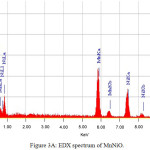 |
Figure 3a: EDX spectrum of MnNiO. |
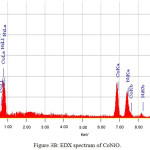 |
Figure 3b: EDX spectrum of CoNiO. |
FTIR Studies
The FTIR spectra of both MnNiO and CoNiO are shown in Fig. 4A and 4B respectively. The absorption bands found in the regions 3420cm-1 for MnNiO and 3430cm-1 for CoNiO are broad and are due to the presence of co-ordinated or entrapped water in the samples. The bands in the regions 1640 and 1630 cm-1 for both MnNiO and CoNiOcorrespond to carboxylate ions [14-15]. There are some bands around 600cm-1 which might be due to the bending modes of the metal oxides in the nanoparticles.
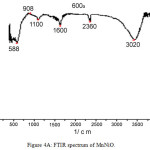 |
Figure 4a: FTIR spectrum of MnNiO. Click here to View figure |
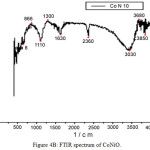 |
Figure 4b: FTIR spectrum of CoNiO.
|
UV Spectral Studies
The ultra violet spectra of both MnNiO and CoNiO sintered at 400, 600 and 800ºC are taken in the wavelength range 200 to 800 nm are shown in fig 5A and 5B respectively. The optical band gaps of the nanoparticles are found out using the UV spectra.
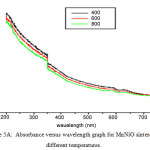 |
Figure 5a: Absorbance versus wavelength graph for MnNiO sintered at different temperatures.
|
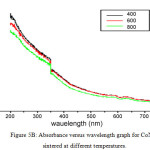 |
Figure 5b: Absorbance versus wavelength graph for CoNiO sintered at different temperatures.Click here to View figure |
On analyzing the UV spectra, there is a decrease in absorbance with increase in wavelength which can be considered as an indication of the presence of optical band gaps in the materials. This decrease corresponds to excitation of surface plasmons in the nano composite. The Tauc’s relation connects energy band of the material and the absorption coefficient by the formula αhυ = A(hυ – Eg)n, where A is a constant, hυ is the photon energy, Eg is the band gap energy; for an allowed direct transition the value of n is 1/2. (αhυ)2 versus hυ graphs in Fig 6A and 6B gives the of direct band gap values [16] of MnNiO and CoNiO sintered at 600ºC.
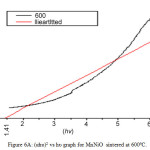 |
Figure 6c: (αhυ)2 vs hυ graph for MnNiO sintered at 600ºC. Click here to View figure |
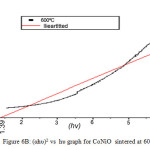 |
Figure 6b: (αhυ)2 vs hυ graph for CoNiO sintered at 600ºC. Click here to View figure |
When the sintering temperature increases, the nano particle size increases. However the band gap decreases. The reason for decreasing band gap with increase in sintering temperature may be due to the surface defects on the nanocomposite. So it is concluded that the band gap has an inverses dependence on the particle size of these nanocomposite.
Dielectric Studies
To study the dielectric constant values of both MnNiO and CoNiO, the nanopowders were first pelletized and then studied about the variations of dielectric constant with frequency of the applied field. Fig 7A and 7B represents the dielectric constant versus frequency graphs of both MnNiO and CoNiO at 600ºC. The dielectric constant decreases very fast in the low frequency region but after that it reaches a constant value which shows that it is independent of frequency at high frequency region. The dielectric nature of the nanoparticles is mainly due to space charge and rotational polarizations [17]. Nanoparticles possess a large number of interfaces and the defects in these interfaces can cause a change of positive as well as negative space charge distribution. In the presence of an electric field these space charges can move and may be trapped by the defects which results in the formation of dipole moments. Interfaces found in nanoparticles contain several oxygen ion vacancies, and are equivalent to positive charges giving dipole moments. When exposed to an electric field, these dipoles can rotate, giving a resultant dipole moment in the direction of the field. These are the reasons for the high value of dielectric constant at low frequencies [18].
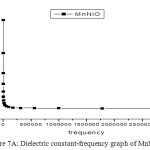 |
Figure 7a: Dielectric constant-frequency graph of MnNiO at 600ºC.
|
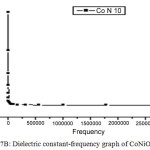 |
Figure 7b: Dielectric constant-frequency graph of CoNiO at 600ºC. Click here to View figure |
CoNiO nanoparticles are found to be better dielectric material than MnNiO nanoparticles at all frequencies especially in the lower regime.
Conclusions
Nanoparticles of Manganese-Nickel Oxide and Cobalt-Nickel oxide were prepared by arrested precipitation. The X-ray diffractograms compared with JCPDS data confirms the presence of the cubic phases with prominent peaks at (311). From the XRD analysis, there is a direct dependence of sintering temperature and particle size. The nanoparticles are found to be almost spherical in shape with agglomerations to a certain extend. Optical absorption studies indicate that Manganese-Nickel Oxide and Cobalt-Nickel oxides have the direct band gaps which decrease with increase in temperatures. Variations in the dielectric constant with frequency of the applied field are thoroughly studied for both the samples so as to recommend CoNiO as a better dielectric material compared to MnNiO nanoparticles.
References
- Lopez, R.; Haynes, T .E.; Boatner, L. A.; Haglund, R. F.; Opt. Lett. 2002, 27, 1327-1329.
CrossRef - Ikeyama, M.; Nakao, S.; Tazawa, M.; Kamada, K.; Nucl Instrum Methods Phys. Res. B 2001, 652, 175-177.
- Muroi, M.; Street, R.; McCormick, P. G.; J. Appl. Phys. 2000, 87, 3242-3244.
- Kenneth J. Klabunde; Cathymohs, Department of Chemistry, Kansas state university, Manhanttan Kansas second Edition, 1998.
- Tsai, M. S.; Mater. Sci. Eng. B. 2004, 110, 132-134.
CrossRef - Mori, Wang, Y. R.; Drennan, Solid State Ionics 2004, 175, 641-649.
CrossRef - Scherrer, P.;, Math. Phys. K. 1918, 1, 187.
- Williamson, G. K.; Hall, W. H.; Acta Metall. 1953, 1, 22-31.
CrossRef - Warren, B. E.; Averbach, B. L.; J. Appl. Phys. 1950, 21, 595-599.
CrossRef - Cullity, B. D.; Elements of X-ray diffraction, Addison – wesley publishing company Inc California, 1970 . 102.
- Wang, L. P.; Hong, G. Y.; Qu, S. C.; Wang, Z. G.; Nanotechnology. 2005, 16, 1469-1473.
CrossRef - Warad, H. C.; Ghosh, S. C.; Hemtanon; Sci. Technol. Adv. Mater. 2005, 6, 296-301.
CrossRef - Robert Kelsall; Ian Hamley; Mark Geoghegan; Nano Scale Science & technology, (John Wiley, Chichester), 2005.\
- Ehrlich, G.; J Am Chem Soc. 1954, 76, 5263-5268.
CrossRef - Douville, F.; Duval, G.; Lecomte, J.; Compt Rend Acad Sci. 1941,963, 212.
- Mohanta, D.; Nath, S. S.; Mishra, N. C.; Choudhury, A.; Bull. Mater. Sci. 2003, 26, 289-294.
CrossRef - Mo Chi-Mel; Zhang Lide; Wang Guozhong, Nanostuctr Mater. 1995,6, 823-826.
- Tareev, B.; Physics of dielectric materials (Mir Publishers, Moscow), 1979.

This work is licensed under a Creative Commons Attribution 4.0 International License.


