Optimization of Calcium Sulfate Precipitated in the Laminar Flow Pipe Through Response Surface Modeling of Temperature, Ca2+ Concentration and Citric Acid Additives
S. Raharjo1, S. Muryanto2, J. Jamari3 and A. P.Bayuseno3,*
1Department of Mechanical Engineering, Muhammadiyah University in Semarang, Indonesia.
2Department of Chemical Engineering, UNTAG University in Semarang, Semarang Indonesia.
3Department of Mechanical Engineering, Diponegoro University, Semarang Indonesia.
*Corresponding Author E-mail: apbayuseno@gmail.com
DOI : http://dx.doi.org/10.13005/ojc/320637
This paper presents results of investigation of scaling of calcium sulfate (CaSO4) on metallic pipes. In this study, the optimizing variables; namely temperature (50-600C), concentration of Ca2+ (2000-3000 ppm), citric acid concentration (10-20 ppm) were set-up to provide the optimum yield of the mass scales. The mineral scale detected using XRD is mainly gypsum, and the scale has a plate like morphology under SEM examination. SRM (surface response methodology) prediction provided that the temperature is a significant factor, while the Ca2+ concentration and the citrate are insignificant variables determining the optimal condition of the mass scale yields. An optimized mass scale response of 119.99 mg was obtained at a temperature of 56.36 OC, concentration Ca2+ of 2649.21 ppm and citric acid concentration of 12.11 ppm, respectively. The addition of citric acid did not modify the crystal morphology, but may control the size of crystals.
KEYWORDS:Calcium sulfate; Surface response methodology (SRM); XRD/SEM analysis; Gypsum
Download this article as:| Copy the following to cite this article: Raharjo S, Muryanto S, Jamari J, Bayuseno A. P. Optimization of Calcium Sulfate Precipitated in the Laminar Flow Pipe Through Response Surface Modeling of Temperature, Ca2+ Concentration and Citric Acid Additives. Orient J Chem 2016;32(6). |
| Copy the following to cite this URL: Raharjo S, Muryanto S, Jamari J, Bayuseno A. P. Optimization of Calcium Sulfate Precipitated in the Laminar Flow Pipe Through Response Surface Modeling of Temperature, Ca2+ Concentration and Citric Acid Additives. Orient J Chem 2016;32(6). Available from: http://www.orientjchem.org/?p=25476 |
Introduction
Calcium sulfate (i.e., gypsum, anhydrite and hemi-hydrate), is commonly formed as scale minerals in pipes of industries ranging from oil and gas to desalination. Scaling of calcium sulfate occurs when the surfaces of metallic pipes contact with the supersaturated water, which can create in technological problems such as the diminution of heat transfer, increase of energy consumption and unscheduled equipment shutdown1-2. Additionally, this existing scale cannot be removed by acid, but only it can be taken away by mechanical method. Nowadays, much effort has been made in meditating on the precipitation of calcium sulfate in view of their applications in a routine of industrial and environmental engineering2. Written report on this mineral scale formation have been previously focused on examining precipitation formed in the bulk solution by using laboratory beaker or bulk jar tests3. Here two mechanisms of crystallization of calcium sulfate are commonly experienced in the water system. Firstly, homogenous crystallization frequently occurs in the aqueous solution in the absence of any foreign ions. Secondly, the calcium sulfate particles are mainly formed in heterogeneous processes by the presence of a foreign solid phase4-5.
Further study on the aspect of calcium sulfate scaling has resulted in numerous studies for the methods to detect and assess the scale formation on metal surfaces. Calcium sulfate has been recognized as a mineral with relative insolubility, thus it can be easy to be precipitated where calcium and sulfate present in the aqueous solution and subsequently lead to the scale formation even at low pH. Theoretical solubility model of the calcium sulfate compounds in water and in multi-component aqueous solutions, has been discussed previously2. The solubility of calcium sulfate hydrates may be expressed as the following equation:
CaSO4·nH2O(S) ↔ Ca2+ +SO42− +nH2O (1)
Ca2+ +SO42− ↔ CaSO4(aq) (2)
where n = 0, 0.5 and 2 corresponding to anhydrite, bassanite and gypsum, respectively. Here, gypsum is considered as the most stable phase found in lower temperatures, while anhydrite can be commonly formed at higher temperatures6. Additionally the scale formation of calcium sulfate is influenced by many factors such as concentration of solution, pH value, temperature, pressures, and ionic strength7. Correspondingly, sulfate scaling of Ca-ions is of particular interest because this precipitation has shown inverse solubility, i.e. its solubility reduces with increasing temperature. Because calcium sulfate polymorphism is a complicating factor, the detailed mineralogical study of deposits is required to understand the mechanism tendency scaling of the surface 6-8.
Mode of scale deposit formation is reported to be classified as two groups2: (i) surface crystallization in which mineral precipitated more or less selectively onto the surfaces of the equipment in contact with the aqueous fluids (usually at elevated temperature) and (ii) bulk crystallization which involves the accumulation of precipitates as a result of sedimentation or transport by fluid flow. In this second mode, the scale can be created spontaneously in the bulk, once the supersaturated solution increases, or corrosion by-products are formed at a second stage sediment out. Moreover, scaling in pipe system may be imputed by a combination of these two pathways and also kept in line by the process condition in pipes. Correspondingly, the mitigation of mineral scaling may be performed by the utilization of chemicals and antiscalants for inhibiting nucleation, crystal growth or both. For instance, polyacrylic acid, polyacrylamide, polymaleic anhydride, and polyphosphates are commonly employed 9-10. At that place are likewise a large number of commercial antiscalants with new formulations being continuously upgraded and tried out for a form of scaling species7. Among the various systems of using chemical additives, the prevention of scaling depends on their chemistry and the nature of the solids forming7. Here, the use of poly (citric acid) has been demonstrated to suppress the formation of calcium sulfate scale at low concentrations11. The poly (citric acid) has the absorption ability of the surface of calcium sulfate scale crystals, thus distorting their scale crystal polymorphs. Therefore, it is potential as a calcium sulfate scale inhibitor, which can be prepared from monomer citric acid. Additionally, the citric acid is usually utilized as additive in the transformation of bassanite to gypsum 12.
Instead, citrate has widely known as scale inhibitor for calcium carbonate (CaCO3) 13-14-15-16 crystallization, because it can absorb on the calcium carbonate crystal for prevention of crystal particles growing. Nevertheless, a problem of using citric acid in the water system may be linked to the long retention time of crystal growth. Therefore, in that location is still considerable debate and doubt over the mechanism of the effects of variable concentrations of a carboxylic acid and/or various carboxylic acid used in the prevention of crystal growth17-18. To come up to this gap results may need a detailed research on the effects of the carboxylic acids (citric, maleic and tartaric) and variable additive concentrations on the kinetics and phase morphologies that develop during calcium sulfate formation reactions and it can subsequently gain a more mechanistic understanding of the crystallization19.
The present study was undertaken for examining the calcium sulfate scale precipitation in pipes through controlling the independent operating variables. The variables investigated were: temperature, Ca2+ concentration and citric acid additives. Material characterization, including SEM for morphological analysis and XRPD for phase composition was applied in the study. In this work, the central composite design (CCD) for calculating the surface response methodology (SRM), involved temperature and Ca2+ concentration, the citric acid additives to maximize calcium sulfate precipitation. A second order transferred polynomial model (as an inverse model) was determined for the yield of mass scale as a function of these variables.
Materials and Method
Reagents
Materials needed in the preparation of the supersaturated solutions were calcium chloride (CaCl2) and sodium sulfate (Na2SO4) powder with the analytical grade (Merck™). The citric acid (C6H8O7) with analytical grade (Merck™) was also used as additives. The crystal-forming solutions were made using distilled water.
Procedures and Measurements
Experiments were carried out using a laboratory equipment for calcium sulfatecrystallization is shown in Fig. 1. Crystallization experiments were performed similar to the method proposed by Muryanto et al (2014)20, by dissolving each of CaCl2 and Na2SO4 crystals in the distilled water (500 ml) for providing Ca2+ concentration of 2000, 2500 and 3000 ppm. Citric acid (10, 15 and 20 ppm) was added by dissolving the crystals C6H8O7 in a vessel containing 500 ml of solution CaCl2, then stirred until well mixed. For the experiment, one liter containing each of equimolar CaCl2 and Na2SO4 was prepared. The solutions at predetermined concentrations were separately placed in the two vessels and equilibrated until the designated temperature (50-60 OC) was reached. The conductivity of solutions, leaving the test pipe section was continuously checked for up to 2 hours. The scale deposited on the surface of the coupons within the housing sample was carefully removed and dried in an oven overnight at 60 OC. The dried coupons were taken out to be weighed. The weight difference of the coupons obtained before and after the experiments was identified as the scale mass. The scale deposited on the surface of the coupons was carefully removed and kept in a plastic container for subsequent characterization.
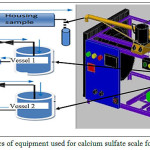 |
Figure 1: Schematics of equipment used for calcium sulfate scale formation in pipes |
Materials Characterization
All powder samples were carbon-coated prior to investigation by scanning electron microscopy (SEM) (FEI Inspect S50) with energy dispersive spectroscopy (EDS) system fitted with a field emission source and operating at an accelerating voltage of 15 KV. Phase identification of scale mineral was conducted by XRPD (X-ray powder diffraction) analysis. XRPD data were acquired by a conventional Bragg-Brentano (BB) diffractometry with parafocusing geometry and Cu-Kα monochromated radiation. The scan parameters (5-90 2θO, 0.020 steps, 15 s/step) were taken as required for observation. A PC-based search match program, the Philips X’Pert Software (Philips Electronics N.V) was to identify possible crystalline phases in the samples. In this method, the peak positions and peak heights were verified against the entries in the ICDD-PDF (International Centre for Diffraction Data-Powder Diffraction File). The identified mineral phases were subsequently adjusted by Rietveld method using Fullprof-2k, software, program version 3.30 21-22. The crystal structure model for the Rietveld refinement was obtained in the AMCSD (American Mineralogist crystal structure database). The detailed discussion of the method is provided elsewhere 23-24.
Experimental Design
In this study, the optimization of the three variables (temperature, Ca2+ concentration, and citric acid) to yield the optimum mass scale was performed using SRM within the CCD (Table 1). SRM calculation was conducted by the statistical v. 6 software packages (StatSoft, Tulsa, OK, USA). Using this method, the proper response value and mathematical model fitted to the measured data was acquired from the experiments, and the independent variables of optimal conditions.
Table 1: Range and level of Independent Variable
| Independent variable | Range and level | ||
| Low level (-1) | Center level (0) | High level (+1) | |
| Temperature (0C) | 50 | 55 | 60 |
| Concentration Ca2+ (ppm) | 2000 | 2500 | 3000 |
| Citric acid (ppm) | 10 | 15 | 20 |
Results and Discussion
Properties of Solid Precipitated Crystals
The corresponding solid crystals were subjected to XRPD as shown in Figures 2a and 2b. The quality of Rietveld refinements of the crystalline scale may be gauged from the diffraction plot (Fig. 2a), where the assigned phases clearly stand out in the difference curve of the calculated and the measured diffraction profile. The Rietveld analysis of crystals proved that only the gypsum polymorph present in scale obtained from the solution in the absence of additives at a temperature of 50 OC. In this experiment, metastable crystalline phases of bassanite and amorphous calcium sulfate were not identified. Depending on the amount of citric acid additives, gypsum crystals were predominantly precipitated on the surface of all coupon samples (Fig. 2b). Nevertheless, in the presence of 10 ppm citric acid additive, it is shown that the probability amorphous phase of calcium sulfate, which have peaks with low intensity, could be identified by their XRPD patterns.
Further, gypsum crystal habit, morphology and size did not vary throughout the sample depth depending on the additive concentration. The surface of gypsum crystals was composed of micrometer-sized monoclinic crystals with a plate-like morphology (Fig. 3). This gypsum crystals are same as the finding in the literature18. These crystals formed a layer at the surface within a size of around 10 μm (Fig. 3a-c). In the presence of 20 ppm citric acid, the shape, size or habit of the end-product gypsum were similar to the CaSO4 experiment without additives, although several small size of the gypsum needles was observed. The citric acid additive may control the growth of the scale mineral, however, there was no significant different habits found in gypsum obtained from the solution to the free-additive.
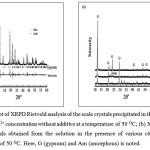 |
Figure 2: (a) Plot of XRPD Rietveld analysis of the scale crystals precipitated in the solution of 2000 ppm Ca2+ concentration without additive at a temperature of 50 OC; (b) XRPD pattern of the crystals obtained from the solution in the presence of various citric acid at a temperature of 50 OC. Here, G (gypsum) and Am (amorphous) is noted. |
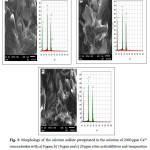 |
Figure 3: Morphology of the calcium sulfate precipitated in the solution of 2000 ppm Ca2+ concentration with; a) 0 ppm; b) 10 ppm and c) 20 ppm citric acid additives and temperature of 50 OC. |
Predicted Model and Statistical Analysis
Variables for response optimization was modeled using SRM with the CCD (Table 1), where there are 3 factorial design 2(3) in CCD providing nc = 8; ns = 6; no = 2 and run = 16. Moreover preliminary studies were carried out to determine the required range of temperatures (X1, 50-60 OC), Ca2+ concentration (X2, 1500-3000 ppm) and citric acid additives (X3, 10 -20 ppm). Factors and level for SRM consisted of low level (-1) = 50; 2000; 10, high level (+1) = 60; 3000; 20, and center point (0) = 55; 2500; 15. The whole design of experimental response of mass scales (mg) is listed in Table 2.
Table 2: Factor and level for SRM and Experimental Design with Independent Variables
| Run | Independent variable | Response | ||
| Temperature (0C) | Concentration Ca2+ (ppm) | Citric Acid (ppm) | Mass scales (mg) | |
| 1 | 50.00 | 2000.00 | 10.00 | 44 |
| 2 | 50.00 | 2000.00 | 20.00 | 35 |
| 3 | 50.00 | 3000.00 | 10.00 | 88 |
| 4 | 50.00 | 3000.00 | 20.00 | 25 |
| 5 | 60.00 | 2000.00 | 10.00 | 64 |
| 6 | 60.00 | 2000.00 | 20.00 | 75 |
| 7 | 60.00 | 3000.00 | 10.00 | 86 |
| 8 | 60.00 | 3000.00 | 20.00 | 102 |
| 9 | 46.59 | 1500.00 | 15.00 | 15 |
| 10 | 63.41 | 1500.00 | 15.00 | 118 |
| 11 | 55.00 | 659.10 | 15.00 | 11 |
| 12 | 55.00 | 2340.90 | 15.00 | 87 |
| 13 | 55.00 | 1500.00 | 6.59 | 88 |
| 14 | 55.00 | 1500.00 | 23.41 | 13 |
| 15 (C) | 55.00 | 1500.00 | 15.00 | 82 |
| 16 (C) | 55.00 | 1500.00 | 15.00 | 82 |
Based on multiple regression analysis of the experimental data, the optimization resulted in the following second-order polynomial equation in term of code values:
Y = – 452.9011 + 15.24867 X1 – 0.03793 X12 + 0.0868 X2 + 0.000002 X22 -21.21898 X3 + 0.3642 X32 – 0.00143 X1X2 + 0.495 X1X3 – 0.00116 X2X3
where Y is the yield of mass scale (mg), and X1, X2 and X3 are the coded variables for temperature, Ca2+concentration and citric acid concentration, respectively. Analysis of variance (ANOVA) for the statistical testing of the model is shown in Table 3. Here, the ANOVA fitted the quadratic polynomial model of mass scale yield. The influence of the significance of a factor can be seen from F-value and p-value. The quadratic regression model showed the value of determination coefficient (R2) of 0.965 with no significant lack of fit at p > 0.05 which means that the calculated model fitted 96.5 % of the result and only 3.5% of the total variation did not fit to the model. The p-value less than 0.05 with an accuracy of 95% indicates that the relationship between the response and the independent variables can be fitted using the model. The significance of the model was also judged by F-test, where F -value is defined as the ratio between MSF (mean squares of factor) of the MSE (mean squares of error). A factor can be said to have a significant effect when the F -value is greater than F-table.
Table 3: ANOVA for the Fitted Quadratic Polynomial model of yield of mass scale
| Source | Sum ofSquares (SS) | Degreeof freedom (DF) | MeanSquare (MS) | F-value | F-table | R2 |
| S.S. regression | 16191.88 | 9 | 16191.88 | 26.51 | 4.1 | 0.965 |
| S.S. error | 3664.31 | 6 | 610.719 | |||
| S.S. Total | 19856.19 | 15 |
The F -value of model compared with the F-table shown in Table 3, provided that the F -value is greater than the F- table. This demonstrates a substantial outcome on the response variable of the mass scales. The same matter can be seen in chart Pareto, as depicted in Figure 4.
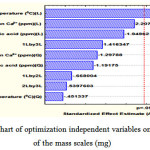 |
Figure 4: Pareto chart of optimization independent variables on the response of the mass scales (mg) |
It shows that p-value is less than 0.05 providing that the independent variables have insignificant effect. Apparently, the optimization variables for the response of the scale mass (mg) may be related to the temperature (X1). In contrast, the influence of linear concentration (X2), linear of citric acid (X2), the interaction between temperature and citric acid (X1X3), quadratic concentration (X22), quadratic of citric acid (X32), the interaction between temperature and concentration ( X1X2), the interaction and the concentration of citric acid (X1X2), quadratic temperature (X12) can be ignored because they may not provide a significant effect on the response of the mass scales.
Optimization of Independent Variables for the Response of Mass Scale
The interaction of independent variables in response of mass scale yield was depicted by 3D response surface and 2D contour plots created by the model (Figs. 5-7). Different shapes of the contour plots showed different interactions between the variables, where the significant interactions between the variables was represented as an elliptical contour plot. In contrast, a circular contour plot presents the insignificant relationships between independent and dependent variables. Fig. 5 presents the interaction between temperature (X1) and Ca2+ concentration (X2) on the yield of mass scale. When the temperature below 50 OC, there was a small amount in the response, and the temperature below 50 OC did not show any obvious effect on extraction yield. However, the increase of temperature from 50 to 66 OC make improve the mass scale yield. The possible explanation could be that the increase in temperature can increase reaction speed and collisions between molecules occurring more quickly, so that the mass scale formation increases25.
Fig. 6 describes the effect of Ca2+ concentration (X2) and additive concentration (X3) on the yield of mass scale. It can be observed that when Ca2+ concentration (X2) was fixed at 0 levels, additive concentration (X3) displayed a quadratic effect on the response yield. Varying Ca2+ concentration from 1500 to 3000 ppm with an increase of citric acid additives from 8 to 16 ppm, the target compounds’ mass scale yield was increasing with increase of Ca2+concentration. Fig. 7 illustrates that an increase in temperature (X1) leads to increased production of mass scale. Maximal mass scale production was obtained at a citric acid concentration (X3) of 12.11 ppm. Here, the optimal range for mass scale production was from 50 to 66 °C and citrate of 10 to 20 ppm.
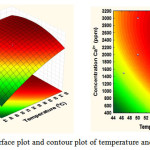 |
Figure 5: Response surface plot and contour plot of temperature and Ca2+ concentration |
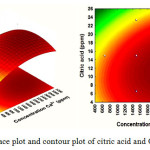 |
Figure 6: Response surface plot and contour plot of citric acid and Ca2+ concentration |
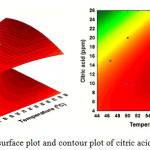 |
Figure 7: Response surface plot and contour plot of citric acid and temperatures |
To determine the optimum mass scales was done by entering values into the equation, which include the optimum ratio of the mass response for variable optimization. Optimum mass scales are shown in Table 4.
| Factor | Optimum state | Optimum mass scales (mg) |
| Temperature (OC) | 56.36 | 119.99 |
| Concentration Ca2+ (ppm) | 2649.21 | |
| Citric acid (ppm) | 12.11 |
Validation of the Predicted Value for the Optimal Variable
The results of SRM optimization were then verified using the experimental data. Verification was conducted by comparing the results of SRM optimization with the results of laboratory experiments. The calculation generated to the optimum yields of mass scale was based on temperatures (56.36 OC), Ca2+ concentration (2649.21 ppm) and citric acid additives (12.11 ppm), respectively. As shown in Table 4, three parallel experiments were carried out under the optimal conditions. The software predicted that the precipitated yield of total mass scale was 119.99 mg. The comparison was performed to acquire the % error of difference in optimizing response. Table 5 present results of experiments conducted in conformity with the optimum ratio of SRM for analysis yielding the mass scale of 121.34 mg. From the results of these experiments, the % error was calculated. Here the calculated % error for the mass scale response was 1.11 %. This means for the mass scale response has an accuracy of 99.99 %. So the results of the SRM optimization analysis were in agreement with the data of experimental mass scales.
Table 5: Optimum conditions and the predicted and experimental value of response at the optimum conditions
| Optimal variable | Optimum result SRM | Experiment result | % Relative Error | ||
| mass scales | |||||
| Temperatures (0C) | 56.36 | 119.99 | 121.34 | 1.11 % | |
| Concentration Ca2+ (ppm) | 2649.21 | ||||
| Citric acid (ppm) | 12.11 | ||||
| Relative error (%) = [(Experimental result – Optimum result SRM)/Experimental result] × 100%. | |||||
Conclusions
SRM optimization of variable operating conditions, provided that the most influence on the mass of the scale is temperature. The optimum result with the mass response scale (119.99 mg) was related to temperature of 56.36OC; concentration Ca2+ of 2649.21 ppm; citric acid of 12.11ppm, respectively. The crystalline phase of the scale was found to be mostly gypsum as shown by the XRD, although the amorphous phase may be developed on the scale in the solution with 10 ppm additive and a temperature of 50 OC. The SEM analysis also showed that the scale has a plate like morphology. The addition of citric acid seemed to not change the crystal morphology, only the possibility of citric acid additives may control crystal growth on the surface of the particles.
Acknowledgments
The authors would like to thank Muhammadiyah University in Semarang, Indonesia for funding this work and for providing the PhD scholarship program.
References
- Al Nassera, W.N.; Al-Salhib, F.H.; Hounslowa, M.J.; Salmana, A.D. Chem. Eng. Res. Des. 2011, 89, 500-511.
CrossRef - Azimi, G.; Papangelakis, V.G.; Dutrizac. J.E. Fluid Phase Equilibr. 2007, 260, 300-315.
CrossRef - Amiri, M.; Moghadasi, J. Pet. Sci. Technol. 2012, 30, 223-236.
CrossRef - Benatti, C.T.; Tavares, C.R.G.; Lenzi, E. J. Environ. Manage. 2009, 90, 504-511.
CrossRef - Silva, R.; Cadorin, L.; Rubio, J. Miner. Eng. 2010, 23, 1220-1226.
CrossRef - Singh, N.B.; Middendorf, B. Prog. Cryst. Growth Ch. 2007, 53, 57-77.
CrossRef - Amjad, Z.; Koutsoukos, P.G. Desalination. 2014, 335, 55–63.
CrossRef - Camarini, G.; De Milito, J.A. Constr. Build. Mater. 2011, 25, 412- 4125.
CrossRef - Kavitha, A.L.; Vasudevan, T.; Prabu, H.G. Desalination. 2011, 268, 38-45.
CrossRef - Wang, C.; Zhu, D.; Wang, X. J. Appl. Polym. Sci. 2010, 115, 2149-2155.
CrossRef - Zhao, Y.; Jia, L.; Liu, K.; Gao, P.; Ge, H.; Fu, L. Desalination. 2016, 392, 1-7.
CrossRef - Saha, A.; Lee, J.; Pancera, S.M. Langmuir. 2012, 28, 11182-11187.
CrossRef - Bassioni, G. J. Pet. Sci. Eng. 2010, 70, 298-301.
CrossRef - Chaussemier, M.; Pourmohtasham, E.; Gelus, D. Desalination. 2015, 356, 47-55.
CrossRef - Al-Roomi, Y.M.; Hussain, K.F. Desalination. 2016, 393,186-195.
CrossRef - Kırboga,S.; Oner, M. Colloid. Surface. B. 2012, 91,18-25.
CrossRef - Hasson, D.; Shemer, H.; Sher, A. Ind. Eng. Chem. Res. 2011, 50, 7601-7607.
CrossRef - Rabizadeh, T.; Peacock, L. C.; Benning, L.B. Mineral. Mag. 2014, 78, 1465-1472.
CrossRef - Tzotzi, C.; Pahiadaki, T.; Yiantsios, S.G.; Karabelas, A.J.; Andritsos, N. J Mater. Sci. 2007, 296, 171-184.
- Muryanto, S.; Bayuseno, A.P.; Sediono, W.; Mangestiyono, W. Education for Chemical Engineers. 2012, 7, 78-84.
CrossRef - Rietveld H.M. J. Appl. Crystallogr. 1969, 2, 65-71.
CrossRef - Rodriguez-Carvajal J. Program Fullprof.2k, version 3.30, Laboratoire Leon Brillouin, France, June 2005.
- Bayuseno A.P.; Schmahl W.W. Int. J. Environ. Waste Manage. 2015, 15, 39-66.
CrossRef - Mahieux P.-Y.; Aubert J.-E.; Cyr M.; Coutand, M.; Husson B. Waste Manage. 2010, 30, 378-388.
CrossRef - Martinod, A.; Euvrard, M.; Foissy, A.; Neville, A. Desalination. 2007, 220, 345-352.
CrossRef

This work is licensed under a Creative Commons Attribution 4.0 International License.


