Microstructure and Optical Properties of Composites Consisting of Nanoporous Stretched Polypropylene Doped with Liquid Crystals and Quantum Dots at a High Concentration
Konstantin Mochalov 1,2, Alexey Bobrovsky 3, Daria Solovyeva 1,2, Pavel Samokhvalov 2, Igor Nabiev 2,4 and Vladimir Oleinikov 1,2
1Laboratory of Molecular Biophysics, Shemyakin–Ovchinnikov Institute of Bioorganic Chemistry, Russian Academy of Sciences, UlitsaMiklukho-Maklaya 16/10, Moscow, 117997 Russian Federation.
2Laboratory of Nano-Bioengineering, National Research Nuclear University MEPhI (Moscow Engineering Physics Institute), Kashirskoe sh. 31, Moscow, 115409 Russian Federation.
3School of Chemistry, Moscow State University, Leninskie gory, Moscow, 119991 Russian Federation.
4Laboratoire de Recherche en Nanosciences, LRN-EA4682, UFR de Pharmacie, Université de Reims Champagne-Ardenne, 51100 Reims, France.
Corresponding Author E-mail: voleinik@mail.ru
DOI : http://dx.doi.org/10.13005/ojc/320604
Unique properties of nanohybrid composites based on different types of porous polymer matrices doped with fluorescent nanoparticles (quantum dots, QDs) are determined by the combination of the mechanical properties of the host matrix (flexibility, chemical stability, etc.) and a high luminescence intensity and extreme stability of QDs. Here, we report on the preparation, optical and microstructural characterization of a nanoporous stretched polypropylene matrix embedded with CdSe/ZnS QDs as fluorescent dopants at a high concentration. The microstructure and optical properties of two types films based on QD-polymer composites and liquid crystals are described. The distribution of QDs in the composite films and their morphology was determined. The annealing of the nanoporous composite films leads to shrinking of the pores and encapsulation of QDs, which results in a domain-like structure. The resulting flexible, stable and highly luminescent materials may be applied to obtain the highly luminescent diodes, the light converter devices and the display systems.
KEYWORDS:quantum dot-polymer composites; nanoporouspolypropylene; fluorescence
Download this article as:| Copy the following to cite this article: Mochalov K, Bobrovsky A, Solovyeva D, Samokhvalov P, Nabiev I, Oleinikov V. Microstructure and Optical Properties of Composites Consisting of Nanoporous Stretched Polypropylene Doped with Liquid Crystals and Quantum Dots at a High Concentration. Orient J Chem 2016;32(6). |
| Copy the following to cite this URL: Mochalov K, Bobrovsky A, Solovyeva D, Samokhvalov P, Nabiev I, Oleinikov V. Microstructure and Optical Properties of Composites Consisting of Nanoporous Stretched Polypropylene Doped with Liquid Crystals and Quantum Dots at a High Concentration. Orient J Chem 2016;32(6). Available from: http://www.orientjchem.org/?p=26298 |
Introduction
Designing organic–inorganic hybrid polymer composites has been a remarkable challenge in recent decades. Such composites combine good mechanical properties of polymer matrices with unique optical, electrical, and other characteristics of the inorganic dopants [1,2]. Semiconductor fluorescent quantum dots (QDs)are among the most prominent fluorescent dopants, attracting increasing attention due to their unique optical properties. QDs have broad light absorption bands and intense, narrow fluorescence bands whose spectral positions vary from the IR to almost the UV region. The wavelengths of the absorbance and fluorescence maximums can be easily tuned byvarying the QD size, which is determined by the conditions of their synthesis [3,4]. These propertiesof QDs make them the most promising type of fluorescent dopants for the development ofnanohybrid composites based on differenttypes of polymer matrices. Among the mainlines of research in this field, noteworthy are the development of techniques for highly homogeneous aligned distribution of QDs indifferent organic matrices [5-9], designing of light conversion devices [10-12], and sensing approaches [13,14]. Significant efforts have beenmade to engineer hybrid nanophotonicmaterials from different types of liquid crystalsand QDs [15,16]. Our research group has taken partin the development of photonic devices withphoto- and electrically controlled fluorescentproperties based on cholestericliquid crystalmatrices doped with CdSe/ZnS semiconductorfluorescent QDs [17-19], as well as the developmentof the techniques for characterization ofpolymer matrix–QD hybrid systems [20]. The maindifficulty with most of the polymer matrixdoping processes is an extremely lowconcentration of the homogeneously dispersedQDs, which prevents the use of these systemsfor engineering of highly luminescent devices.
In order to overcome this problem, weemployed a new strategy based onencapsulation of QDs into pores of porouspolymers. In our previous studies [21,22], a simpleand robust method of preparation of QD–polymer composite films out of nanoporouspolypropylene (PP) or polyethylene (PE) andCdSe/ZnS QDs was elaborated. In the study [16], two types of PP-based composite films were prepared. The first type was obtained by absorption of CdSe/ZnS QDs onto the porous structure of PP films, followed by annealing above the melting point of PP. The second typeof composite films was obtained by fillingporous QD–PP composites with a nematic liquidcrystal (LC) mixture. It has been shown thatboth types of composites are characterized bylow light scattering, which makes it possible tostudy their optical properties by means ofabsorbance and fluorescence spectroscopies.
The present paper describes detailedinvestigation of the microstructure and opticalproperties of such QD–polymer-liquid crystal (QD-PP-LC) compositefilms. For this purpose, two series of sampleswere prepared. One of them (Sample 1) wasobtained by filling PP with liquid crystals and a concentratedsolution of QDs in octadecene; the other(Sample 2), by filling PP with liquid crystals and a QD solution inoctadecene followed by washing the film withacetone and annealing it at 170°C.
Octadecene is a good solvent for QDs, with avery high boiling point (315°C) and a refractiveindex close to that of PP. The similarity of refractive indices allow transparent composite films to be obtained; the high boiling temperature and low vapor pressure ensure their stability.
The main goal of this study was detailedanalysis of the nanoporous structure andfluorescent properties of the obtainedcomposite films using optical and atomic forcemicroscopies and confocal fluorescencemicrospectroscopy. This combination ofmicroscopy methods allowed us to obtain dataon the morphology of composite films and QDdistribution in them. Proposed approach enablecontrolled engineering of nanohybridcomposites with desired morphology andphysical, mechanical and optical properties.
Experimental
Nanoporous PP Films
Nanoporous PP films were purchased fromCelgard (a CelgardR 2500 microporousmonolayer membrane). The thickness of thefilms was 25 μm, the porosity was 55%, and theaverage pore size was 0.064 μm.
Synthesis of QDs
The procedure of the synthesis of CdSe/ZnScore/shell QDs is described in detail in [3].CdSecores with a diameter of ~2.9 nm weresynthesized by the hot-injection method, usingn-hexadecylphosphonic acid as a capping agent.After isolation and purification, the CdSe coreswere coated with a three-monolayer ZnS shellin an octadecene-oleylamine solution, afterwhich the native surface capping ligands werereplaced with tri-n-octyl phosphine oxide(TOPO). The fluorescence quantum yield of thecore/shell QDs was 68%, as estimated usingrhodamine 6G as a reference dye. Prior tointroducing them into the PP matrix, thepurified CdSe/ZnS QDs were dissolved in 1-octadecene (20 mg/mL).
Preparation of QD–Polymer-Liquid Crystal Composites
The QD-PP-LC composites (Sample 1) wereprepared by coating nanoporous PP films with aconcentrated QD solution in octadecene (20mg/mL). After complete filling of the films withthe solutions, which took a few seconds, excesssolution was removed using filter paper. Then, a LC based on MLC6816 (cyclohexane derivatives, Merck) was introduced into the porous structure of the PP-QD films.
Sample 2 was prepared by filling PP with thesame QD solution and LC in octadecene followed bywashing the film with acetone and annealing itat 170°C.
Methods
Fluorescence confocal images were in thespectral range of 583–592 nm for all samples.The fluorescence spectra were recorded usingan M266 automatedmonochromator/spectrograph (SOLAR LaserSystems) with an U2C-16H7317 CCD (Ormins)and a homemade light-collecting invertedsystem using a 100X/0.80 MPLAPON lens(Olympus) and a homemade confocal unit withtwo 100-mm objective lenses, a 100-µmpinhole, and two Semrock 488-nm RazorEdge®ultrasteep long-pass edge filters (Semrock). AnLGN-519M Ar+ laser (Plazma) operating at 488nm was used for fluorescence excitation at alight intensity of 0.1 mW, as measured with aLaserMate-Q (Coherent) intensity meter. Anintegration time of 0.03 s was used forrecording confocal images. The scan area was10×10 µm (100×100 points).
AFM and upright microscopy images wereacquired using an SPM Nntegra base (NT-MDT)equipped with an Optem Zoom 125C uprightmicroscope (Qioptiq). This SPM base wascombined with the aforementioned invertedmicroscopic system, allowing us to obtain AFM,inverted microscopic, and upright microscopicimages from the same area of the sample. ForAFM images, a scan area of 8×8 µm (512×512points) and AFM cantilevers of the ETALON HAFMseries (NT-MDT) were used.
Results and Discussion
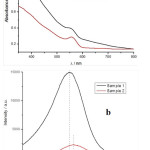
Figure 1 shows the absorbance andfluorescence spectra of the obtained samples.As seen from the figure, both samples exhibitthe light absorption and emissioncharacteristics determined by the highconcentration of QDs. The fluorescencemaximum for Sample 2 (589 nm) is red-shiftedrelative to that of Sample1 (585 nm), probably,due to energy transfer.
 |
Figure 1: The (a) absorbance and (b) fluorescence spectra of two samples. The fluorescence excitation wavelength is 532 nm. |
 |
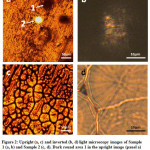
Figure 2: Upright (a, c) and inverted (b, d) light microscopy images of Sample 1 (a, b) and Sample 2 (c, d). Dark round area 1 in the upright image (panel a) is the same that in the inverted image (panel b). Bright spot 2 in the upright image (panel a) is the fluorescence excitation laser spot. |
The upright and inverted optical images of Sample 1 (Figures 2a, 2b) and Sample 2 (Figures 2c,2d) are shown in Figure 2. The most distinctivefeature of the two samples is a homogeneousopaque surface, which strongly scatters light inthe upright mode in the unannealed sample(Figure 2a). The Sample 2 surface has a domainlikestructure formed by tightly packed opticallytransparent “domains” separated by opaqueborders and is also well observed in the uprightmode (Figure 2c).
Both samples are similarly and intensely coloreddue to the embedded QDs, the coloration beingapparently uniform. They, however,significantly differ in transparency. The Sample 1 optical image obtained in the inverted mode(Figure 2b) is mostly a continuous dark field.
Sample 2 is completely transparent at the samelight intensity (Figure 2d). In this case, the innerradial structure of the domains converging tothe center and the domain boundaries areclearly visible. However, the defective, in termsof light scattering, areas of Sample 1 deservespecial attention. They are seen as dark spots inFigure 2a (area 1). A surprising fact is that thesespots are the only light (transparent) areas inthe optical images obtained in the invertedmode. The inverted image of area 1 (Figure 2a) isshown in Figure 2b. The nature of the transparentareas in Sample 1 (PP CelgardR 2500) will bestudied further, but at this point it is importantto note that the reference sample is notcompletely transparent and exhibits a very highlight scattering with no localized areas oftransparency.
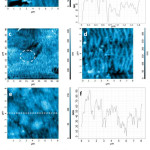
The next step in investigating the properties ofthe materials obtained (PP CelgardR 2500/QD)was to study the surface topography of thesesamples by means of AFM. The AFM images ofthe reference sample PP CelgardR 2500 (Figure 3a), Sample 1 (Figures 3c, 3d), and Sample 2 (Figure 3e) and the corresponding cross sections areshown in Figure 3. The AFM scanning direction ofall the samples coincided with the direction ofthe polypropylene matrix tension. The result ofthis location of the sample is the structure withan undulating “large” period (on average, about1 μm) related to an almost uniform rupture ofthe polypropylene matrix along the tensiondirection in all AFM images. Thus, relatively long(up to tens of micrometers) filamentarystructures about 100 nm in height and as wideas several hundred nanometers perpendicularto the scanning direction are formed (Figures 3a,3b, upper panel). There are also filamentarystructures with a “small” period (100 nm)located almost perpendicularly to those “large”structures. The “small” filamentary structuresare obviously formed by the polypropylenematrix fragments remaining after spatialseparation of the “large” filamentary structures(Figures 3a, 3b, bottom panel). Transverseparameters of the “small” filaments cannot beaccurately measured by AFM, since the aspectratio of the cantilever tip does not allow it topenetrate between them. However, we canassume that the samples have about the same3D network-like structure consisting of “large”and “small” in their bulk. The average porositycan be estimated at about 60%, assuming theaverage ratio of the “large” filament width tothe distance between the filaments to be 1/3and the same parameter for the “small”filaments to be 1/2. The porosity estimatedusing conventional techniques is close to 55% [23]. Good agreement of these values means that thebulk structure of Sample 1 generallycorresponds to the surface morphologyrevealed with AFM and consists of mutuallyperpendicular “small” and “large” filamentarystructures. This porosity value indicates thepossibility of introducing a substantial amountof a dopant (in the given case, QDs) into thematerial.
Analysis of the morphology of QD distribution inthe matrix was the next step of this study. Alarge-scale view of the Sample 1 surface isshown in Figure 3c. As seen from the figure, QDsare not distributed uniformly throughout thesample surface; instead, they form islands(marked with dashed circles in Figure 3c).Comparison of AFM images and optical imagesobtained in the upright mode shows that allregions of QD accumulation in AFM imagescoincide with dark spots in optical imagesobtained in the upright mode, such as thoseshown in Figure 2a (area 1) and areas of localtransparency in Sample 1 shown in Figure 2b. TheAFM image of area 1 (Figure 2a) of the Sample 1surface is shown in Figure 3d. Here, QDs formsubmicrometer- and micrometer-sizedagglomerates. Probably, the formation of theselarge QD agglomerates contributes to thesubstantial change in the scattering propertiesof the QD-PP-LC material without altering theoverall PP matrix morphology.
Annealing of these samples led to their contraction, with “large” filamentary structures moving close to one another up to a complete absence of intervals between them, while the filament sizes remained unchanged (Sample 2;Figures 3e, 3f). The surface structure of Sample 2did not allow us to use AFM for determining thelocation of QDs on its surface, but it did notdetect any local area of QD accumulation, whichagrees with the absence of the correspondingdefects in optical images of Sample 2 (Figure 2).Evidently, the contraction of the structure as aresult of annealing contributes to the effect ofthe QD “locking” in the PP matrix, which resultsin a flexible material with highly stablefluorescent characteristics.
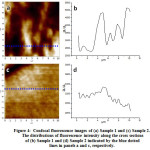
The final step of this study was to evaluate the homogeneity of the distribution of Q Dsembedded in the LC and PP matrix, as well as the effects of the washing and annealing procedures on this characteristic. Confocal fluorescence microspectroscopy was used for this purpose. Confocal fluorescent images ofSample 1 andSample 2 are shown in Figures 4a and 4c,respectively.
 |
Figure 3: (a) An AFM image of the reference PP CelgardR 2500 sample. The white dotted lines indicate cross sections. A typical but rare defect of this structure is seen in the left bottom corner. (b) The profiles of the horizontal (top) and vertical (bottom) cross sections shown in panel a. (c) Large-scale and (d) closeup AFM images of the Sample 1 area enriched with QDs (marked with a white dashed circle in panel c). (e) An AFM image of Sample 2 and (f) the profile of its cross section indicated by the white dotted line. |
 |
Figure 4: Confocal fluorescence images of (a) Sample 1 and (c) Sample 2. The distributions of fluorescence intensity along the cross sections of (b) Sample 1 and (d) Sample 2 indicated by the blue dotted lines in panels a and c, respectively. |
The fluorescence profiles of cross sections indicated by the blue dotted lines in the confocal images (Figures 4a, 4c) reflect the differences in the morphology of QD distribution in Samples 1 and 2 (Figures 4b and 4d,respectively). As seen from Figures 4b and 4d, the annealing (Sample 2) made the QD distribution in the PP matrix substantially more uniform.The total difference in fluorescence intensity within each “domain” of the structure did notexceed 10% (Figure 4d.), with QDs almost entirely absent at the domain boundaries (the upper left corner of the image in Figure 4c). Before annealing(Sample 1), the QD distribution wassubstantially less homogeneous. The total difference in fluorescence intensity (more than60%) was accounted for by numerous local in homogeneities (Figure 4b). The locations of these in homogeneities mainly coincided with the locations of dark spots in the optical images obtained in the upright mode. For example, inarea 1 (Figure 2a), the QD fluorescence intensitywas three times higher than that in area 2 (laserspot showed) with a relatively homogeneousQD distribution. It should be noted that the highly heterogeneous distribution of QD fluorescence in Sample 1 (Figure 4b) is also observed in the areas that look homogeneous under an upright optical microscope.
Thus, annealing plays an important role in the preparation of PP–QD materials, “locking” QDsin the PP matrix and substantially increasing the homogeneity of their distribution.
Conclusions
A new type of nanohybrid materials engineeredby encapsulating fluorescent semiconductorQDs into the CelgardR 2500 polypropylenematrix has been characterized with the use ofAFM and confocal microspectroscopy. It hasbeen found that stretching of the initialpolypropylene matrix resulted in the formationof mutually perpendicular “small” and “large”filamentary structures. The “large” filamentswith an average period of about 1 μm arealmost perpendicular to the stretchingdirection, whereas the “small” filaments (withan average period of about 100 nm) areoriented in an almost opposite direction.Comparison of the values of bulk porosityestimated by means of the standard techniqueand surface morphology analysis suggests thatthis filamentary structure is characteristic of thebulk PP-QD-LC material. Such a high porosityallows incorporating significant amounts of QDsinto the PP matrix. It has been found thatannealing of the PP-QD-LCnanohybrid materialleads to shrinking of the pores formed withcrossed filaments and, as a result,encapsulation of the incorporated QDs andformation of a domain-like structure. Moreover,it has been shown that annealing significantly(sixfold) increases the homogeneity of the QDdistribution within each domain.
In conclusion, it should be noted thatencapsulation of fluorescent semiconductorQDs into an annealed PP matrix yields a flexibleand stable material characterized by highlyintense and homogeneous fluorescence. Themost appropriate areas of application of suchhybrid systems are the development of sensorssystems [24-26], highly luminiscent diodes,including white light-emitting ones [11,27,28], lightconverter devices [12], and display systems [29].
Acknowledgements
This study was supported by the Ministry ofHigher Education and Science of the RussianFederation (grant no. 14.616.21.0042 IDRFMEFI61615X0042.)
References
- Lvov, Yu.;Guo, B.; Fakhrullin, R. F. (Eds.). Functional Polymer Composites with Nanoclays. RSC Publishing, 2016.
- Mark, J. E.; Lee, C. Y-C.; Bianconi, P. A. (Eds.). Hybrid Organic-Inorganic Composites. American Chemical Society, 1995.DOI: 10.1021/bk-1995-0585.fw001
CrossRef - Rogach, A. Semiconductor Nanocrystal Quantum Dots: Synthesis, Assembly, Spectroscopy and Applications. Berlin: Springer, 2008.
CrossRef - Sukhanova, A.; Venteo, L.;Devy, J.;Artemyev, M.;Oleinikov, V.; Pluot, M.;Nabiev, I. Highly Stable Fluorescent Nanocrystals as a Novel Class of Labels for Immunohistochemical Analysis of Paraffin-Embedded Tissue Sections.Lab. Invest.Brief Meth.,2002,82, 1259-1261.
CrossRef - Gugula, K.; Szydlo A.; Stegemann, L.;Strassert, C. A.; Bredol, M.Photobleaching-resistant ternary quantum dots embedded in a polymer-coated silica matrix.J. Mater. Chem. C.,2016, 4, 5263-5269.
CrossRef - Thorkelsson, M.; Nelson, J. H.;Alivisatos, A. P.;Xu, T. End-to-End Alignment of Nanorods in Thin Films.Nano Lett.,2013, 13, 4908–4913.
CrossRef - Matvienko, O. O.; Savin, Y. N.;Kryzhanovska, A. S.;Vovk, O. M.; Dobrotvorska, M. V.; Pogorelova, N. V.; Vashchenko, V. V. Dispersion and aggregation of quantum dots in polymer-inorganic hybrid films.Thin Solid Films, 2013, 537, 226–230.
CrossRef - Rünzi, T.; Baier, M. C.;Negele, C.; Krumova, M.;Mecking, S.Nanocomposites of phosphonic-acid-functionalized polyethylenes with inorganic quantum dots.Macromol.Rapid.Commun.,2015,36, 165-173.
CrossRef - Krini, R.; Ha, C. W.; Prabhakaran, P.; Mard, H. E.; Yang, D.-Y.; Zentel, R.; Lee, K.-S.Photosensitive functionalized surface-modified quantum dots for polymeric structures via two-photon-initiated polymerization technique.Macromol. Rapid Commun.,2015, 36, 1108-1114.
CrossRef - Meinardi, F.; Colombo, A.;Velizhanin, K. A.;Simonutti, R.;Lorenzon, M.;Beverina, L.;Viswanatha, R.;Klimov, V. I.;Brovelli, S. Large area luminescent solar concentrators based on “Stokes-shift-engineered” nanocrystals in mass polymerized polymethylmethacrylate matrix.Nature Photonics, 2014, 8, 392–399.
CrossRef - Kahmann, S.; Mura, A.; Protesescu, L.;Kovalenko, M. V.;Brabec, C. J.; Loi, M. A.Opto-electronics of PbS quantum dot and narrow bandgap polymer blends.J. Mater. Chem. C., 2015, 3, 5499-5505.
CrossRef - Chen, C.-J.; Lin, C.-C.; Lien, J.-Y.; Wang, S.-L.; Chiang, R.-K.Preparation of quantum dot/polymer light conversion films with alleviated Förster resonance energy transfer redshift.J. Mater. Chem. C.,2015, 3, 196–203.
CrossRef - He, X.; Tan, L.; Wu, X.; Yan, C.; Chen, D.; Meng, X.; Tang, F.Electrospun quantum dots/polymer composite porous fibers for turn-on fluorescent detection of lactate dehydrogenase.J. Mater. Chem., 2012, 22, 18471-18478.
CrossRef - Generalova, A. N.;Oleinikov, V. A.; Sukhanova, A.;Artemyev, M. V.; Zubov, V. P.;Nabiev, I. Quantum dot–containing polymer particles with thermosensitive fluorescence, Biosensor and Bioelectronics.Biosens. Bioelectron.,2013, 39, 187-193.
CrossRef - Tong, X.; Zhao, Y. Liquid-Crystal Gel-Dispersed Quantum Dots: Reversible Modulation of Photoluminescence Intensity Using an Electric Field.J. Am. Chem. Soc., 2007, 129,6372-6373.
CrossRef - Mirzaei, J.;Reznikov, M.;Hegmann, T.Quantum dots as liquid crystal dopants.J. Mater. Chem.,2012, 22, 22350-22365.
CrossRef - Bobrovsky, A.;Mochalov, K.; Oleinikov, V.;Shibaev, V. Glass-forming photoactive cholesteric oligomers doped with quantum dots: novel materials with phototunable circularly polarised emission.Liq. Cryst.,2011, 38, 737-742.
CrossRef - Bobrovsky, A.; Mochalov, K.;Oleinikov, K.;Sukhanova, A.;Prudnikau, A.;Artemyev, M.;Shibaev, V.;Nabiev, I. Optically and electrically controlled circularly polarized Emission from cholesteric liquid crystal materials doped with semiconductor quantum dots.Adv. Mater.,2012, 24, 6216-6222.
CrossRef - Bobrovsky, A.;Samokhvalov, P.;Shibaev, V. An effective method for preparation of stable LC composites with high concentration of quantum dots.Advanced Optical Materials, 2014, 2, 1167–1172.
CrossRef - Mochalov, K.E.;Efimov, A.E.;Bobrovsky, A.;Agapov, I.I.;Chistyakov, I.I.;Oleinikov, V.;Sukhanova, A.;Nabiev, I. Combined Scanning Probe Nanotomography and Optical Microspectroscopy: A Correlative Technique for 3D Characterization of Nanomaterials.ACS Nano,2013, 7, 8953-8962.
CrossRef - Bobrovsky, A.;Shibaev, V.;Elyashevitch, G.;Mochalov, K.;Oleynikov, V. Polyethylene-based composites containing high concentration of quantum dots.Colloid Polym. Sci., 2015, 293, 1545-1551.
CrossRef - Bobrovsky, A.;Shibaev, V.; Abramchuk, S.;Elyashevitch, G.;Samokhvalov, P.; Oleinikov, V.; Mochalov, K. Quantum dot–polymer composites based on nanoporous polypropylene films with different draw ratios.Eur. Polym. J., 2016, 82, 93-101.
CrossRef - Celgard product information. Date Views: 14.09.2016 http://www.ldcgm.com/Celgard/CELGA, RD-4550.pdf
CrossRef - Han, S.; Li, X.; Wang, Y.; Sub, C. A core–shell Fe3O4 nanoparticle–CdTe quantum dot–molecularly imprinted polymer composite for recognition and separation of 4-nonylphenol.Anal. Methods.,2014, 6, 2855-2861.
CrossRef - Zhou, Y.;Qu, Z.; Zeng, Y.; Zhou, T.; Shi, G. A novel composite of graphene quantum dots and molecularly imprinted polymer for fluorescent detection of paranitrophenol.Biosensors Bioelectr.,2014, 52,317–323.
CrossRef - Liu, H.; Zhou, K.; Wu, D.; Wang, J.; Sun, B. A novel quantum dots-labeled on the surface of molecularly imprinted polymer for turn-off optosensing of dicyandiamide in dairy products.Biosensors Bioelectr.,2016, 77, 512–517.
CrossRef - Min, S.-Y.; Bang, J.; Park, J.; Lee, C.-L.; Lee, S.; Park, J.-J.;Jeong, U.; Kim, S.; Lee, T.-W. Electrospun polymer/quantum dot composite fibers as down conversion phosphor layers for white light emitting diodes. RSC Adv.,2014, 4, 11585–11589.
CrossRef - Yang, Z.;Voznyy, O.; Liu, M.; Yuan, M.;Ip, A.H.; Ahmed, O.S.;Levina, L.;Kinge, S.;Hoogland, S.; Sargent, E.H. All-Quantum-Dot Infrared Light-Emitting Diodes.ACS Nano, 2015, 9, 12327–12333.
CrossRef - Wood, V.; Panzer, M.J.; Chen, J.; Bradley, M.S.;Halpert, J.E.;Bawendi, M.G.; Bulovic, V. Inkjet‐Printed Quantum Dot–Polymer Composites for Full‐Color AC‐Driven Displays.Adv. Mater.,2009, 21, 2151-2155.
CrossRef

This work is licensed under a Creative Commons Attribution 4.0 International License.


