Impedance Spectroscopy Study of Carbon Nanotube–Glass Microfiber Composites
Ivan Volkov1*, Andrey Varfolomeev1,2, Sergey Krasnoselsky1, Victor Ivanov1 and Thomas Maeder3
1Moscow Institute of Physics and Technology, Dolgoprudny, Moscow region, Russia.
2NRC Kurchatov Institute, Moscow, Russia.
3Ecole Polytechnique Federale de Lausanne, Lausanne, Switzerland.
Corresponding Author E-mail: volkov256@yandex.ru
DOI : http://dx.doi.org/10.13005/ojc/320603
The method of fabricatingcomposites composed of a glass microfiber matrix andthe conductive nanofibers is proposed. The nanofibersincorporating single-walled carbon nanotubes (SWCNTs) and an organic material are spread over the surface of glass microfibers and in some areasbetween microfibers are coupled together into a branched network. The contributions of intra-CNT and inter-CNT conduction mechanismsin the composites with different contents of SWCNTs are evaluated from the analysis of their impedance spectra.The crossover between two conduction mechanisms is observed at a content of SWCNTs of about 0.1 wt. %.
KEYWORDS:carbon nanotubes; composites; impedance spectroscopy
Download this article as:| Copy the following to cite this article: Volkov I, Varfolomeev A, Krasnoselsky S, Ivanov V, Maeder T. Impedance Spectroscopy Study of Carbon Nanotube–Glass Microfiber Composites. Orient J Chem 2016;32(6). |
| Copy the following to cite this URL: Volkov I, Varfolomeev A, Krasnoselsky S, Ivanov V, Maeder T. Impedance Spectroscopy Study of Carbon Nanotube–Glass Microfiber Composites. Orient J Chem 2016;32(6). Available from: http://www.orientjchem.org/?p=26218 |
Introduction
Carbon nanotubes (CNTs) are the unique material having great potential of application in many fields of science and technology. Structurally, CNTs can be classified as multiwalled CNTs (MWCNTs) and single-walled CNTs (SWCNTs), which differ in the number of concentric graphene layers and the tube diameter. The use of CNTs as afiller embedded into various polymer matrices is one of the most promising applications of CNTs, because they can improve and/or impart new properties even at low loadings in the composite (< 1 wt. %)1-3. Due to the exceptionally high aspect ratio of SWCNTs, they seem to be the better choice for achieving excellent electrical conductivity of polymer composites at low loadings. In addition, due to their smaller diameter, SWCNTs are much more flexible than MWCNTs and might break less during processing.
Recently, the alternative composites in which CNTs are combined with glass fibers were suggested and investigated4,5. In these composites, the local content of nanotubes is much higher than the average content in the overall material and the conduction paths are influenced by a structure of the fibrous matrix. Due to these reasons, the percolation threshold can be reduced as compared to the traditional CNTs-based polymer composites. For example, Gao, et al.5 fabricated individual glass fibers functionalized with MWCNTs. The functionalized fibers demonstrated pronounced piezoresistive effect as well as high sensitivity of dc resistance to the temperature and the humidity. Also the epoxy matrix composites containing aligned functionalized fibers exhibited ultrahigh anisotropic semiconducting properties and low percolation threshold.
Since the conductivity of CNTs-based composites depends strongly on their structure, the method of impedance spectroscopy is considered to be a useful tool forthe detailed characterization of electrical properties of such materials6,7. The most important advantage of the impedance spectroscopyas applied to composite materialsis that itenables one toseparate the contributions of conduction mechanisms associated with the charge transport within the particles (nanotubes) and between them. Note that in the case of dc measurements,the overall effect of all contributionscan be observed only.
In the present work, the composites representing glass microfiber matrix with deposited SWCNTs-based nanofibers were fabricated and studied by using the impedance spectroscopy. The content of carbon nanotubes in the composite was ranging from 0.06 to 1.1 wt. %. The impedance spectra were approximated by simulated data describing the behavior of the equivalent circuit comprising three elements responsible for the intra-CNT and inter-CNT charge transport.
Experimental
The following reagents and materials were used in the fabrication process:pristine carbon nanomaterial with the high content of SWCNTs (> 75 wt. %); sodium dodecylbenzenesulfonate (purity > 95%); polyvinyl alcohol (average molar mass 93 000 kDa, purity > 99%); concentrated nitric acid (purity > 90%); glass microfiber filter paper (borosilicate glass, GF/F grade, diameter 47 mm, thickness 0.42 mm, purchased from Whatman).
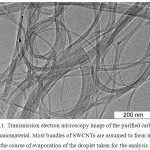
To isolate SWCNTs from the metal catalyst, the following purification procedure was carried out. One gram of pristine carbon nanomaterial was sonicated in 100 mL of concentrated nitric acid for 60 min. and then refluxed at 120°C for 12 h. The prepared solution was filtered and the precipitate was rinsed with distilled water until the pH of the filtrate was neutral. The isolated SWCNTs were dispersed in the water solution of sodium dodecylbenzenesulfonate (SDBS) by sonication8. To remove thick bundles of SWCNTs and large catalyst particles encapsulated in a carbon shell, the solution was then centrifuged at 14100 g for 60 min. Figure 1 presents the transmission electron microscopy (TEM) image of SWCNTs contained in the obtained supernatant. Then,thissupernatant was used to prepare a series of dilute suspensions with the following concentrations of SWCNTs: 0.1, 0.05, 0.04, 0.02, 0.01, 0.005 wt. %. The concentration of SDBS was about five times higher than that of nanotubes. Finally, the water solution of polyvinyl alcohol (PVA) was added to each suspensionas bonding agentso that its concentration was 0.01 wt. %.Further, one milliliter of each composite suspension was uniformly dispensed over the 30-mm area of the glass microfiber filter paper by using micropipette. As a result of filtration process, more than 90% of nanotubes were retained by microfibers within the filter paper thickness. The obtained samples were then dried at room temperature in air atmosphere for 24 h. The calculated weight content (c) of SWCNTs in the obtained samples takes the following values: 1.1, 0.6, 0.45, 0.23, 0.11, 0.06wt. %; the corresponding volume percent is a bout 10 time slower.
 |
Figure 1: Transmission electron microscopy image of the purified carbon nanomaterial. Most bundles of SWCNTs are assumed to form in the course of evaporation of the droplet taken for the analysis. |
 |
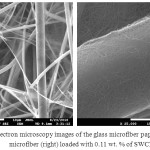
Figure 2: Scanning electron microscopy images of the glass microfiber paper (left) and its single microfiber (right) loaded with 0.11 wt. % SWCNTs. |
Results and Discussion
The structure of the fabricated materials was studied by scanning electron microscopy (SEM) with the use of JEOL JSM-7001 F. The typical SEM images of one of the samples (c = 0.11 wt. %)are presented in Fig. 2. The glass microfibers are displayed as randomly oriented cylindrical objects with the diameter in the range from 0.3 to 5μm. The deposited material is represented by nano fibers with the diameter below 50 nm, which are spread over the surface of majority of glass microfibers; in some areas between microfibers,the nanofibersare coupled together into a branched network.Due to the porous structure of such materials,good conductivity can be attained at ultra low contents of CNTs expressed in terms of volume percent. In the case under study, the dc conductivity was ranging from 0.02 S/m at 0.005 vol. % up to 26 S/m at 0.1 vol. %. These values were found to be similar to those obtained for polymer composites with aligned carbon nanotubes9.
In the composite materials, carbon nano tubes represent long conducting regions with delocalized charge carriers. Beyond CNTs, the charge transport is accomplished via hopping between neighboring CNTs. Thus, the conductivity of the composite material is determined by intra-CNT and inter-CNT conductivities. The intra-CNT conductivity is specified by the mobility and the concentration of delocalized charge carriers. The inter-CNT dc conductivity depends on the potential barriers between CNTs. Due to the inter-CNT conduction mechanism, the conduction paths in CNTs-based composites exist below the percolation threshold.It should be pointed out that the inter-CNT ac conductivity is affected by the inter-CNT capacitance as well.
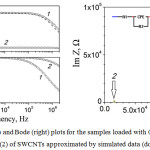
In order to evaluate the contributions of intra-CNT and inter-CNT conduction mechanisms in the fabricated materials, the method of impedance spectroscopy was utilized. The frequency dependences of impedance parameters (impedance modulus |Z| and phase angle θ) were measured at room temperature in the frequency (f) range from 20 Hz to 2 MHz at ac voltage of 1 V by means of high-precision RLC-meter Agilent E4980A. The analysis of impedance spectra was implemented by using EIS Spectrum Analyser program10. It was found that the impedance parameters of the samples with the content ofSWCNTs above 0.23 wt. % (samples with c equal to 0.45, 0.6, 1.1 wt. %) are not frequency dependent. Therefore, the impedance of such samples can be described by a single equivalent resistance, thus suggesting that the charge transport in this case is governed by the intra-CNT conductivity.
In the case of low content of SWCNTs (samples with c equal to 0.06 and 0.11 wt. %), the frequency dependences of impedance parameters are observed (Fig. 3, left). Such samples can be described by an equivalent circuit comprising R1resistor connected in series with the parallel-connected R2resistor and the constant phase element (CPE) (inset of Fig. 3, right). The impedance of CPE is represented as 1/(A·(iω)n), where i is the imaginary unit, ω = 2πf, A and n are the fitting parameters. It is known that the origin of CPE may result from the lognormal time constantdistribution11 characteristic, for example, of charge hopping process.
 |
Figure 3: Nyquist (left) and Bode (right) plots for the samples loaded with 0.06 wt. % (1) and 0.11 wt. % (2) SWCNTs approximated by simulated data (dotted line). |
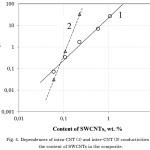
The resistances of R1 and R2correspond to the intra-CNT (σs) and inter-CNT (σp) dc conductivities of the composite, respectively.Figure 4 presents σs and σp as functions of the content (c) of SWCNTs in the composite.The steeper slope ofσp(c) dependence can be explained by the fact that, as opposed to intra-CNTconductivity, the inter-CNT oneis affectedby the probability of tunnelingof charge carriers between CNTs beingfairly strongly dependenton the distance between CNTs.The content of SWCNTs at which σsis equal toσpcan be considered as a critical value wherein the crossover between inter-CNT and intra-CNT conduction mechanisms takes place. At the same time, the inter-CNT resistivity becomes negligible and the transition to the metallic conductivity occurs at a content of SWCNTs of about 0.3 wt. %.
 |
Figure 4: Dependences of intra-CNT (1) and inter-CNT (2) conductivities on the content of SWCNTs in the composite. |
Conclusions
The composites representing glass microfiber matrix with deposited SWCNTs-based nanofibers were fabricated and studied by using the impedance spectroscopy. The crossover between intra-CNT and inter-CNT conduction mechanisms is observed at a content of SWCNTs of about 0.1 wt. %.The dc conductivity of the composite corresponding to this content of SWCNTs is about 0.2 S/m.The ultimate conductivity of 26 S/m is attained for the composite loaded with 1.1 wt. %SWCNTs corresponding to the very low volume percent of about 0.1 vol. %. Thus, the fabricated materials demonstratedhigh electrical conductivity at low loadings comparable with that of polymer composites with aligned carbon nanotubes. Due to the high flexibility and porosity, these materials hold promise for the application in piezoresistive sensors, low-power gas sensorsand as electromagnetic shielding materials.
Acknowledgements
Thisworkwassupportedbythe Ministry of Education and Science of the Russian Federation (Grant No. 14.584.21.0020, unique identifier RFMEFI58416X0020) and the Swiss National Science Foundation (Letter of decision No. IZLRZ2_163917 / 1).
References
- Bauhofer, W.; Kovacs, J.Composites Science and Technology2009, 69, 1486–1498.
CrossRef - Udmale, V; Mishra, D.; Gadhave, R.; Pinjare, D.; Yamgar, R. Orient. J. Chem.2013, 29, 927–936.
CrossRef - Hecht, D. S.; Hu, L.; Irvin G. Adv. Mater.2011, 23, 1482–1513.
CrossRef - Jin, J.; Zhang,L.; Chen,W.; Li,C.-Z.Polymer Composites2013, 34, 1313–1320.
CrossRef - Gao,S.; Zhuang,R.; Zhang,J.; Liu,J.;Mäder,E.Adv. Funct. Mater.2010, 20, 1885–1893.
CrossRef - Stassi,S.; Sacco,A.;Canavese,G.J. Phys. D: Appl. Phys.2014, 47, 1–5.
CrossRef - Khattari,Z.;Maghrabi,M.; McNally,T.; Jawad,S. A.Physica B; doi: 10.1016/j.physb.2011.12.019.
CrossRef - Islam, M. F.; Rojas,E.;Bergey, D. M.; Johnson,A. T.;Yodh,A. G.Nano Lett.2003, 3, 269–273.
CrossRef - Souier,T.;Maragliano,C.;Stefancich,M.; Chiesa,M. Carbon2013, 64, 150–157.
CrossRef - www.abc.chemistry.bsu.by/vi/analyser/
- Lasia,A. Electrochemical impedance spectroscopy and its applications,in Modern Aspects of Electrochemistry (Springer US, New York)1999, eds. Conway,B. E.;Bockris,J.;WhiteR. E.

This work is licensed under a Creative Commons Attribution 4.0 International License.


