Adsorptive Cathodic Stripping Voltammetric Method with Alizarin for the Simultaneous Determination of Cadmium, and Zinc in Water Samples
Deswati*, Hilfi Pardi, Hamzar Suyani and Rahmiana Zein
Department of Chemistry, Faculty of Mathematics, and Natural Science, andalas University, Kampus Limau Manis, Padang 25163, Indonesia.
*Corresponding Author E-mail : deswati_ua@yahoo.co.id
DOI : http://dx.doi.org/10.13005/ojc/320628
This paper reports on the development of adsorptive cathodic stripping voltammetric (AdCSV) method with 1,2-dihydroxyanthraquinone or Alizarin (AZ) as a complexing agent used in the simultaneous determination of ultra trace of Cd and Zn because it has a good sensitivity, and selectivity. The influence of several parameters was studied: the effects of 1,2-dihydroxyanthraquinone or Alizarin (AZ) concentration, pH, accumulation potential, and accumulation time. The relative standard deviation (RSD), and recovery is determined to get the accuracy and precision method. It also determined the limit of detection (LOD) of the method to get the sensitivity. In this case, the optimum conditions were AZ concentration of 0.5 mM, pH 5, step deposition (70 s, -0.5 V). This method has been applied in water samples successfully, was obtained (Cd 23, and Zn 124) µg/L, LOD (Cd 0.006, and Zn 0.004) µg/L, RSD (Cd 0.4, and Zn 1.4) % (n = 10), recovery (Cd 99.36, and Zn 99.28)%. The Atomic absorption spectrometric (AAS) method is used as a comparison AdCSV optimum, was obtained (Cd 16, and Zn 115) µg/L.
KEYWORDS:adsorptive cathodic stripping voltammetric method; simultaneous; ultra trace; Alizarin; sensitivity; and selectivity
Download this article as:| Copy the following to cite this article: Deswati D, Pardi H, Suyani H, Zein R. Adsorptive Cathodic Stripping Voltammetric Methodwith Alizarin for the Simultaneous Determination of Cadmium, and Zinc in Water Samples. Orient J Chem 2016;32(6). |
| Copy the following to cite this URL: Deswati D, Pardi H, Suyani H, Zein R. Adsorptive Cathodic Stripping Voltammetric Methodwith Alizarin for the Simultaneous Determination of Cadmium, and Zinc in Water Samples. Orient J Chem 2016;32(6). Available from: http://www.orientjchem.org/?p=25331 |
Introduction
Heavy metals can be divided into two types. The first type is essential heavy metals, in which its presence in a certain amount is needed by living organisms, but in excessive amounts can cause toxic effects. Examples of heavy metals including Zn, Cu, Fe, Co, and Mn. The second type is a heavy metal is not essential, where its presence in the body is still not known benefits, such as Hg, Cd, Pb, and Cr. The presence of heavy metals in the environment or in the body can cause very serious poisoning despite being in very low concentrations1.
Cadmium is a toxic metal commonly found Yang hearts industrial jobs, cadmium ion is used intensively hearts operate battery manufacturing process and electroplating. Zinc is metals important for life and an estimated 20% of the world population at risk of zinc deficiency. Symptoms occur due zinc levels exceed the threshold limit body hearts like abortion, teratology, preterm growth, mental retardation, immune body yang low, dermatitis, yang abnormal neuropsychological functions, and other disorders
Atomic absorption spectrometry (AAS)2, inductively coupled plasma mass spectrometry (ICP-MS)3 or cold vapor atomic fluorescence spectrometry (CVAFS)4 is a method frequently used for determination of heavy metal. However, this method is expensive for the operation, maintenance costs are quite expensive and less practical but also can not measure very small levels of metal ions5. Therefore, we need an alternative method that can overcome the limitations of methods6-9.
In recent years, a sensitive and selective method for the determination of heavy metals such as Cd and Zn is in need. Adsorptive cathodic stripping voltammetry (AdCSV) was selected as such a method, because it has the advantage of a linear dynamic range of 4-5 orders of magnitude, the limit of detection ng/L to µg/L, low cost for running the instrument6-11, 15-16, allows standard addition (no matrix effects), high selectivity for metal ions to form a complex and at the time of pre-concentration of the complex will accumulate on the surface of the electrode17-19.
The AdCSV method not only determined metal total, but a species of heavy metals is also determined20-21. In addition, this method can determine the metal ions in seawater 7, and heavy metals can be determined in a solution of high chemical compounds that (accumulation step) short 22-23 made AdCSV the most favorite than the other methods 24.
Simultaneous determination of Cd, and Zn metals have been conducted by AdCSV using complexing agent : Xylenol orange (XO)25, 4-amiono-5-methyl-2,4-dihydro-3H-1,2,4-triazole-3-tion (MMTT)26, N-Nitroso-N-phenylhydroxylamine (Cupferron)27, 5-phenyl-1,2,4-triazole-3-tion (PTT)28. Alizarin (AZ) is a natural dye, and chelating agent, the which has been used successfully in the stripping voltammetric determination of some metals including, Cu(I), and Cu(II)29, Zn30, Mo31, Al(III)32, In(III)33. The occurrence of metal ion complexes with AZ and reduction process occurs at the electrode surface is shown in Figure 1.
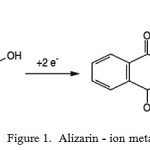 |
Figure 1: Alizarin- ion metal complex |
The present study describes a sensitive, and selective AdCSV with AZ for simultaneous determination of ultra trace of Cd and Zn metal ions. The parameters studied were: the effects of AZ concentration, pH, deposition step. Determination of the RSD, and recovery to get precision, It also was determined the LOD get the sensitivity of each metal ion. The voltammetric obtained analytical results were validated in use for the simultaneous determination of Cd and Zn in water samples and comparing with an AAS method.
Experimental Section
Instrument
AdCSV were carried out with 797 AV computerize (Metrohm, Herisau, Switzer, and) in connection with Dell computer, and controlled by (VA competence 2.0) control software. Stripping voltammograms were obtained via a Hewlett–Packard laser jet printer. A conventional three-electrode system was used in the hanging mercury drop electrode (HMDE) mode. This three-electrode system was completed by means of a platinum auxiliary electrode, and an Ag/AgCl (3M KCl) reference electrode. Atomic absorption spectrometric determination of Cd and Zn metal ions were achieved by Varian Flame Atomizer (Model 240). The pH was measured with Metrohm 744 pH meter. Oxford adjustable micropipette (Ireland) was used to pipette microliter volumes standard solutions, and glassware commonly used in the laboratory.
Material
The materials used for this study were acetate buffer,ammonia buffer, AZ, HNO3, Standard solutions of Cd 1000 mg/L, Standard solutions of Zn 1000 mg/L, N2 gas, doubly distilled water, Whatman filter paper, and water samples taken with the added HNO3 with comparison HNO3: sample = 1: 1000.
Work procedures
Getting optimum conditions each metal ion Cd, and Zn in trace amounts AdCSV method with alizarin necessary to determine parameters such as the effects of AZ (0.1 – 0.9) mM, pH (2-9), step deposition (30 -100) s and -0.2 to -1.0) V, accumulation potential (-0.2 to -1.0) V, and accumulation time (30-100) s. The RSD, recovery, and limit of detection (LOD) for precision. The procedure was used in this study according to a previously reported6-9.
Results and Discussion
Figure 2 shows AdCSV voltammograms of the (Cd, and Zn) – AZ without the addition of AZ undetectable. (Cd, and Zn) – AZ produce peak current (-0.72, and -0.98) V were measured under the conditions of time and accumulation potential (70 s, -0.5 V), pH 5 (acetate buffer). This shows AZ have an important role to improve the selectivity and sensitivity of the AdCSV method for the simultaneous determination of Cd and Zn metal ions in very small amounts.
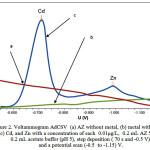 |
Figure 2: Voltammogram AdCSV (a) AZ without metal,(b) metal without AZ,(c) Cd, and Zn with a concentration of each 0.01μg/L, 0.2 mL AZ5 mM, 0.2 mL acetate buffer (pH 5),step deposition (70s and -0.5 V), and a potential scan (-0.5 to -1.15) V. |
The Effects of AZ
Varying the concentration of AZ as a complexing agent also to be determined in the investigated stripping voltammetric procedure. Figure 3 indicates that an increase is of AZ concentration from (0.1- 0.9) mM, and the peak current increases in the AZ concentration (0.1 – 0.5) mM, however, decreased flow AZ (0.6 – 0.9) mM.
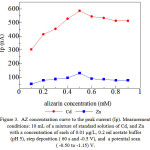 |
Figure 3: AZ concentration curve to the peak current(Ip). Measurement conditions: 10mL of a mixture of standard solution of Cd, and Zn with a concentration of each of 0.01 μg/L, 0.2 ml acetate buffer (pH 5), step deposition (60s and -0.5 V), and a potential scan ( -0.50 to-1.15) V. |
The peak current and the resulting from the reduction of metal – ligand complexes are adsorbed on the surface of the working electrode on the stripping step. (Cd, and Zn) – AZ increased peak flows at an AZ concentration (0.1-0.5) mM showed accumulation of metal-ligand on the surface of the electrode in the deposition phase (pre-concentration). AZ (0.6-0.9) mM concentration decreased peak current, which is caused by competition between the free ligand (Cd, and Zn) – AZ to stick to the surface of the electrode as well as high concentrations of AZ that will cause difficult Cd and Zn is reduced so that the peak current to be down. For the concentration of 0.5 mM AZ was selected for further determination of the optimum conditions by AdCSV.
The Effects of pH
The stability of (Cd, and Zn)-AZ formed influenced by pH, shown in reaction6–9:
(a) decomposition step :
Mn+ + nL → MLn
MLn → MLnads
(b) Stripping step :
MLnads + ne → M0 + nL
The formation of (Cd, and Zn) – AZ maximum required pH optimum. The results showed that the peak current (Cd, and Zn) – AZ increase from pH (2-5), and decrease from pH (6-9). At low pH, there is an excess of protons the resulting in competition with metal ions to form a bond with the ligand so that the the resulting current low, while at a pH greater than the pH optimum peak current decline due to OH – ions so that metal ions can form hydroxide, and will settle on the electrode surface that is difficult to remove10. For the pH of 5 is used to determine the optimum conditions AdCSV with AZsubsequent.
pH plays a role in increasing the number of complex compounds or ion association formed in the process of adsorption on the electrode HMDE that would effect the formation of a complex, complex stability, and absorption properties34. Effect of pH on peak current (Cd, and Zn) – AZ complex studied using acetate buffer, and ammonia buffer, with measurement conditions the concentration of Cd, and Zn metal ions 0.01 ug/L with AZ 5mM, deposition potential – 0.7 V, and deposition time 60 s, respectively.
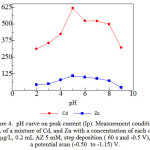 |
Figure 4: pH curve on peak current (Ip). Measurement conditions: 10 mL of a mixture of Cd, and Znwith a concentration of each of 0.01µg/L, 0.2 mL AZ5 mM,step deposition (60s and -0.5 V), a potential scan (-0.50 to -1.15) V. |
The Effects of Deposition Time
Figure 5 shows plots AdCSV with alizarin versus deposition time. Deposition step (deposition time and potential) is the stage of pre-concentration which can increase sensitivity of stripping voltammetric methods34-35.
Figure 5 shows plots AdCSV with alizarin versus deposition time. Deposition step (deposition time and potential) is the stage of pre-concentration which can increase the sensitivity of stripping voltammetric methods34-35.
Deposition time for (Cd, and Zn) – AZ for conditions of AZ concentration of 0.5 mM, pH 5 and deposition potential – 0.5 V. Shows an increase of up to 70 s, and this is because not the equilibrium of the reaction on the electrode surface and after 70 s no increase in peak current, it is because there has been an adsorptive equilibrium on the electrode surface, deposition time 70 s43 used AdCSV for the determination of optimum conditions with AZ next.
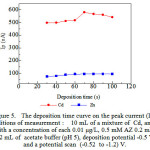 |
Figure 5: The deposition time curve on the peak current (Ip), Conditions of measurement : 10 mL of a mixture of Cd, and Zn with a concentration of each 0.01µg/L, 0.5 mM AZ 0.2 mL, 0.2 mL of acetate buffer (pH 5), deposition potential -0.5 V, and a potential scan (-0.52 to -1.2) V. |
The Effects of Deposition Potential
Figure 6 shows plots AdCSV with alizarin versus deposition potential for a concentration of each 0:01 ug / L, with AZ 0.5 mM, and pH 5. When the adsorption of formed (Cd, and Zn) – AZ complexes were measured as a function of deposition potential (-0.2 to -1.0 V) at 60 s collection time, it was observed that peak current increased slightly when applying -0.5 V as the optimal accumulation potential.(Cd, and Zn)-AZ peak current highest accumulation potential obtained at -0.5 V,on a more positive potential than -0.5 V peak currents low due to the complex process of deposition on the surface of the working electrode has not reached the maximum, while the accumulation potential more negative than optimum potential analyte complex reduction process occurs during the deposition process takes place so that the peak current is obtained decreasing10. Deposition potential -0.5 V optimum selected for each as a condition for AdCSV with AZ.
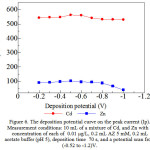 |
Figure 6: The deposition potential curve on the peak current (Ip). Measurement conditions: 10 mL of a mixture of Cd, and Zn with a concentration of each of 0.01µg/L, 0.2 mL AZ5 mM, 0.2 mL acetate buffer (pH 5), deposition time 70 s, and a potential scan from (-0.52 to -1.2)V. |
Relative Standard Deviation
The precision AdCSV with AZ can be determined by calculating the relative standard deviation (RSD) 6-9, of the results of the determination of 0:01 mg/L standard solution of (Cd, and Zn)-AZ (n = 10) with optimum conditions AdCSV, obtained ( 0.4, and 1.4)%. Based on the AOAC method RSD <15% 36-37, shows AdCSV withAZ good precision.
Recovery
Recovery is a measure that indicates the degree of closeness of the analyst with the actual analyte concentration. In principle, the accuracy is measured by applying a number of quantitative components tested in the sample matrix, then testing to determine the return of the components tested. In this study, the test recovery is done by analyzing of Cd and Zn in water samples. The results of the recovery of Cd and Zn using AdCSV method with AZ, obtained was (99.36, and 99.28)%, respectively. Results of recovery based on the AOAC method (70-125) % showed good results, so this method has high accuracy 36-37.
Interference Studies
The influence of the addition of other metals in the analysis of Cd and Zn studied in order to determine the selectivity of the method AdCSV with AZ. Based Table 1, all ions tested as spam ion effect at 10 mg/L, this is because the ions form a complex and participate bullies come attached to the electrode surface , thereby decreasing the peak current of Cd and Zn.
Table 1. Maximum tolerance of interfering ion
|
Ions |
Tolerance limit (mg/L) |
|
| Cd | Zn | |
| Na+, Al+, Ca+, Li+, K+, Ba2+, Cr+3, Co2+, Ni2+, Cl–, F–, Br–, SO42-, I– | 10 | 10 |
| Cu2+ | 10 | 10 |
| Pb2+ | 10 | 10 |
| Cd2+ | – | 10 |
| Zn2+ | 10 | – |
| Fe3+ | 1 | 10 |
Application
The AdCSV with AZ can be used for the determination of Cd and Zn in tap water. The results presented in Figure 7. To eliminate matrix effects, were used the standard addition method6-10
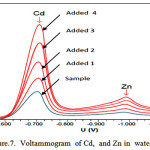 |
Figure 7: Voltammogram of Cd, and Zn in water samples. |
In order to validate the practical reliability of the optimized AdCSV method, water samples were analyzed Cd, and Zn contents by the recommended voltammetric procedure Table 2. Comparing the analytical results obtained by AdCSV method with Obtained by AAS method for the same water samples. As can be seen from Table 2, the concentration of Cd and Zn in water samples with both methods compared with29 statistical t-test. the critical value (2,776) at the 95% confidence level (P = 0,05), n = 3, so the absence of significant differences between the two methods. In Figure 2 can be seen the determination of Cd and Zn with AdCSV can be done simultaneously, while the AAS was calculated separately for each metal ions38-41.
Table 2: Cd, and Zn content in water samples, and comparison with the results obtained by AAS technique
|
Sample (tap water) |
AdCSV(µg/L) | AAS(µg/L) | Pairedt-test value |
| Cd(II) | 23±9 | 16±10 | 0.9012 |
| Zn | 134±12 | 115±15 | 2,0066 |
Limits of Detection (LOD)
In Table 3 can be seen, a comparison LOD of the simultaneous determination of Cd, and Zn between AdCSV method using AZ by various methods voltammetry already has been done. From research conducted the LOD(Cd 0.006, and Zn 0.003 µg/L). when compared with the method that has been done AdCSV method using AZ lower LOD, lower RSD, and recovery is close to 100% so that adsorptive cathodic stripping voltammetric method more sensitive, and selective than the method has been done for the determination of Cd, and Zn metal ions (Table 3).
Table 3: RSD (%), LOD (µg/L), and Recovery (%) of Cd, and Zn between AdCSV with AZ by various methods voltammmetry already been done.
|
Determination method |
Complexing agent | RSD (%) | LOD (µg/L) |
Recovery (%) |
Ref | |||
|
Cd |
Zn |
Cd |
Zn |
Cd |
Zn |
|||
| Differential Pulse Cathodic Adsorptive Stripping Voltammetric | 4-amiono-5-methyl-2,4-dihydro-3H-1,2,4-triazol-3-tion (MMTT) | 3.1 | 2.9 | 1.7 | 1.3 |
94.7 |
97 |
25 |
| Differential Pulse Cathodic Adsorptive Stripping Voltammetric | Xylenol Orange (XO) | 1.98 | 1.55 | 1.7 | 1.8 | 98.2 | 97.2 | 26 |
| Differential Pulse Cathodic Adsorptive Stripping Voltammetric | N-Nitrozo-N-phenylhydroxylamine (Cupferron) | 2.1 | 1.8 | 0.092 | 0.058 | 93.2 | 98 | 27 |
| Differential Pulse Cathodic Adsorptive Stripping Voltammetric | 5-phenyl-1,2,4-triazol-3-tion (PTT) | 2.4 | 2.6 | 1.1 | 1.6 | 98 | 97.3 | 28 |
| Differential pulse anodic stripping voltammetry/bismuth film electrodes | – | – | – | 0.6 | 0.5 | – | – | 42 |
| Differential Pulse Cathodic Adsorptive Stripping Voltammetric | 1,2-dihydroxyanthraquinone,or Alizarin (AZ) | 0.4 | 1.3 | 0.006 | 0.003 | 99.36 | 99.28 | This work |
Conclusion
It can be concluded that optimized experimental conditions include:AZ concentration 5 mM, pH 5, deposition step (70 s and -0.5 V), relative standard deviation (Cd 0.4, and Zn 1.3%), recovery (Cd 96.36, and Zn 99.28%). The optimum conditions then applied to water samples, obtained by AdCSV (Cd 23, and Zn 134 μg/L), by AAS technique (Cd 16, and Zn 115 μg/L). Adsorptive cathodic stripping voltammetric method shows a sensitive, and selective for determination of ultra trace of Cd, and Zn metal ions.
Acknowledgement
We would like to thank to Ministryof Research, Technology, and Higher Education,which has funded this study,in accordance with the Agreement Implementation of research Leading Universities No : 46/H.16/UPT/LPPM/2016, February 24, 2016. .
References
- Arab S; andAlshikh A. J. American.Sci. 2010,6, 1026-1023.
- Durkalec,M;Szkoda,J;Kolacz,R;Opalinski,S;Nawrocka,A;Zmudzki, J.Int. J. Environ. Res.2015, 9, 205-212.
- Montes-Bayon, M; DeNicola, K; Caruso, J.A. J. Chromatogr. A. 2003, 1000, 457-476.
CrossRef - Zhang,Y; Adeloju,S.B.Talanta 2015, 137, 148-155.
CrossRef - Richard, J.C; Martin, J; Milton, T.Trend in Anal. Chem.,2005, 24(3), 266 – 274.
- Deswati; Suyani, H; Safni. Indones. J. Chem, 2012, 12(1) : 20-27.
- Deswati; Suyani, H; Safni; Loekman, U; Pardi, P. Indones. J. Chem., 2013, 13(3), 236 -241.
- Deswati; Munaf, E; Suyani, H; Zein, R; Pardi, H. Asian J. Chem., 2015, 27(11) : 3978-3982.
- Deswati; Munaf, E; Suyani, H; Loekman, U; Pardi, H. . Res. J. Pharm.Biol. Chem Sci.,2014, 5(4): 990-999.
- Deswati; Amelia, L; Suyani, H; Zein, R; Jin, J. Rasayan J. Chem, 2015,8(3): 362-372.
- Gholiv, and, M.B; Sohrabi, A; Abbasai, S. Electroanalysis. 2007,19, 319-322.
- Deswati; Izzati Rahmi HG; Suyani, H; Zein, R; Alif, A. Oriental J. Chem., 2016, 32(3) : 1493-1502.
- Izzati Rahmi HG; Deswati; Suyani, H; Zein, R. Res. J. Pharm. Biol. Chem. Sci., 2016,7(3) : 673-682.
- Deswati; Rahmi, I; Suyani, H; Zein, R; Alif, A. Rasayan J. Chem., 2016, 9(1) : 8-17.
- Suhendrayatna, Heavy Metal Bioremoval by Microorganism: A Literature Study, Synergi Forum PPI Tokyo Institute of Technology, Tokyo, 2001.
- Richard, J.C., Martin, J; Milton, T.Trend in Anal. Chem.,2005, 24(3), 266 – 274.
- Ensafi, A.A; Abbasi, S; Mansour, H.R. Anal.Sci., 2001, 17, 609-612.
CrossRef - Shahryar, A; Bahirae, A;Abbasai, F. Food Chem., 2011, 129(3), 1274-1280.
CrossRef - Zang, S; Huang, W. Anal.Sci., 2001,17, 983-985.
CrossRef - Jugade, R; Joshi, A.P. Anal.Sci., 2006, 22, 571-574.
CrossRef - Gholiv, and, M.B; Pourhossein, A;Shahlaei, M. Turki J. Chem., 2011, 35, 839-846.
- Proti, P.Introduction to modern voltammetric , and polarographic analysis techniques, AmelElectrochem., Ed. IV, 2001.
- Amini, M.K;Kabiri, M. J. Iran Chem.Soc., 2005, 2, 32-39.
CrossRef - Herrero, E ;Arancibia, V; Rojas–Romo, C. Anal.Electroanal.Chem., 2014, 729, 9-14.
CrossRef - Ensafi, A.A; Benvidi; Khayamian, T. Anal. Letters, 2005, 37(3), 449-462.
- Shemirani, F; Rajabi, M. Canadian J. Anal.Sci., and Spectr., .2004,13, 42-52.
- Abbasi, S; Farmany, A , and Mortazavi, S.S. Electroanal., 2010, 22(24), 2884-2888..
CrossRef - Shemirani, F; Rajabi, M; Asghari, A; Milani-Hosseini, S.M.R. Canadian J. Anal. Sci. , and Spectr., 2005,50(4), 175-181.
- Cass, andra, R; Cordeiro1, B; Aldaléa, L; Br, andes Marques, I; Edmar, P.M; Willia, S; Cardoso, I;Jiujun, Z. .Int. J.Electrochem.Sci., 2006, 1, 343-353.
- Alghamdi, A.H. J. Saudi Chem.Soc., 2010, 14(1) , 1–7.
CrossRef - Tyszczuk, T;Korolczuk, M. Anal.Chem.Acta, 2008, 624, 232–237.
CrossRef - Wang, L; Chen, R; Wen, S; Zhu, J. Anal.Chem., 1987,15, 118–122.
- Zhao, J.Z; Sun, D,Z Liu, D.J. FenxiHuaxue1996, 24, 101–103.
- Palar, H. Heavy metalcontamination , and toxicology, Rinekacipta, Jakarta, 2012.
- Abbasi, S; Atousa, B; Freshteh, A. Food Chem., 2011, 129(3), 1274-1280.
CrossRef - AOAC Guidelinesfor Single Laboratory, (Http://www.aoac.org/Official Methods/slv guidelines.pdf),19/12/2002.
- Miller, J.C; Miller, J.N.Statistics for Analytical Chemistry. Ellis Horwood, New York, 1994.
- Saryati, Stripping Voltammetry, Proceedings of the National Seminar Electrochemistry, PTBIN-BATAN, 2001.
- Adrian W. Bott, Current Separations, 1995, 14(1): 24-30.
- Peterson W. M., Wong, R., , and Princeton G., Applied Research, Electrochemistry Product Group,Copenhagen, 1991.
- Florence, T.M. J.Electroanal.Chem., 1984, 168: 207-218.
CrossRef - Bernardellia, J.K.B; Lapollib, F.R; Gomes, C.M; da Silva; J.B.. Floriano Mat. Res., 2011, .14(3): 366-371.
- Shams, E., Babaei, A., Soltaninezhad, M., AnalyticaChimicaActa., 2004,.501: 119-124.
CrossRef

This work is licensed under a Creative Commons Attribution 4.0 International License.


