Dispersive Liquid-Liquid Microextraction and determination of Platinum(IV) by High Performance Liquid Chromatography
Ali Mazloomifar* and Pegah Shiekhi
Department of chemistry, Faculty of Science, Yadegar-e- Imam Khomieni(RAH) Branch, Islamic Azad University, Tehran, Iran Correspondence Author Email : mazloomifar@yahoo.com
DOI : http://dx.doi.org/10.13005/ojc/310306
Article Received on :
Article Accepted on :
Article Published : 01 Aug 2015
A simple, rapid, and efficient procedure, dispersive liquid-liquid microextraction (DLLME), has been developed for the extraction and preconcentration of platinum (IV) in environmental water samples. The factors relevant to the microextraction efficiency, such as the kind and volume of extraction and dispersive solvent, the extraction time, the pH in aqueous, and the salt effect, were optimized. Under the optimum conditions , the enrichment factor of this method for platinum was reached at 119. The detection limit for platinum was 0.3 ng mL-1 , and the relative standard deviation (RSD) was 0.42% (n = 10 , C = 10 ng mL-1). The method was successfully applied to the determination of trace amounts of platinum in environmental water samples.
KEYWORDS:Dispersive liquid – liquid microextraction; Platinum; High performance liquid – liquid chromatography
Download this article as:| Copy the following to cite this article: Mazloomifar A, Shiekhi P. Dispersive Liquid-Liquid Microextraction and determination of Platinum(IV) by High Performance Liquid Chromatography. Orient J Chem 2015;31(3). |
| Copy the following to cite this URL: Mazloomifar A, Shiekhi P. Dispersive Liquid-Liquid Microextraction and determination of Platinum(IV) by High Performance Liquid Chromatography. Orient J Chem 2015;31(3). Available from: http://www.orientjchem.org/?p=10143 |
Introduction
Platinum is a metal used mainly in jewelry, electrical contacts, dentistry, laboratory equipment and vehicle emission control devices. Ingestion and other exposures to the chemical can cause various symptoms. The type and severity of symptoms varies depending on the amount of chemical involved and the nature of the exposure. The toxicological effects of platinum in humans are confined to certain of its complex halide salts and to the antitumour agent cis-platin and its analogues. The adverse health effects of the halide salt complexes are characterized by sensitization; these compounds are among the most potent sensitizers known.1,2
The analytical methods of platinum usually involves in using ICP-MS 3,4, ICP-AES 5, FAAS 6, GFAAS 7, spectrophotometric.8 High performance liquid liquid chromatography (HPLC) is suitable for the determination of trace levels of platinum. However, despite its sensitivity, it is necessary to include a preconcentration step due to the low levels present in water samples. Several methods have been developed for this, including solid-liquid extraction9-11 and hollow fiber liquid phase microextraction (HF-LPME).12
In recent years, several microextraction methods involving amounts of organic solvents have been applied for preconcentration purposes: cloud point extraction13,14, single drop microextraction (SDME)15,16, homogeneous liquid-liquid microextraction (HLLME), 17,18 and dispersive liquid- liquid microextraction (DLLME.19-21 The aim of this work is to combine DLLME with HPLC and develop a new procedure for determination of trace platinum in waters. In this method , 1-(2-pyridylazo)-2naphthol (PAN), which forms complexes with more metal ions and has found numerous applications in separation and preconcentration by LLE 22, HF-LPME 23, SPE 24 and CPE 25 methods, was selected as chelating reagent. The factors influencing the efficiency of DLLME extraction and HPLC determination were studied. The procedure was successfully applied to determine trace amounts of Pt (IV) in water samples.
Materials and Method
Instrumentation
The HPLC used in this work was Agilent 1200 (Agilent technologies Co., USA) and consisted of UV-Vis photometric detector, a Zorbax Eclipse XDB-C18 column ( 4.6 mm diameter, 150 mm length, 5 µm macropore size and 13 nm mesopore size) from Agilent ( Agilent technologies Co., USA), was used for separation. The mobile phase was methanol – buffer optimized on ( 80: 20 v/v) was delivered by Agilent HPLC pump. The flow rate of the mobile phase was 0.8 mL/min and the UV- Vis photometric detection wavelength was set at 660 nm.
Reagents and Samples
Analytical reagents grade acetone, methanol, ethanol, carbon tetrachloride, acetic acid, sodium acetate , ammonium chloride, ammonia from Merck Co. (Darmstadt, Germany). These compound were all HPLC grade. 1-(2-pyridylazo)-2-naphthol (PAN) and hexachloroplatinic acid ( H2Pt Cl6. 6H2O) were obtained from Merck Co. (Darmstadt, Grmany).
A platinum standard solution ( 1000 mg L-1) was prepared from H2PtCl6. 6H2O in pure water, from which working standard solutions were obtained by dilution. The 1.0 mol L-1 solution of PAN was prepared by dissolving the compound in ethanol. Working standard solutions were obtained by dilution with water.
Buffer solution 0.1 mol L-1 of acetate-acetic acid and 0.1 mol L-1 of ammonium chloride-ammonia were used for the experiment.
General procedure
100 µL of a 1.0 mmol l-1 PAN solution and 1 mL of acetate- acetic acid buffer solution were added to a 10 mL glass tube containin 5 mL of a sample solution of platinum ( 10 ng mL-1). To this solution, acetone (600 µL) as a dispersive solvent containing 60 µL carbon tetrachloride as an extraction solvent was rapidly injected into the solution using as syring. A cloudy solution (water/acetone/carbon tetrachloride) was formed in the extraction vessel. In this step, the platinum-PAN complex in water sample was extracted into the fine droplets of carbon tetrachloride. The mixture was then centrifuged for 5 min at 4000 rpm. After this process, the dispersed fine droplets of carbon tetrachloride were collected in the bottom of the tube (42 µL). Using a chromatographic syringe, 20 µL of this sedimented phase were injected into HPLC.
Results and Discussion
Optimization method
Parameters and practical considerations affecting the DLLME procedure are as follow.
Effect of pH value
The effect of pH value in aqueous phase on the extraction is examined and showed in Fig. 1. In the pH range from 3-6, maximum extraction of platinum occurs and the peak area is found to be constant. A acetate-acetic acid duffer of pH 4.70 is employed for the following experiments.
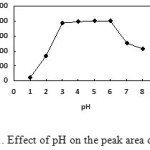 |
Figure1: Effect of pH on the peak area of platinum. Click here to View figure |
Effect of PAN concentration
PAN was a good chelating agent for platinum extraction. Enough PAN was needed to assure that platinum would be extracted completely. Therefore, concentration of PAN was investigated between o.10 mmol L-1 – 2.0 mmol L-1. Fig. 2 exhibited that when the concentration of PAN was up of 0.80 mmol L-1, platinum would extracted completely, and with the increase further of the PAN concentration, the extraction efficiency had no significant increase. Therefore, 1.0mmol L-1 of PAN was used in the subsequent experiments.
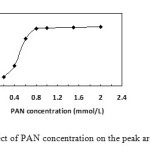 |
Figure2: Effect of PAN concentration on the peak area of platinum. Click here to View figure |
Selection of the extraction solvent
The selection of an appropriate solvent is a major factor for DLLME. It should be higher density than water and have extraction capability of the interested compounds and low solubility in water. In this study, chloroform (CHCl3), dichloromethane (CH2Cl2), carbon tetrachloride (CCl4), and carbon disulfide (CS2) were selected extraction solvents. A series of sample solutions was extraction by using 1.0 mL methanol involving 100 µL of each extraction solvent. The results illustrated in Fig.3 indicated that maximum extraction occurs by using carbon tetrachloride. Carbon tetrachloride was selected for the further studies.
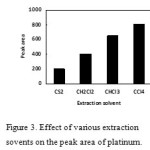 |
Figure3. Effect of various extraction sovents on the peak area of platinum. Click here to View figure |
Selection of the dispersive solvent
In DLLME procedure, the kind of dispersive solvent play important role in enrichment of analytes. Miscibility of a disperser with organic phase and aqueous phase is the most important point for the selection of dispersive solvent. Therefore, methanol, acetone, acetonitrile, and ethanol, which have this ability. Using 1.0 mL of each dispersive solvent containing 100 µL carbon tetrachloride as an extraction solvent. The results were exhibited in Fig. 4. As can be seen, maximum extraction of platinum occurs by using acetone. Therefore, acetone is selected as a dispersive solvent in the following studies.
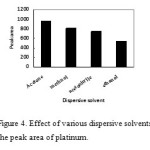 |
Figure4: Effect of various dispersive solvents on the peak area of platinum. Click here to View figure |
Effect of the extraction solvent volume
To examine the effect of the extraction solvent volume, experiments involving different volumes of carbon tetrachloride were done with the same DLLME procedure. The experimental conditions were fixed; 1.0 mL acetone containing different volumes of CCl4 ( 40, 50, 60, 70, 80, 90 and 100 µL). Fig.5 depicts the extraction efficiency versus volume of extraction solvent for target analyte. As can be seen, the peak areas increased with the increasing volume of extraction solvent from 40 µL to 60 µl. The increase of peak areas were due to the increase of volume of carbon tetrachloride which can dissolve more platinum complex. The peak areas decreased with increasing volume of extraction of 60 µL to 100 µL. This decrease may be due to the dilution effect of increased CCl4 volumes. Therefor, 60 µL carbon tetrachloride was used.
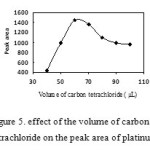 |
Figure5: effect of the volume of carbon tetrachloride on the peak area of platinum. Click here to View figure |
Effect of dispersive solvent volume
In DLLME procedure, the volume of dispersive solvent is another important factor to be considered. To study the effect of dispersive volume on the extraction efficiency, all experimental conditions were fixed except volume of acetone (0.10, 0.20 ,0.30, 0.40, 0.50, 0.60, 0.70, 0.80 0.90 and 1.0 mL) containing 60 µl CCl4). The results were exhibited in Fig. 6. When the volume of acetone was small, carbon tetrachloride could not be dispersed completely and cloudy solution could not form. On the other hand, in the high volumes of acetone ( over 600 µl), solubility of platinum complex in water increases, therefore , the extraction efficiency decreased because of distribution coefficient decreasing. A 600 µL volume was chosen as an optimum volume for disperser.
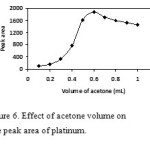 |
Figure6: Effect of acetone volume on the peak area of platinum. Click here to View figure |
Effect of the extraction time
In this experiment, extraction time was another parameter for DLLME procedure. The effect of extraction time was examined in the range of 2 – 20 min while the other experimental conditions remained constant. The results are shown in Fig. 7. According to the obtained results, extraction efficiency of platinum increased when the extraction time was changed from 2 to 8 min. But after 8 min, the efficiency showed not changing. The optimized extraction time was 8 min.
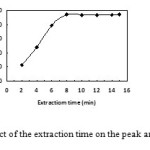 |
Figure7: Effect of the extraction time on the peak area of platinum. Click here to View figure |
Effect of the centrifugation time
The centrifugation time was optimized between 1 to 10 min. The results were exhibited in Fig. 8. According to the obtained results, extraction efficiency of platinum increased when the centrifugation time was changed from 1 to 5 min. But after 5 min, the efficiency showed not changing. A 5 min time was chosen as an optimum centrifugation time.
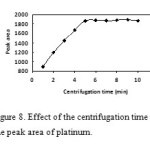 |
Figure8: Effect of the centrifugation time on the peak area of platinum. Click here to View figure |
Effect of Salt
The effect of increasing ionic strength of aqueous phase on the performance of DLLME was investigated by adding NaCl ( 0 – 10% w/v) into the sample while the other conditions were kept constant. The results are presented in Fig. 9. The results showed that salt addition has no considerable effect on the extraction efficiency. Hence the further studies were performed in the absence of salt.
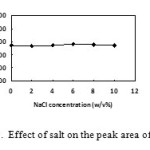 |
Figure9: Effect of salt on the peak area of platinum. Click here to View figure |
Analytical performance
The analytical performance of DLLME coupled with HPLC for the preconcentration and determination of platinum from environmental samples was systematically investigated under optimized experimental conditions. The calibration curves equations in Table 1 were obtained under the optimized conditions. Linearity was observed over the range 1.0 – 100 ng mL-1 ( r2=0.997). The linear range (LR) was obtained by generally accept manner in which the lower limit of the LR is LOQ (S/N=10) and the upper limit is a concentration in which 5% deviation from the linear status is observed. The precision of this method was 0.42% (RSD, n=10) at spiked concentration of 5 ng mL-1. The detection limit, based on S/N of 3, for platinum was 0.3 ng mL-1. The enrichment factor of proposed method for platinum was 119–fold.
Table1: Quantitative characteristic of the presented method
| Calibration curve equation |
LOD (ng/mL) |
LOQ (ng/mL) |
Linear dynamic range (ng/mL) |
Square of correlation coefficient (r2) |
Preconcentration factor |
|
A=1067.3C + 11240 |
0.3 |
1.0 |
1.0 – 100 |
0.997 |
119 |
Effect of coexisting ions
The one of the main problem in the determination of the heavy metal ions is interference from matrix components. Therefore, a series of experiments have been designed using a standard solution of 10 ng mL-1 platinum under the above optimized conditions. The results were given in table 2. The obtained results indicated that the presence of large amounts of cation and anion including Na+, K+, Mg2+, Ca2+, NO3–, and SO42- had no obvious influence on the preconcentration of the platinum.
Table2: Effect of coexisting ions
| coexisting ions |
Concentration ratio |
Enrichment( RSD%) |
| Na+ |
1000 |
98(0.45) |
| K+ |
1000 |
98.5(0.95) |
| Ca2+ |
1000 |
97.0(1.2) |
| Mg2+ |
1000 |
94.4( 1.8) |
| Ag+ |
500 |
96.2(2.2) |
| Zn2+ |
200 |
102(2.6) |
| Cu2+ |
300 |
94.3(1.7) |
| Cd2+ |
100 |
92.2(2.2) |
| Cl– |
1000 |
103(2.5) |
| SO42- |
500 |
97( 1.2) |
| NO3– |
1000 |
98.0(1.1) |
Analysis of real water samples
The method was applied on tap water and waste water for the trace determination of platinum (IV). The results were given in table 3.
Table3: The results from real water samples.
| Environmental samples |
Spiked (ng/mL) |
Recovery% (RSD%) |
| Tap water |
– 10.0 |
<LOD 95.3(1.30) |
| Waste water |
– 10.0 |
<LOD 93.0 ( 2.62) |
Conclusions
The present work has demonstrated that DLLME may be utilized for the extraction of platinum from water sample. DLLME coupled with HPLC was successfully applied to the determination of platinum (IV) in water sample. In comparison with other microextraction methods and acoording to the obtained results, this extraction technique requires very little aqueous sample solution, organic solvent. In addition to above mentioned advantages of DLLME, it does not require special approaches and so it is very simple, rapid, and easy to use.
Acknowledgement
The author the research council at Yadegar-e – Imam Khomeini (RAH) Branch, Islamic Azad University for financial support.
References
- Hunter, D.; Milton, R.; Perry, KMA. Br J Id Med. 1945, 2, 2–98.
- Ward, J.M.; et al. Cancer treatment reports 1976, 60, 1675–1678.
- Perry, B.J.; R.E. Balazs, R.E. Anal. Proc. 1994, 31, 269-271.
- Dai, X.; Koeberl, C.; Froschl, H. Anal. Chim. Acta 2002, 1436, 79–85.
- Kovacheva, P.; Djingova, R. Anal. Chim. Acta 2002, 464, 7–13.
- Merdivan, M.; Aygün, R. S. ; Külcü, N. Atomic spectroscopy 1997, 18, 122-126.
- Bosch Ojeda, C.; Sanchez Rojas, F.; Cano Pavon, J.M. Food Control 2006, 17, 365-369.
- Johnson, L. D.; Ayres, G. H. Anal. Chem. 1966, 38, 1218-1221.
- Gao, J.; Hu, G. ; Kang, J. ; Bai, G. Talanta 1993, 40, 195–200.
- Gao, J.; Hu, G.; Kang, J.; Fan, H.; Bai, G. Talanta, 1994, 41, 541-546.
- Gao, J.; Peng, B.; Fan, H.; Kang, J.; Wang, X. Talanta, 1997, 44, pp.837-842.
- Yong, S. ; Chen, Y. ; Kooi Lee, T. ; Kee Lee, H. Talanta, 2014, 126, 163-169.
- Ohashi, A.; Ito, H.; Kanai, C.; Imura, H.; Ohashi, K. Talanta, 2005, 65, 525-530.
- Mustafina, A.; Elistratova, J.; Burilov, A.; Knyazeva, I.; Zairov, R.; Amirov, R.; Solovieva, S.; Konovalov, A. Talanta, 2006, 68, 863–868.
- Choi, K.; Kim, J.; Chung, DS. Bioanalysis, 2011, 3, 799-815.
- Batlle, R.; Nerı́n, C. J. Chromatography A, 2004, 1045, 29–35.
- Hosseini, M. H.; Asaadi, P. Rezaee, M.; Rezaei, M. R.; Pourjavi, M. R. ; Arabieh, M.; Abhari, A. A. Chromatographia, 2013, 76, 1779-1784.
- Hosseini, M. H.; Rezaee, M.; Akbarian, S.; Mizani, F.; Pourjavid, M. R.; Arabieh, M. Anal.Chim. Acta, 2013, 762, 54-60.
- Zgoła-Grześkowiak, A.; Grześkowiak, T. TrAC Trends in Analytical Chemistry 2011, 30, 1382–1399.
- Cabarcos, P.; Ángel Cocho, J.; Moreda, A.; Míguez, M.; Jesús Tabernero, M.; Fernández, P. ; María Bermejo, A. Talanta, 2013, 111, 189-195.
- Mazloomifar, A. Internatioanal J. of Analytical Chemistry 2013, 2013, 1-4.
- Watanabe, H.; Tanaka, H. Microchimica Acta , 2014, 181, 1455-1461.
- Chen, H.; Han, J.; Wang, Y.; Hu, Y.; Liu, Y.; Kang, W.; Liu Y. Microchimica Acta 2014, 181, 1455-1461.
- Narin, I.; Soylak, M. Talanta 2003, 60, 215-221.
- Tang, AN.; Jiang, DQ.; Yan XP. Anal. Chim. Acta 2004, 507, 199-204.

This work is licensed under a Creative Commons Attribution 4.0 International License.


