Study of Some Alkanes Thermodynamic Parameters Using New Liquid Crystals Containing Sulfur as Stationary Phases
Mebrouk Djedid1, Mokhtar Benalia1, Fouad Ferkous2, Asma Boudaoud 1, and Ammar Hani Al-Dujaili3
1Department Process Engineering, University of Laghouat, Algeria. 2Faculty of Chemistry, University of Annaba, Algeria. 3Department of chemistry, University of Burdwan.
DOI : http://dx.doi.org/10.13005/ojc/310214
Article Received on :
Article Accepted on :
Article Published : 25 Apr 2015
Most of the synthesized compounds which have liquid crystalline character in their composition comprise aromatic molecules. Furthermore there are few jobs that replace this type of molecules by inhomogeneous molecules that have LC character. We will replace the aromatic rings by units of 1,3,4-oxadiazole and study the effects of these new components of the transition temperatures and the Thermodynamic characteristics of n- alkanes in these two LC's phases. have been investigated by inverse gas chromatography. The transition temperatures obtained by GC are in good agreement with those found by DSC. The results are interpreted in terms of parameters “b” and related thermodynamic quantities.
KEYWORDS:Mesogenic compounds; Azo groups; n-Alkanes; Thermodynamic parameters; Liquid crystals; Inverse gas chromatography
Download this article as:| Copy the following to cite this article: Djedid M, Benalia M, Ferkous F, Boudaoud A, Al-Dujaili A. H. Study of Some Alkanes Thermodynamic Parameters Using New Liquid Crystals Containing Sulfur as Stationary Phases. Orient J Chem 2015;31(2). |
| Copy the following to cite this URL: Djedid M, Benalia M, Ferkous F, Boudaoud A, Al-Dujaili A. H. Study of Some Alkanes Thermodynamic Parameters Using New Liquid Crystals Containing Sulfur as Stationary Phases. Orient J Chem 2015;31(2). Available from: http://www.orientjchem.org/?p=8587 |
Introduction
The azo compounds are highly colored and have been used as dyes and pigments. Recently, azo metal chelates have also been poind attention due to their interesting electronic and geometrical features in connection with their application for molecular memory storage, nonlinear optical elements and printing systems. 1
The development of liquid crystal science technology has led to the preparation and study of numerous mesogens in particular; thermotropic liquid crystals 2-3. Most thermotropic liquid crystals are rod-like molecules having a rigid core composed of two or more aromatic rings and one or more terminal chains. Azo is a linking group used in connecting two core groups. Though it provides a stepped core structure, it maintains molecular linearity and hence providing higher stability and enabling mesophase formation 4- 5. Several studies have been conducted on azoesters owing to their interesting properties and considerable temperature range 6.The different substituents residing at the other end along the long molecular axis of the mesomorphic compounds have been known to either promot or suppress the mesomorphic properties 7, 8.
One of the typical terminal moiety exhibiting liquid crystal properties is those with terminal electronegative moiety, such as halogen groups. Terminal substituents as (OCH3, CH3) are polar groups possess strong dipole moments which promote mesomorphic properties 9, the increased of dipole moment can enhance the stability of transition temperatures 10, which makes them interesting for its LC applications GC 11; 12. Moreover, in designing new liquid crystals, it is of primary importance to attach mesogenic units which are thermally stable even at elevated temperatures 13; 14.
The IGC is presented as a useful method for the examination of physicochemical properties of various materials. The idea of this method was presented in many books 15 – 18 and papers 19 – 20. The term “inverse” indicates that the material of interest is placed in a chromatographic column and the behaviour of carefully selected test solutes is studied.
Retention parameters and the shape of chromatographic peak of these solutes are affected by the nature and the magnitude of interactions between them and the examined material. Theoretical substantiation that applies IGC to find out thermodynamic parameters of dissolution of organic substances in the calamitic LC phases was given by Martire and co-workers 21 – 22.
The aim of this paper is to compare the transition temperature using the parameter ‘b’ with those found by DSC and to study the evolution of thermodynamics values of homologous series of some n-alkanes in two liquid crystalline stationary phases synthesized for this work and therefore the influence of their terminal groups on these thermodynamic parameters.
Experimental
Reagents used for the synthesis of the two liquid crystals were of great analytical purity and were obtained from Fluka (Steinheim, Germany), Aldrich (Steinheim, Germany) and BHD Laboratory Reagents (Poole, UK). Volatile aromatic compounds were purchased by Meyreau-Beiveau (France). The synthesis of the two liquid crystals phases was realized by successive reactions of condensation starting from the p-aminobenzoic acid according to the reaction pathway represented in Scheme. 1.
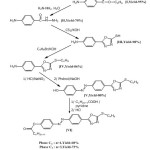 |
Scheme1: Synthesis and structures of the two liquid crystals.
|
Infrared Spectroscopy (IR)
The IR spectra are recorded with a Perkin Elmer FT-IR 1720 x 289. The spectra are measured on KBr pellets.
Nuclear Magnetic Resonance (NMR)
The NMR spectra are recorded on a Bruker AMX- 400 (400 MHz for 1H-NRM, 100 MHz for 13C-NRM). The measurement frequency and the solvent are specified between parentheses in each case. Deuterated solvents are used as the internal standard.
The multiplicity of the signals for 1H-NRM, is expressed by the following abbreviations: s (singlet), d (doublet), t (triplet), q (quartet), quint. (quintet), sext. (sextet), m (multiplet).
Polarized Light Microscopy (POM)
Observations are performed using a microscope equipped with a Zeiss Axioscope heating stage Linkam THMS 600 controlled by a Linkam 93 case.
Differential Scanning Calorimetry (DSC)
DSC measurements are performed in a cell measuring METTLER DSC 822. The calibration is checked before each series of measurements with a sample of indium (F = 156.6 °C, ∆Hf = 28.45 kJ/mol). The samples are analyzed in crucibles 40 L aluminum m under helium atmosphere and under a nitrogen stream. Speeds Heating and cooling is 10 °C/min. A measurement consists of three sets of heating and cooling. The transition temperatures are determined by the tangent method (“onset”) in the second heating and the transition enthalpies are data by integrating the peaks.
Gas chromatography (GC)
The glass capillary columns are made of borosilicate glass. They are coated by the method known as ‘‘static technique’’ used for the impregnation of the stationary phase on the inner glass wall. After treatment of the internal glass surface by sodium chloride deposit, this wall is then deactivated by polyethylene glycol impregnation (PEG) then conditioned by heating. The stationary phase is then impregnated on the internal wall of the column by flushing of a solution of the liquid crystal in dichloromethane under nitrogen pressure. The solvent (dichloromethane) is then evaporated and finally the columns are conditioned during 8 h in the gas chromatograph oven from 60 to 175 °C with a heating rate of 2 °C.min-1.
The IGC has been used to study phase transitions in the two liquid crystals. This method has shown that transition temperatures between all of the various mesophases can be detected and their temperatures measured with an accuracy and precision comparable to that of more conventional techniques. Table 1 shows the name of the two synthesized liquid crystals used as stationary phase. The first glass capillary column was prepared by impregnation of the liquid crystal (phase C1), and the second glass capillary column was also prepared by impregnation of the liquid crystal (phase C3).
The used columns have dimensions of 30 m length and 0.25 mm internal diameter. The impregnation was carried out by the static method (using a carbon tetrachloride solution). Gas chromatography measurements were performed on an Auto System XL Perkin Elmer gas chromatograph equipped with:
- A split-splitless manual injector at 250 °C, in split mode (split ratio: 50)
- A flame ionization detector at 250 °C
- An Okidata Microline 320 printer
- Argon as carrier gas.
For determination of the transition temperatures and thermodynamics parameters, the n-alkanes were injected on column A and column B. The injections were performed isothermally with temperature intervals of 2 °C from 100 to 170 °C
The experimental gas chromatography conditions are listed below:
- Injector temperature: 250 °C
- Detector temperature: 250 °C
- Carrier gas: argon with a flow rate of 1.38 ml.min-1
- Hydrogen flow rate: 25 ml.min-1
- Air flow rate: 250 ml.min-1
- Pressure inlet: 3.4 psi
The theoretical plates numbers calculated for the two capillary columns packed with the synthesized liquid crystals are comparable; largest values are found in the nematic phase.
Results and Discussion
Synthesis and Characterization
Physical and spectral data of synthesized the two stationary phases:
Scheme. 2 Phase (C1): 5-[4-(p-carboxymethylephenyle) azophenyle]- 2-butyle thio-1,3,4-oxadiazol
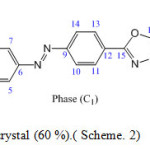 |
Scheme2: Orange liquid crystal (60 %).( Scheme. 2) Click here to View scheme |
Orange liquid crystal (60 %).( Scheme. 2)
IR (KBr); υ (cm-1): 3053 (CH aro.), 2950–2990 (C-H alph.), 1770 (C=O), 1600–1450 (C=C aro.), 1230 (N=N), 1175 (C-O oxadiazole), 820 et 650 (sub. para aro.), 660 (C-S).
1H-NMR (CDCl3 .400 MHz); δ(ppm)
0.90 (t, 3H, J = 8.0 Hz; H-20), 1.44 (m, 2H; J = 8,0 Hz; H-19), 1.66 (m, 2H; J = 7.1 Hz, H-18), 2.28 (s, 3H, H-1), 3.10 (t, 2H; J = 7.1 Hz; H-17), 7.49 (dd, 2H; J = 1.5Hz; J = 7.5 Hz, H-4, H-8), 7.97 (dd, 2H; J = 1.5 Hz; J = 7.5Hz, H-5, H-7), 8.06 (dd, 2H; J = 1.5 Hz; J = 7.5 Hz, H-10, H-14), 8.17 (dd, 2H; J = 1.5 Hz; J = 7.5 Hz; H-11, H-13)
13C-RMN (CDCl3, 100 MHz); δ (ppm)
13.40 (1C; C-20), 20.30 (1C; C-1), 21.60 (1C; C-19), 32.40 (1C; C-18), 36.10 (1C; C-17), 121.90 (2C; C-4; C-8), 123.40 (2C; C-5, C-7), 124.50 (2C; C-10, C-14), 128.30 (1C; C-12), 130.30 (2C; C-11, C-13), 149.50 (1C; C-6), 152.70 (1C; C-9), 153.50 (1C; C-3), 163.62 (1C; C-15), 164.50 (1C; C-16), 169.00 (1C; C-2).
Anal. Calcd for C20H20N4O3S: C, 61.51 %; H, 5.00 %; N, 13.77 %.
Found: C, 60.60 %; H, 5.05 %; N, 14.14%.
Scheme. 3.Phase (C3): 5-[4-(p-butyryloxyphenyl)- azophenyl]-2-butylthio-1,3,4-oxadiazole
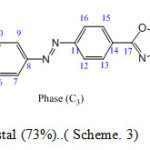 |
Scheme3: Orange liquid crystal (73%)..( Scheme. 3) Click here to View scheme |
IR (KBr); υ(cm-1): 3050 (CH aro.), 2990-2950 (CH alph.), 1810 cm-1 (C=O ester), 1640 (C=N), 1600-1450 (C=C aro.), 1220 (N=N), 1150 (C-O, oxadiazol), 840 et 690 (sub. para aro.), 660 (C-S).
1H-NMR (CDCl3, 400 MHz); δ(ppm)
0.85 (t, 3H; J = 8.0 Hz; H-1), 1.19 (t, 3H; J = 8.0 Hz; H-22), 1.45 (m, 2H; J = 7.1 Hz; H-21), 1.51 (m, 2H; J = 7.1 Hz; H-2), 1.95 (m, q, 2H; J = 8.0 Hz; H-20), 3.10 (t, 2H; J = 7.1 Hz; H-19), 4.15 (t, 2H; J = 7.1 Hz; H-3), 6.90 (dd, 2H; J = 1.5 Hz; J = 7.1 Hz; H-6, H-10), 7.75 (dd, 2H; J = 1.5 Hz; J = 7.1 Hz; H-7, H-9), 7.95 (dd, 2H; J = 1.5 Hz; J = 7.5 Hz; H-12, H-16), 8.45 (dd, 2H; J =1.5 Hz; J = 7.1 Hz; H-13, H-15).
13C-RMN (CDCl3, 100 MHz); δ (ppm)
13.40 (1C; C-22), 13.50 (1C; C-1), 18.40 (1C; C-2), 21.60 (1C; C-21), 32.40 (1C; C-20), 35.70 (1C; C-3), 36.10 (1C; C-19), 121.9 (2C; C-6, C-10), 123.4 (2C; C-7, C-9), 124.50 (2C; C-12, C-16), 128.30 (1C; C-14), 130.3 (2C; C-13, C-15), 149.50 (1C; C-8), 152.70 (1C; C-11), 153.50 (1C; C-5), 164.70 (1C; C-17), 166.50 (1C; C-18), 172.30 (1C; C-4),
Anal. Calcd for C22H24N4O3S: C, 62.26 %; H, 5.66 %; N, 13.20 %.
Found: C, 62.26 %; H, 6.39 %; N, 13.98 %.
DSC, POM, GC
Table 1 shows the characteristic parameters of the phase transitions (C1) and (C3). The analysis of the data reveals that there are no significant differences between the data of DSC, POM and GC.
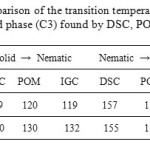 |
Table1: Comparison of the transition temperatures (°C) of phase (C1) and phase (C3) found by DSC, POM and IGC.
|
The comparison of the values of transition temperatures, obtained from reported DSC and POM and GC (Table 1), shows that they are in good agreement.
Table 2 to give each of the prepared materials, the nature of the observed transition, the corresponding transition temperature, the enthalpy changes and entropy determined by DSC.
The Retention Model
The primary datum in IGC is the parameter “b” which is the slope of the logarithm of retention times (TR’) of n-alkanes homologue series as a function of their carbon atoms number (n) by Eq.1 23.
Log (TR’) = (b´n) + a………..…………….…..…… (Eq.1)
Both compounds exist in a nematic state. Temperatures corresponding to both solid to nematic and nematic to isotropic transitions were determined by gas chromatography on the curve (Fig. 1) showing the variations of the ‘b’ parameter of the n-alkanes series in function of the inverse absolute temperature (1/T)
The parameter “b” of the data (Fig 1) at temperatures in the solid range, in the nematic range and the isotropic range of the tow liquid crystals as solvent, shows a clear discontinuity at the mesophases transition temperature; the transition temperatures are nearly then obtained by DSC and POM (Table 2).
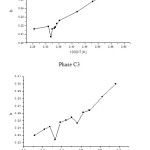 |
Figure1: Variation of the ‘b’ in function of inverse absolute temperature (1/T) for phase (C1) and phase (C3)
|
The specific retention volume, Vg°, the volume of carrier gas at standard temperature and pressure per gram of stationary phase required to elute the probe. This is related to the probe retention time, TR, by Eq.2 of Littlewood et al. 15, 24 – 26.
Vg° = 273.15 J (TR – TM) DS / wS*TC………….. (Eq.2)
Where TM is the retention time of the methane marker; TC, column temperature; Ds, the carrier gas flow at the outlet of the column; J is the correction for gas compressibility and Ws the mass of stationary phase on the column.
The correction factor for gas compressibility is given in terms of the column inlet and outlet pressures, pi and po respectively by Eq.3 27, 28.
J = 3/2*[((Pi/P0)2 – 1)/ ((Pi/P0)3 – 1)]…………..… (Eq.3)
It was shown some years ago by Everett29, Vg° could be related to the thermodynamics of the probe-stationary phase interaction by Eq.4 6, 7, 30, 31.
γ∞ = 273.15 R / (Vg°*MS*P°) …………………….. (Eq.4)
Where γ∞ is the molar activity coefficient of the probe at infinite dilution; Ms is the molecular mass of the stationary phase, P° is the vapor pressure of the pure gaseous solute at column temperature, calculated using the Antoine’s equation and constants 32, 33.
The activity coefficients at infinite dilution for some of probes in stationary phases (C1) and (C3) as function of temperature are shown in Figure 2.
From the results presented in this work, it cannot be inferred that the discontinuity observed in the solid-to-nematic transition would also occur in the nematic-to-isotropic transition. Following the model of Chow and Martire 34 of the thermodynamic of solution of the probe that will be governed by a number of effects which contribute to the deviation from ideal solution behaviour and so γ∞ and ∆G∞; Differences in interaction energies between the probe and LC will lead to a potential energy contribution. Weaker probe-LC interactions relative to those in the pure components will give a ∆H∞ positive and increase γ∞. Similarly, ∆H sol in these cases would be expected to be less negative than a case where the components interacted strongly.
Dissolution of the probe would lead to a negative ∆S sol but the additional order imposed by a mesophase structure would restrict the vibrational, rotational and conformational degrees of freedom of the probe. Thus, a less negative ∆S∞ and positive ∆H∞ would be expected in the LC phases, these would also raise the value of γ∞. The size difference between the components would lead to a small volume of mixing effect (except in the polymer phases where it may be more substantial) leading to a small negative ∆S∞, but this will generally be lower than the other factors. However, the enthalpic and entropic contributions cannot be considered separately. A strong interaction will induce ordering of the probe and consequently restrict its movement, reducing the entropy so that the energetic and structural factors are interrelated. The figure 2 shows the activity coefficient also increases as chain length.
As the temperature increased, the activity coefficient for an each probe in each phase decreased, indicating that mixing was endothermic. In general, the values of ln γ∞ are positive so the measured activity coefficients, calculated using equation (4), were greater than unity (i.e. γ∞ > 1) indicating that positive deviations from Raoult’s Law and the lack of strong attractive interactions between the components. Thus, our results for this LCs suggest that the model which predicts that γ∞ should be higher in the nematic phase is applicable, as has been found in most other systems that have been investigated 35, 36.
The change in properties at each mesophase of the transition is clear; this was emphased through the ability of distinction of IGC technique in which the changes in the structures of the stationary phases are very small. As with stationary phase (C1), the activity coefficients reflect the change in stationary phase order as well as the temperature effect since the trend is γ∞ (Solid) and γ∞ (Nematic) > γ∞ (Isotropic).
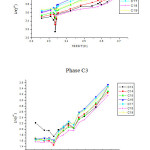 |
Figure2: Variation of logarithm of the solute activity coefficients at infinite dilution (ln γ∞) in function of the inverse absolute temperature (1/T) in phase (C1) and (C3).
|
However, the activity coefficients at all temperatures are lower than those exhibited by phase (C3) so that phase (C1) has a greater affinity for the probes due to the larger alkyl fragment in the LC. This behaviour is comparable to that observed in other LC systems 37, 38.
Thermodynamics of Interaction
The partial molar excess Gibbs free energy (∆G∞) is related with activity coefficient, and also at the enthalpy and entropy, ∆H∞ and ∆S∞, by Eq.5 and Eq.6 39.
∆G∞ = RT ln γ∞ = ∆H∞ – T∆S∞……………..……… (Eq.5)
∆H∞ = R [(ln γ∞) T2-(ln γ∞)T1]/[(1/T2)-(1/T1)]…… (Eq.6)
The discussion of the properties of the LC’s will be given in terms of the activity coefficient (i.e. ∆G∞) and its enthalpic and entropic contributions. The ∆H∞ and ∆S∞ represent the hypothetical transfer at infinite dilution of probe molecules from an ideal solution to the real solution. Thus, these quantities can be used to compare the behaviour of an individual probe between the different mesophases.
The Gibbs free energy of solution (∆Gsol) is related to the Vg° 40 and also enthalpy and entropy (∆Hsol and ∆Ssol) of the probe in the stationary phase by Eq.7 41 – 43.
∆Gsol = RT ln Vg° = ∆Hsol – T∆Ssol ……………..… (Eq.7)
The term ∆Hsol, largely connected at differences in potential energy, indicate that the energetic term is the dominant contribution.
Before considering the results for the stationary phases in detail, some general comments regarding trends in the results are appropriate.
The enthalpy changes accompanying transitions between phases and mesophases were shown to be small 44 so that the different behaviour in each mesophase is governed by differences in probe – LC interactions and not by the changing LC – LC interactions. In addition, there is a concern that absorption of the probe will modify the LC behaviour of the stationary phase. The use of infinite dilution condition reduces mitigates against this, and the excellent agreement of mesophase transition temperatures measured for a range of LC’s by IGC and other methods show demonstrates that any modification of behaviour is not significant.
Indeed, Chow and Martire demonstrated that in families of probes such as a homologous series of n-alkanes, there is a linear relation between ∆Hsol and ∆Ssol. Thus, the overall values of the thermodynamic parameters are a complex function of these factors; the values also contain a contribution from LC – LC interactions, but this will be the same throughout.
The major difference between stationary phases (C1) and (C3) is that the methylene groups extend the alkyl chain.
The results of the partial molar excess enthalpies, entropy and properties of the solutions listed for probes in phases (C1) and (C3) in Tables 3, 5. But the results of the free energy differences (ΔG∞) at infinite dilution for probes for phase (C1) and (C3) are shown in Tables 4, 6.
The excess entropies values in Tables 3 and 5 for the all alkanes were negative all the mesophases of the two phases. Thus, ∆S∞ is negative in the nematic phase and small as a result of the weaker interactions.
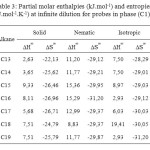 |
Table3: Partial molar enthalpies (kJ.mol-1) and entropies (J.mol-1.K-1) at infinite dilution for probes in phase (C1)
|
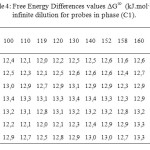 |
Table4: Free Energy Differences values ∆G∞ (kJ.mol-1) at infinite dilution for probes in phase (C1).
|
Consideration of the partial molar excess enthalpy values in Tables 3, 5 shows that there is little variation across the probes in the phases (C1), (C3), the results for the alkanes were higher, indicating that interactions were weaker. The excess entropies for the all alkanes were small and negative, presumably as a result of the weaker interactions.
Review of enthalpy values partial molar excess in Tables 3, 5, shows that there is little variation between the probes; the results for alkanes were higher, indicating that the interactions were weaker. Excess entropies for all alkanes were small and positive, probably due to the weak interactions.
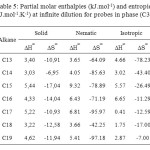 |
Table5: Partial molar enthalpies (kJ.mol-1) and entropies (J.mol-1.K-1) at infinite dilution for probes in phase (C3) Click here to View table |
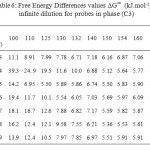 |
Table6: Free Energy Differences values ∆G∞ (kJ.mol-1) at infinite dilution for probes in phase (C3) Click here to View table |
In the nematic phase, the values of ΔH∞ to a single probe were more positive and higher than the isotropic phase and the solid phase indicates that the interaction is weaker. This may be a result of the nematic order to restrict the conformation of the probe and prevent adopt its optimal interaction. However, relatively weak interactions due ΔS∞ values require less restriction of movement of the probe such that its translational entropy is lower. Thus negative ΔS∞ is in the nematic phase.
ΔH∞ values were more positive than in one of the phases of the two stationary phases, but are very high in the nematic phase, indicating that the probe LC strong interactions occur within this mesomorphic phase. Instead, the values of ΔS∞ that were negative are the least positive, indicating that the probe undergoes restricted conformations and movement.
The solid phase, nematic and isotropic exhibit identical to those observed in the two stationary phases (C1), (C3). Again, the enthalpic contributions are paramount in determining behavior.
The enthalpic contributions are predominant in determining the behaviour. Although the coefficient γ∞ follow a definite trend with the molecular order of the stationary phase, the same is not true for the enthalpies and the entropies. The values were lower (i.e. more negative or less positive) than in either of the other phases of the stationary phase (C1), indicating that the strongest probe -LC interactions occur in the stationary phase (C3).
Correspondingly, ∆S∞ was also the least negative suggesting that the probe suffers restricted motion and conformations.
To compare trends between the probes, values ΔHsol, ΔSsol ΔGsol and will be considered for the reasons mentioned above.
For whatever reason, in phase (C1) and (C3), small and positive solute partial molar excess enthalpies and negative solute partial molar excess entropies were obtained.
These results corroborate earlier finds 51, 52 that solutes are incompatible with both the nematic and isotropic phases of liquid crystals. Excluding the systems of the solutes studied except C18 in phase (C1), all the probes in the remaining solute-liquid crystalline system studied followed the general trends, where the subscripts I and N refer to the isotropic and nematic phases, respectively:
(∆H¥)I < ( ∆H¥) N ; (∆S¥) I < (∆S¥)N
Which were also exhibited in the nematic and isotropic, by similar systems of solutes in the RCB 45, ROCB 46 and series of the p-cyanophenyl p-n-alkylbenzoates 37.
The partial molar solution values for phase (C3) listed in Table 9. The results showed that the partial molar solution values of enthalpies and entropies are all negatives. The results of ∆G sol of solution for probes in phase (C3) were given in Table 10. Consideration of the ∆H sol and ∆S sol shows that the results for the n-alkanes are similar to those for stationary phase (C1) (Table 7 ) and in those longer chains that result in larger potential energy interactions and greater restrictions on the probe molecule.
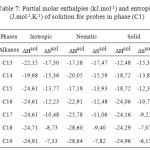 |
Table7: Partial molar enthalpies (kJ.mol-1) and entropies (J.mol-1.K-1) of solution for probes in phase (C1) Click here to View table |
The highest values of ∆H sol and ∆S sol occur in the Solid phase while those of the nematic and isotropic phases are very similar. This reflects the degree of order within the Solid phase. The probe has to enter the layered structure and also has restricted mobility; hence it loses more entropy compared with a lower order phase. In doing so, it is able to interact more effectively with the stationary phase.
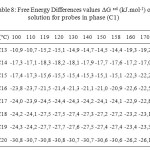 |
Table8: Free Energy Differences values ∆G sol (kJ.mol-1) of solution for probes in phase (C1) Click here to View table |
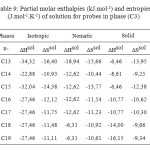 |
Table9: Partial molar enthalpies (kJ.mol-1) and entropies (J.mol-1.K-1) of solution for probes in phase (C3) Click here to View table |
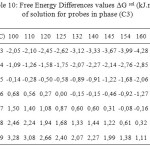 |
Table10: Free Energy Differences values ∆G sol (kJ.mol-1) of solution for probes in phase (C3) Click here to View table |
The Free Energy Differences values ∆G sol (Table 10), were of a similar magnitude to phase (C1) (Table 8) and generally considerably higher than those reported for phase (C3), again indicating that the mesogen was governing the solution behaviour.
Conclusion
This paper has illustrated some of the fundamental measurements that have been made on a range of LC systems with the aim of fully characterising their behaviour. Results for phase (C1) and phase (C3) showed many similarities between the two LC’s. However, the major difference between stationary phases (C1) and (C3) is that the methylene group extends the alkyl chain and this resulted in more favourable in formation of solution.
The gas chromatography technique was successfully applied to determine the transition temperatures in liquid crystals and the thermodynamic properties of the two phases such as the values of the parameters which suggest that “b” and fraction activity coefficients at infinite dilution are good for the two LC’s. The observed values are in good agreement with those found by DSC.
The thermodynamic molar values at infinite dilution showed an endothermic effect and are in the mesophase higher than in the isotropic region. On the other hand, the values calculated for phase (C1) with a methyle substituent are greater than those obtained for phase (C3) with a ethyle group. The nematic and isotropic, solid phases exhibit identical trends to those seen in stationary phase (C1). Again, the enthalpic contributions are predominant in determining the behaviour.
This work forms one the basis of the design and rationalisation of LC stationary phases for analytical purposes, and related publications will deal with the separation properties of these and related LC compounds.
References
- Shukla, H. M., Shah, A. I., Shah, P. J. , and. Raj, D. S, J. ChemPharm. Res., 2010, 2(5), 169-176.
- Yuksel, F. , Atilla, D. , Ahsen, V. , Polyhedron, 2007, 26, 4551-4556.
- Zentel, R., Benlia, M. , Liquid Crystals, 1987, 2(5), 651-664.
- Sie, T. H. , Yeap, G. , and. Boey, P. L, Aust. J. Basic Applied Sci. , 2009 , 3(4), 3417-3422.
- Sie, T. A. , M. Ng, Subramaniam, R. T. , Saito, M. Ito, A. , Watanabe, S. L. ,and Bonde, N. L. , International J. Physi. Sci., 2010 , 5(8), 1256-1262.
- Prajapati, A. , and Pandya ,H. J., Chem. Sci., 2005, 117(3), 255-261.
- Yeap, G. Y., Ha, S. , Lim, P. L., Boey, P. L. , and Itos ,M., Liquid crystals, 2006, 33(2), 205-211.
- Ha, S. T. , Ong, L. , Ong, J. P. , Yeap ,G., Lin, H., Ong, S. , and Koh, T., Phase transition, 2009, 82(5), 387-397.
- Yeap, G. Y. , Koh, W., Nakamura, Y., Cheng, Z. , Molecular Crystals Liquid Crystals, 2002, 381, 169-178.
- Gray, G. W. , Molecular Structure and the properties of liquid Crystals, Chapter 2, VIII Academic Press, London, (1962),.
- Belaidi, D., Sebih, S. , Bouda, S. , Guermouche, M. H. , and Bayle, J. P. , J. Chromatogr. A, 2005, 52, 1087.
- Benalia, M. , Badjah-hadj-ahmed, A. Y. , Djedid, M. , Meklati, B.Y. , and Al-Dujaili, A. H. ,J. Chromato., 2007, 66( 7-8), 565-570.
- Apreutesei, D. , Lisa, G., Hurduc, N.,and Scutaru, D., CEJC, 2004,vol. 2 (4), pp. 553.
- Apreutesei, D.,. Lisa, G, Scutaru, D. , and Hurduc, N., J. Optoelectronics Adv. Mater. , 2006; 8, 737.
- Conder, J. R. , and Young, C. L. , Physicochemical Measurements by Gas Chromatography, Wiley, Chichester,1979.
- Lloyd, D. R. , Ward, T. C. , and Schreiber, H. P. , Inverse Gas Chromatography-Characterization of Polymers and Other Materials, ACS Symposium Series No. 391, American Chemical Society (Eds.), Washington,(1989), DC, 230.
- Belgacem, M. N. , Gandini, A. , in: E. Pefferkorn (Ed.), Interfacial Phenomena in Chromatography, Marcel Dekker, New York, (1999), 41.
- Voelkel, A., in: Dabrowski, A. , V. A. Tertykh (Eds.) , Adsorption on New and Modified Inorganic, Elsevier, Amsterdam, (1999), 465.
- Thielmann, F. , J. Chromatogr. A, 2004, 115, 1037.
- Hegedus, C. R. , and Kamel, I. L. , J. Coat. Technol. , 1993, 65, 23.
- Kelker, H. , Z. Anal. Chem. , 1963, 198, 254.
- Blokhina, S. V. , Ol’khovich, M. V., Sharapova, A. V. ,and Borovkov, N. Y. , J. Phys. Chem. B., 2010, 144, 7703.
- Maeck, M. , Toaubet, A. , Hadj-Ahmed, A. Y. B. , and Meklati, B. Y. , Chromatographia, 1986, 22, 245.
- Littlewood, A. B. , Phillips, C. G., and D.T. Price, J. Chem. Soc. , 1955, 1480.
- Liao, H. L. ,and Martire, D. E. , Concurrent Solution and Adsorption Phenomena in Gas-Liquid Chromatographys, A Comparative Study, Anal. Chem., 1972, 44, 498-502.
- Oweimreen, G. A. , Lin, G. C. , and Martire, D. E. , Thermodynamics of Solutions with Liquid Crystal Solvents, 9. Gas-Liquid Chromatographic Study of Nonmesomomorphic Solutes in Nematic and Isotropic N-(p-Methoxybenzylidene)-p¢-n-butylaniline and p-n-pentyl- p¢-cyanobiphenyl, J. Phys. Chem., 1979,. 83, 2111-2119.
- Young, C. L., Physicochemical measurement by gas chromatography, Whiley-interscience, 1979, 632.
- James, A. T.,and Martin, A. J. P., J. Biochem, 1952, 50,. 679.
- Everett, D. H., Trans. Farad. Soc. , 1965, 61, 1637.
- Topphoff, M., Kiepe, J., and Gmehling, J. , Effects of Lithium Nitrate on the Vapor-Liquid Equilibria of Methyl Acetate + Methanol and Ethyl Acetate + Ethanol, J. Chem., Eng. Data, 2001, 46, 1333-1337.
- Martire, D. E. , and Pollara, L. Z. , Adv. Chromatogr. , 1966, 1, 335.
- Littlewood, A. B. , Gas Chromatography, 2rid exl. Academic Press ,(1970).
- Conder, J. R. , in Progress in Gas Chromatography, 209, J. H. PURNELL, Ed. Wiley-Interscience, (1971).
- Chow, L. C. , and Martire, D. E. , J. Phys. Chem. ,1971, 75, 2005.
- Ghodbane, S., Oweimreen, G. A. ,and Martire, D. E. , J. Chromatogr. , 1991, 556, 317.
- Jain, S. C. , Agnihotry, S. A. and Bhide, V. G. , Mol. Cryst. Liq. Cryst. , 1982, 88,. 281.
- Oweimreen, G. A. , and Al-Tawfiq, Ali M. , Thermodynamics of Solution of Nonmesomorphic Solutes at Infinite Dilution in the Isotropic and Nematic Phases of p-Cyanophenyl p-n-Alkylbenzoates, J. Chem. Eng. Data, 1997, 42, 996-1003.
- Gareth Price, J. , Simon Hickling, J. , and Shillcock, Ian M. , Applications of inverse gas chromatography in the study of liquid crystalline stationary phases, Journal of Chromatography A, 2002, 969, 193–205.
- Langer, S. H. , and Purnell, J. H. , J. Phys. Chem, 1963, 67, 263.
- Conder, J. R. , and Young, C. L. , Wiley, New York, (1978).
- Conder, J. R. , and Young, C. L. , Physicochemical Measurement by Gas Chromatography, Wiley, Chichester, (1979).
- Khalfi, A. Papirer, E., Balard, H., Barthel, H.,and. Heinemann, M. G , Characterization of Silylated silicas by inverse gas chromatography: Modelization of the Poly (dimethylsiloxane) monomer unit/surface interactions using Poly (dimethylsiloxane) oligomers as probes, J; Colloid and Interface Sci., 1996, 184, 586-593.
- Derek Gray, G. , Gas Chromatographic Measurements of Polymer Structure and Interactions, Pergamon Press, Printed in Great Britain , Prog. Polym. Sci, 1977., 5(1), 1-60.
- Price, G. J. ,and Shillcock, I. M. ,Canad., J. Chem. , 1995, 73, 1883.
- Oweimreen, G. A. , Thermodynamic Data for Nonmesomorphic Solutes at Infinite Dilution in the Nematic and Isotropic Phases of Hexylcyanobiphenyl, J. Solution Chem. , 1982, 11, 105-118.
- Oweimreen, G. A. ,and Shihab, A. K. , Thermodynamic Studies on Infinitely Dilute Solutions of Nonmesomorphic Solutes in Liquid Crystalline Solvents, J. Chem. Eng. Data, 1994, 39, 266-277.

This work is licensed under a Creative Commons Attribution 4.0 International License.
About The Author
![]()
A New Edition of Web of Science
Journal Impact Factor
2022: 0.5
Five Year: 0.8
Journal is Indexed in

Cabells Whitelist
![]()


