Liquid-Liquid Extraction-Chromogenic Systems Containing Iron(III), 4-Nitrocatechol and Tetrazolium Salts
Galya K. Toncheva, Teodora S. Stefanova and Kiril B. Gavazov*
University of Plovdiv “PaissiHilendarski”, 24 TzarAssen Str., BG-4000 Plovdiv, Bulgaria
DOI : http://dx.doi.org/10.13005/ojc/310137
Article Received on :
Article Accepted on :
Article Published : 13 Feb 2015
Complex formation and liquid-liquid extraction were studied in systems containing iron(III), 4-nitrocatechol (4NC),tetrazolium salt (TZS), water and organic solvent. Three different TZS were used: 3-(4,5-dimethyl-2-thiazol)-2,5-diphenyl-2H-tetrazolium bromide (MTT), 3-(2-naphtyl)-2,5-diphenyl-2H-tetrazolium chloride (Tetrazolium violet, TV) and 2-(4-iodophenyl)-3-(4-nitrophenyl)-5-phenyl-2H-tetrazolium chloride (INT).The cations of the first two TZSs (TZ+: MTT+ and TV+) form intensively colored (molar absorptivity of 4.6´104 L mol–1 cm–1 and 4.4´104 L mol–1 cm–1, respectively) chloroform extractable ion-associates with the FeIII-4NC anionic chelate. These ternary complexes can be represented with the following general formula: (TZ+)3[FeIII(4NC)3]3−.
KEYWORDS:iron(III); 4-nitrobenzene-1;2-diol; ion-association; ternary complex; solvent extraction
Download this article as:| Copy the following to cite this article: Toncheva G. K, Stefanova T. S, Gavazov K. B. Liquid-Liquid Extraction-Chromogenic Systems Containing Iron(III), 4-Nitrocatechol and Tetrazolium Salts. Orient J Chem 2015;31(1). |
| Copy the following to cite this URL: Toncheva G. K, Stefanova T. S, Gavazov K. B. Liquid-Liquid Extraction-Chromogenic Systems Containing Iron(III), 4-Nitrocatechol and Tetrazolium Salts. Orient J Chem 2015;31(1). Available from: http://www.orientjchem.org/?p=7196 |
Introduction
Iron is an important environmental and bio-element, which forms complexes with various catecholicligands (1-7). The complexation behaviour of Fe(III) towards the well-known analytical reagent 4-nitrobenzene-1,2-diol (4-nitrocatechol, 4NC) (8, 9) has been studied in connection with designing new chelators for treating iron overload (10, 11), nonheme iron-containing enzymes (12-14), surface chemistry (15), chemistry of the marine environment (16), stability assessment and comparative studies (17). The results (10, 17) have shown that three different complexes are formed in aqueous medium depending on pH and concentration of 4NC: [Fe(4NC)]+, [Fe(4NC)2]–, and [Fe(4NC)3]3–. The third one can readily participate in an ion-association process with the cation of 2,3,5-triphenyl-2H-tetrazolium chloride (TTC), producing a well chloroform extractable yellow-coloured ternary complex (18). Having in mind the conclusion (19) that some tetrazolium salts (TZSs) {e. g. 3-(4,5-dimethyl-2-thiazol)-2,5-diphenyl-2H-tetrazolium bromide (MTT), 3-(2-naphtyl)-2,5-diphenyl-2H-tetrazolium chloride (Tetrazolium violet, TV), and 2-(4-iodophenyl)-3-(4-nitrophenyl)-5-phenyl-2H-tetrazolium chloride (INT)} can be better than TTC as extraction-spectrophotometric reagents, especially when 4NC is used as a ligand (20-25), we set the goal to study the complex formation and liquid-liquid extraction in systems containing Fe(III), 4NC and each of the above mentioned TZSs.
Materials and Methods
A stock iron(III) solution (1 mg mL−1; 1 L) was prepared by dissolving 8.6350 g of FeNH4(SO4)2.12H2O in water containing 5 mL of conc. H2SO4(1, 18, 26).Working solutions (50 µg mL−1) were prepared every day by suitable dilution of the stock solution with 0.01 mol L−1 H2SO4. Aqueous solutions of the reagents were used: 4NC from Fluka (2´10–3mol L−1), MTT from Alfa Aesar (2.4´10–3mol L−1), TV from Sigma-Aldrich Chemie GmbH (3´10–3mol L−1), and INT from Appli Chem GmbH (2.0´10–3mol L−1). The chloroform was redistilled and used repeatedly. All other organic solvents were used as received from the supplier. The acidity of the aqueous medium was set by the addition of buffer solution, prepared by mixing 2 mol L−1 aqueous solutions of CH3COOH and NH4OH. The resulting pH was measured by a Hanna HI 83140 pH meter. A Camspec M 508 spectrophotometer (United Kingdom), equipped with 10 mm path-length cells, was employed for reading the absorbance.
Procedure for Establishing the Optimum Conditions
Aliquots of Fe(III) solution, 4NC solution (up to 1.6 mL), TZS solution (up to 2.5 mL) and buffer solution (3 mL; pH ranging from 3.5to 7.0) were introduced into 125-mL separatory funnels. The resulting solutions were diluted with distilled water to a total volume of 10 mL. Then 10 mL of organic solvent were added and the funnels were shaken for a fixed time (up to 5.0 min). A portion of each organic extract was transferred through a filter paper into a cell and the absorbance was read against a blank.
Procedure for Determining the Constants of Distribution
The distribution constant KD was found from the ratio KD = A1/(A3-A1) where A1 is the absorbance obtained after a single extraction (at the optimum operating conditions; Table 1) and A3 is the absorbance obtained after a triple extraction under the same conditions. The final volume of the solutions in both cases was 25 mL.
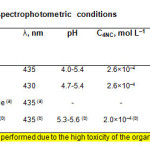 |
Table1: Optimum extraction-spectrophotometric conditions Click here to View table |
Results and Discussion
Choice of Organic Solvent
Various water-immiscible organic solvents were examined in our liquid-liquid extraction study: chloroform, 1,2-dichloroethane, n-butanol, n-pentanol, isoamyl alcohol, benzene, toluene, 5-methyl-2-hexanone, cyclohexane, ethyl acetate, and nitrobenzene. Chloroform was found to be the best extraction solvent when TZSs were MTT or TV. However, the mentioned solvent was inappropriate when TZS was INT. Among the tested solvents, only nitrobenzene was capable to extract this ternary complex. The high toxicity of nitrobenzene, along with the lack of evidence that INT can offer any special advantages over MTT/TV were reasons that led us to abandon further experiments on the Fe(III)-4NC-INT system.
Absorption Spectra in Chloroform
Spectra of chloroform extracts of the ternary complexes (curves 1-3) and blank samples (curves 1’-3’) are shown in Fig. 1. Curve 1 (TZS=MTT) and curve 2 (TZS=TV) were recorded at the optimum operating conditions. The complex with TV exhibits a maximum at 435 nm, where is the maximum of the Fe-4NC-TTC complex (18). The maximum of the Fe-4NC-MTT complex lies at 430 nm. By virtue of the thiazole group in MTT+, this salt has an additional absorption maximum in the visible range (l~380 nm) (19, 27) which overlaps significantly with the maximum of the anionic Fe-4NC chelate. This peculiarity can explain the highest molar absorptivity of the Fe-4NC-MTT complex {ε(Fe-4NC-MTT)=4.6´104 L mol–1 cm–1, ε( Fe-4NC-TV)=4.4´104 L mol–1 cm–1, and ε(Fe-4NC-TTC)=2.7´104 L mol–1 cm–1}as well as the small hyposchromic shift (5 nm) of the resultant maximum (curve 1).
Curve 3 (Fig. 1) shows a spectrum of the Fe-4NC-TV complex extracted under non-optimum conditions – higher pH and TV concentration. The maximum in this case appears at 500-510 nm due to a competitive equilibrium of formation of coloured ion-associate between the reagents (28).This salt-like compound, which governs the colour properties of the blank sample,eventually extinguishes the main peak of the complex at l~435 nm.
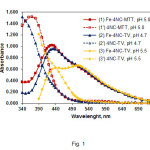 |
Figure1: Absorption spectra of extracted ternary complexes and blank samples. CFe(III)=2.24×10⁻⁵mol L–1 (curves 1-3); C4NC=2.6×10⁻⁴mol L–1, CMTT=3.0×10⁻⁴, pH 5.0 (curves 1,1’); C4NC=2.6×10⁻⁴mol L–1, CTV=3.6×10⁻⁴, pH 4.7 (curves 2, 2’); C4NC=2.0×10⁻⁴mol L–1, CTV=7.2×10⁻⁴mol L–1, pH 5.5 (curves 3,3’) Click here to View figure |
Effect of PH
The effect of pH on the Fe(III) extraction is shown in Fig. 2. The shape of the obtained curves is governed by two factors: (i) protonated 4NC (H2L, HL–) species (9, 10, 29) and cationic FeL+ species (10, 17) predominate at pH values lower than pHopt; (ii) hydrolysed Fe(III) species exert noticeable effects on the complex formation at pH values higher than pHopt(1, 30).
One can conclude, comparing the optimum pH intervals for extraction of the complexes of different TZSs (Table 1 and Fig. 2), that these intervals are shifted to the lower pH values with increase of the molar mass of TZ+ (MTT+=298.96, MMTT+=334.41, MTV+=349.41). This fact suggests that heavier TZ+ have a better ability to assist in the deprotonation of 4NC during the process of complex formation.
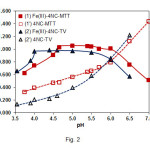 |
Figure2: Effect of pH on the absorbance of extracted ternary complexes and blank samples. CFe(III)=2.24×10⁻⁵mol L–1(curves 1 and 2); C4NC=2.6×10⁻⁴mol L–1, CMTT=3.0×10⁻⁴mol L–1, λ=430 nm (curves 1, 1’); C4NC=2.6×10⁻⁴mol L–1, CTV=3.6×10⁻⁴mol L–1, l=435 nm (curves 2, 2’) |
Effect of Reagents Concentration
The effect of 4NC and TZS concentrations on the absorbance is shown in Fig. 3. The optimum reagents concentrations deduced from this figure are shown in Table 1.
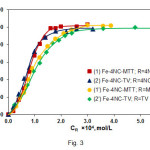 |
Figure3: Effect of the reagents concentrations on the absorbance of extracted ternary complexes. CFe(III) = 2.24×10⁻⁵mol L–1(curves 1, 1’, 2, 2’);CMTT = 3.0×10⁻⁴mol L–1, pH=4.7, l=430 nm (curve 1); C4NC = 2.6×10⁻⁴mol L–1, pH=5.0, λ=430 nm (curve 1’); CTV = 7.2×10⁻⁴mol L–1, pH=4.6, λ=435 nm (curve 2); C4NC = 2.6×10⁻⁴mol L–1, pH=4.7, λ=435 nm (curve 2’) Click here to View figure |
Effect of Shaking Time
The extraction equilibria for the systems with MTT and TV are reached for ca. 30 sec and 60 sec, respectively. Since longer shaking times had no effect on the absorbance (up to at least 340 sec), we extracted in our further experiments for 1.5-2 min.
Composition, Formulae and Equilibrium Constants
The molar TZS-to-Fe(III) and 4NC-to-Fe(III) ratios were determined from the experimental points presented in Fig. 3. Two different methods were used: the straight-line method of Asmus(31) and the mobile equilibrium method (32). The results suggested that 1:3:3 (Fe:4 NC:TZS) ternary complexes are formed; they could be represented with the general formula (TZ+)3[Fe(4NC)3]3–.
Several equilibrium processes should be taken into account for the system of [Fe(4NC)3]3–, TZ+, water and chloroform.
(i) Formation of ion-associates in the aqueous phase:
3TZ+ + [Fe(4NC)3]3–↔ (TZ+)3[Fe(4NC)3] (1)
(ii) Distribution of the ternary complexes between the aqueous and organic phase:
(TZ+)3[Fe(4NC)3]aq↔ (TZ+)3[Fe(4NC)3]org (2)
(iii) Extraction from water into chloroform:
3TZ+aq + [Fe(4NC)3]3–aq↔(TZ+)3[Fe(4NC)3]org (3)
The association constants b describing eq. 1 were determined by several independent methods: the Mobile equilibrium method (32), the Holme-Langmyhr method (33), and the Harvey-Manning method (34). The distribution constants KD describing eq. 2 were calculated from the absorption values obtained after single and triple extractions in equal final volumes. The extraction constants (Kex; eq. 3) and the recovery factors (R) were calculated by the formulae Log Kex=Log KD+Logβ and R%=KD×100/(KD+1), respectively. All experiments were performed at room temperature of ~22°C and the calculations were carried out at a probability of 95 %. The results are given in Table 2.
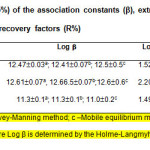 |
Table2: Calculated values (P=95%) of the association constants (β), extraction constants (Kex), distribution constants (KD), and recovery factors (R%) Click here to View table |
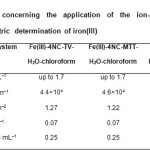 |
Table3: Characteristics concerning the application of the ion-association complexes for extractive-spectrophotometric determination of iron(III) Click here to View table |
Beer’s Law and Analytical Characteristics
The adherence to Beer’s law for each Fe(III)–4NC–TZS–water–chloroform system was examined under the optimum extraction-spectrophotometric conditions.Then the molar absorptivities, Sandell’s sensitivities, limits of detection and limits of quantification were calculated. The results are listed in Table 3. One can conclude that the couples 4NC-MTT and 4NC-TV ensure high sensitivity of determination. In this criterion, they are much better than the single TZSs used by Mehra and Katyal(35){e=2.2×10³ L mol–1 cm–1 (TZS=TTC or Neotetrazolium chloride), e=5.3×10³ L mol–1 cm–1 (TZS=MTT), and e=1.1×10⁴ L mol–1 cm–1 (TZS=INT)}, as well as the couple 4NC-TTC described in our previous paper (18).
Conclusion
The cations deriving from MTT, TV and INT were studied for the first time as components of extraction-chromogenic systems involving iron(III) and 4NC. The ternary ion-association complexes formed with MTT+or TV+are chloroform-extractable; they contain the intensively yellow-colored anion [Fe(4NC)3]3–.The calculated equilibrium constants and characteristics (constants of extraction, constants of association, constants of distribution, recovery factors, molar absorptivities, San dell’s sensitivities, limits of detection, and limits of quantification) show that the couples MTT-4NC and TV-4NC have a potential to be used in liquid-liquid extraction-spectrophotometric applications relating to iron(III).
Acknowledgments
The authors express their gratitude to the Research Fund of the University of Plovdiv “PaisiiHilendarski”.
References
- Tarafder, P. K.;Mondal, R. K. Amer.J. Anal. Chem.2012,3, 339-346
- Kawabata, T.;Schepkin, V.;Haramaki, N.;Phadke, R. S.; Packer L. Biochem. Pharmacol.1996,51,1569-1577
- Miethke, M.;Skerra, A. Antimicrob. Agents Chemother.2010,54, 1580-1589
- Menyo, M. S.; Hawker, C. J.; Waite J. H. Soft Matter2013, 9, 10314-10323
- Kamariotaki, M.;Karaliota, A.;Stabaki, D.;Bakas, T.;Perlepes, S.;Hadjiliadis, N. Transition Met. Chem. 1994, 19, 241-247
- Yadav, R.;Kikkeri, R. Chem. Commun.,2012, 48, 1704-1706
- Hider, R. C. Expert Opin. Ther. Pat. 1994,4, 931-940
- Sommer, L.; Ackermann, G.; Burns, D. T.;Savvin, S. B. Pure Appl. Chem.,1990, 62, 2147-2166
- Gavazov, K. B. ActaChim. Slov.,2012, 59, 1-17
- Nurchi, V. M.;Pivetta, T.;Lachowicz, J. I.;Crisponi, G. J. Inorg. Biochem.2009,103, 227-236
- Crisponi, G.;Remelli, M. Coord. Chem. Rev.2008,252, 1225-1240
- Skrzypczak-Jankun, E.;Borbulevych, O. Y.;Jankun, J. ActaCrystallogr. D,2004, 60, 613-615
- Spaapen, L. J. M.;Verhagen, J.;Veldink, G. A.;Vliegenthart, J. F. G.Biochim. Biophys.Acta1980,617, 132-140
- Tyson, C. A. J. Biolog. Chem.1975, 250, 1765-1770
- Vasudevan, D.; Stone A. T. J. Coll. Interf. Sci.1998, 202, 1-19
- Luther III, G. W.;Rozan, T. F.; Witter, A.; Lewis, B. Geoch. Trans.2001,9, 65
- Hakkinen, P. Finn. Chem. Lett.1984,3, 59-62.
- Gavazov, K.;Stefanova, T.;Toncheva G. J. Chem. Technol. Metall.2013,48, 642-648
- Gavazov, K. B.;Dimitrov, A. N.;Lekova V. D. Russ. Chem. Rev.2007, 76, 169-179
- Dimitrov, A.;Kostova S. Bulg. Chem. Ind.,1999, 70, 88-90
- Kostova, S.;Dimitrov, A.;Alexandrov, A. Chem. Pap.,2000, 54, 61-65
- Dimitrov, A.;Lekova, V.;Gavazov, K.;Boyanov, B. Cent. Eur. J. Chem., 2005, 3, 747-755
- Lekova, V.;Gavazov, K.;Dimitrov, A. Chem. Papers,2006, 60, 283-287
- Racheva, P.;Gavazov, K.;Lekova, V.;Dimitrov, A. J. Iranian Chem. Res. 2008, 1, 113-121
- Racheva, P. V.;Gavazov, K. B.;Lekova, V. D.;Dimitrov, A. N. J. Anal. Chem.2010, 65, 21-25
- MarczenkoZ. and M. Balcerzak, Separation, preconcentration and spectrophotometry in inorganic analysis, Vol. 10; Elsevier, Amsterdam – Lausanne – New York – Oxford – Shannon – Tokyo, (2000).
- SabnisR. W.,Handbook of biological dyes and stains: synthesis and industrial applications; Wiley, Hoboken,New Jersey, (2010).
- Gavazov, K. B.;Toncheva, G. K., J. Adv. Chem. 2013, 5, 641-651
- Cornard, J.-P.;Rasmiwetti; Merlin, J.-C. Chem. Phys.2005,309, 239-249
- Stefánsson, A. Environ. Sci. Technol. 2007, 41, 6117-6123
- Asmus, E. Fresenius’ J. Anal. Chem.1960, 178, 104-116
- Zhiming, Z.;Dongsten, M.;Cunxiao, Y. J. Rare Earths1997, 15, 216-219
- Holme, A.;Langmyhr, F. J. Anal. Chim.Acta, 1966, 36, 383-391
- Harvey, A. E.; Manning, D. L. J. Am. Chem. Soc. 1950, 72, 4488-4493
- Mehra, M. C.;Katyal, M. Bull.Environ.Contam.Toxicol.,1983, 30, 337-343

This work is licensed under a Creative Commons Attribution 4.0 International License.


