An Experimental Study of The Ionicity of Hgclbr
Rabia Ahmad, Qamer Faisal And Jamshed Ali
Chemistry Department, JMI, New Delhi - 110 025, India.
| Copy the following to cite this article: Ahmad R, Faisal Q, Ali J. An Experimental Study of The Ionicity of Hgclbr. Orient J Chem 2011;27(2). |
| Copy the following to cite this URL: Ahmad R, Faisal Q, Ali J. An Experimental Study of The Ionicity of Hgclbr. Available from: http://www.orientjchem.org/?p=24671 |
Introduction
It has been experimentally established that in a solid-solid capillary reaction between two reactants, at least one of which is fairly ionic having a small inorganic impurity mixed with these, the amount of the product formed, at a given time, is more for an impurity the molecule of which has a higher electric dipole moment compared to the case of an impurity the electric dipole moment of which is less. This amount of the impurity is taken such that, in each case, there are nearly same number of impurity molecules.
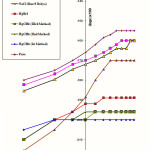
This is seen to be the case from Fig. 1 which presents a plot of (log10x) x102 vs. (log10t ) x 102, where x is the thickness of the product at time t after the start of the experiment for the system CuI-HgCl2.
 |
Figure 1: Kinetics of solid-solid reactions between Cul+HgCl2 with different inorganic solid impurities at 80oC |
The numerical data are given in Table 1. We see that the amount of the product, for a given time, depends monotonically on the electric moment of the impurity molecule. The electric dipole moment have been taken from ref. 1. This is in accordance with a plausible theory.
Table 1: Thickness of product layer with pure reactants and different Impurities (In increasing dipole moment order)
| Time |
Thickness of product layer (log10 x i )×102 |
|||||||
| (log10t i) | Pure | HgClBr | HgClBr | HgClBr | HgBrI | NaCl | NaI | KCl |
| ×102 | Reactants | Ist
method |
IInd
method |
IIIrd
method |
||||
|
– 60.2 – 30.1 -12.5 0.0 9.70 17.6 24.3 30.1 35.2 39.8 43.9 47.7
|
-215 -205 -196 -189 -180 -174 -170 -170 -170 -170 -170 -170 |
-205 -200 -200 -200 -200 -200 -200 -200 -200 -200 -200 -200 |
-210 -200 -200 -196 -196 -196 -196 -196 -196 -196 -196 -196
|
-210 -200 -200 -200 -196 -196 -196 -196 -196 -196 -196 -196 |
-210 -200 -196 -192 -192 -189 -189 -189 -189 -189 -189 -189 |
-185 -180 -174 -172 -170 -168 -166 -164 -164 -164 -160 -160 |
-182 -177 -172 -170 -168 -166 164 -162 -160 -160 160 -160 |
-180 -174 -170 -166 -162 -159 -157 -155 -155 -155 -155 -155 |
The curve for HgClBr, as prepared by three different methods and a curve for HgBrI are also shown in the figure. All these curves occur at the bottom of the figure well below the curve for the pure reactants. This goes to show that HgClBr as well as HgBrI have low ionicity. This is in accord with Pauling’s simple semi-empirical theory of ionicity2. Details may be presented elsewhere.
This was presented in Poster form at the International Conference held at IIT, Roorkee.
Acknowledgements
Thanks are due to the Ex-Head of the Department, Prof. Kishwar Saleem for extending to us the facilities of the Department. We are also thankful to Prof. Sharif Ahmad, Head Chemistry Deptt., Jamia Millia Islamia, New Delhi.
References
- Lide D.R., CRC handbook of Chemistry and Physics, CRC Press, 2002.
- Pauling L., The nature of the chemical bond, 3rd edition, Oxford & IBH Publishing Co, p.98.

This work is licensed under a Creative Commons Attribution 4.0 International License.


