Quantitative Identification of Muscle Tissue by Means of Biomarker Peptides by Using Method of Multiple Reaction Monitoring
Andrey Vladimirovich Kulikovskii, Natalya Leonidovna Vostrikova, Irina Mikhailovna Chernukha and Daniil Vladislavovich Khvostov
V.M. Gorbatov Federal Research Center for Food Systems of RAS, 109316, Talalikhina str. 26, Moscow, Russia.
DOI : http://dx.doi.org/10.13005/ojc/350411
Article Received on : 27-06-2019
Article Accepted on : 25-08-2019
Insufficient quality and replacement of raw meat for vegetable are quite urgent problems. This is due to the expansion of rights and the emergence of new meat processing enterprises. The manufacturer may use vegetable protein, new unregistered feed additives. This paper presents the LC-MS method for detecting and quantifying two different types of meat (beef and pork) in a biological matrix of structureless minced meat. After isolating the proteins and digesting them with trypsin, species-specific peptide markers were selected for each animal species for quantitative determination. High-performance liquid chromatography (HPLC) Agilent 1260 with triple quadrupole mass spectrometer detector 6410 was provided for ease of usage and improve veracity of the analysis. This analysis used three stable peptides for the quantitative determination of two putative muscle biomarkers for pork and beef in minced meat with a 25-minute analysis. Good sensitivity was established (LOD 0.23–0.29%) with the ability to quantify the muscle tissue of each animal species (LOQ 0.70–0.86%) using special calibration curves.
KEYWORDS:Biomarker; HPLC/MS; prototypical peptides; species identification
Download this article as:| Copy the following to cite this article: Kulikovskii A. V, Vostrikova N. L, Chernukha I. M, Khvostov D. V. Quantitative Identification of Muscle Tissue by Means of Biomarker Peptides by Using Method of Multiple Reaction Monitoring. Orient J Chem 2019;35(4). |
| Copy the following to cite this URL: Kulikovskii A. V, Vostrikova N. L, Chernukha I. M, Khvostov D. V. Quantitative Identification of Muscle Tissue by Means of Biomarker Peptides by Using Method of Multiple Reaction Monitoring. Orient J Chem 2019;35(4). Available from: http://www.orientjchem.org/?p=59384 |
Introduction
In our days, the control of components of finished products is part of food quality assessment. The most difficult task is to determine the amount of the muscle-proteins in meat products with plural components that have undergone high temperature treatment. Consequently, in practice, when determining the quality of foodstuffs, it becomes necessary to establish its actual proportion in food products with the declared regulatory papers. At present, the isolation of biomarkers of various components is a hopeful area of research in the field of determining the composition of finished foodstuffs. For that reason, it is significant to develop an analytical method for identifying biochemical modifications in raw food resources under the influence of technological factors by using modern research techniques.
Recently, a new method of identifying specific molecular indicators within the same species is growing fast, created on a combination of two high effective methods in the food analysis area: LC in combination with MS are widely used in peptides detection. The relative quantitative determination of proteins specific to meat species, without labels, is achieved by detecting marker peptides resulting from process in which enzymes facilitate the cleavage of bonds in molecules with the addition of the elements of water. The association of LC-MS detection and non-gel fractionation made it possible to detect signs of chicken meat with high confidence in the mixtures from meat with a very meager percentage (0.4%) [1]. In later studies using this method, even a small amount (1.2%) of chicken, beef, duck, pork and goose could be found in boiled meat products [2]. Due to the participation of non-gel fractionation, certain peptides for cattle derived from the light chain of myosin 1 and 2 can be identified. In raw or/and cooked meat mixes 0.4% of buffalo meat can be found [3]. LC / MS identification of subjects of study was confirmed more effective results in determination the source in foodstuffs subjected to high temperature treatment or acid-base extraction than PCR and ELISA. For example, in the occasion of gelatin, pigment and peptides of bovine collagen can be detected in the range from 0.4 to 1.2% of pollution [4].
The aim of the work was to develop a fast, highly specific and reliable method for the identification and quantitative determination of the variety of species. The methodology covers two main types of animals used as raw meat, which are of the greatest interest.
Materials and Methods
Preparation of muscle samples of pork and beef for trypsin lysis.
On an analytical balance, a mixture of beef and pork meat was weighed at the rate of the total weight of 2000 mg. The percentages in the obtained samples were: 100% and 0%, 75% and 25%, 50% and 50%, 25% and 75%, 5% and 95%, 0% and 100% beef and pork mince, respectively. In each case, samples weighing 50 mg were diluted by adding 500 μl of sodium deoxycholate 10%, bicarbonate 25 mM ammonium and ground in a mortar until complete dissolution [5]. Samples of denatured muscle tissue were centrifuged at maximum speed for 15 min at 4°C, 10 μl samples were taken in 1.5 ml tubes. 2 μl of 100 mM DTT (Dithiothreitol) was added, heated for 20 min to 80°C. Addition of 1.0 μl of 500 mM iodoacetamide and incubated for 30 min at 37°C in the dark place samples were alkylated. The resulting mixture was diluted to a volume of 95 μl (50 mM ammonium bicarbonate). Trypsin was added to the samples at a substrate ratio of 50: 1: enzyme (10.5 ± L 0.4 mg / ml in 50 mM ammonium bicarbonate). Trypsin digestion took place for 16 hours at 37 °C. All buffers were prepared with ddH20 and filtered (0.22 μm).
The reaction was stopped by adding formic acid to obtain a final concentration of formic acid to 0.5%. After the samples were centrifuged (10 min; 3000g; 19°С) to precipitate sodium deoxycholate. The supernatant was transferred to analytical vials for analysis. The concentration of muscle tissue was 10 μg / μl.
HPLC-MS analysis of muscle tissue samples.
For chromatographic separation, the HPLC system Agilent 1260 Infinity II was used with a reverse phase column (50 mm × 2.1 mm, Eclipse Plus C18 Agilent with a fast resolution, 2.7 μm in size). The sample inlet volume is 10 µl, the temperature of the temperature control unit is 30°C.
Agilent MassHunter (Agilent B.04.00) quantitative analysis software was used to processed MRM data. All peaks that were automatically integrated, were by hand confirmed to guarantee the truthful detection and precise integration. A regression equation for all calibration curves was calculated to reduce a dynamic variety [6]. All markers were primarily identified using three pairs of MPM ions to check the retention time and ensure that there is no signal interference.
Results and Discussion
Selection of biomarkers of pork and beef muscle tissue.
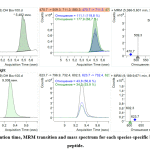
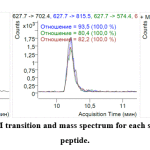
In this work, a potential myoglobin of cow (Bos taurus) and pig (Sus scrofa) was selected as a potential muscle marker. These proteins from different animals are different peptides of the same protein. The results obtained primarily include the choice of specific peptide markers that are the product of proteolytic digestion with trypsin, and do not include amino acids that are subject to chemical modification. Second, these peptides are used to establish the optimal parameters for MRM registration. Both proteins were represented by peptides with a chain length of more than six amino acids (Table 1, Figure 1).
Table 1: Mass spectrometer settings, sequence biomarkers for two target proteins.
|
Protein (Species) |
Peptide |
Product ions (m/z) |
CE (V) |
|
Myoglobin (Bos taurus) |
YLEFISDAIIHVLHAK |
796.94 |
17.7 |
|
732.42 |
17.7 | ||
| 602.34 |
17.7 |
||
|
NDMAAQYK |
711.34 |
15.6 | |
| 580.31 |
15.6 |
||
|
509.27 |
15.6 |
||
|
Myoglobin (Sus scrofa) |
YLEFISEAIIQVLQSK | 815.49 | 17.8 |
|
702.41 |
17.8 |
||
| 574.35 |
17.8 |
The optimized MRM parameters for 3 peptides with indication of the parent and daughter ions, the stresses in the collision cell, which make the best generation of each fragment ion, are presented in Table 1.
The choice of MRM transitions for each parent ion.
To choose the best representative MRM ion pair for each marker and incorporate MRM into the terminal multiplexed technique, the three most intensive ion pairs (established by direct analysis of sample introduction) were verified under HPLC-MS analysis. All three ionic MRM transitions for each marker were used to verify identity characteristics. This also made it possible to determine their respective retention times (Figure 1, 2).
 |
Figure 1: Retention time, MRM transition and mass spectrum for each species-specific beef myoglobin peptide. Click here to view figure |
 |
Figure 2: Retention time, MRM transition and mass spectrum for each species-specific pork myoglobin peptide. Click here to view figure |
To take full advantage of the analyte ability and throughput of this MRM multiplexing technique, concentrated on reducing the number of used ion pairs. An attempt was made to select ion pairs of MRMs that did not contain matrix interference from co-eluting ions. In our analyzes, along with a watchful choice of three certain criteria (m/z precursor ion, m/z fragment ion and retention time), we are approaching the maximum allowable specificity of ion pairs used in the analysis.
Linear response and quantification limit (LOQ) 3-peptide MRM analysis.
Since, as has been shown, an increase in analytical variations in MR analysis correlates with a decrease in the intensity of the ion fragment [7], the final method was the most common, empirically revealed, interference transition for each target marker. Using the tested MRM method, the analytical parameters of the analysis were evaluated. Acceptance criteria, such as linearity and analytical accuracy, were identified for the analysis. This made it possible to compare the results of MRM analysis and in the future may be of particular interest in identifying proteins in industrial products.
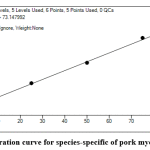
Calibration curves (Figure 3) cover the entire concentration range of HPLC-MS analyzes. After identification, the indicator peptides for different species studied were analyzed to determine the lower border of detection (LOD) and quantify the technique (LOQ).
 |
Figure 3: Calibration curve for species-specific of pork myoglobin peptide. Click here to view figure |
The purpose of this stage of the study was the quantitative determination of different kind of meat (in % w/w) demonstrated in the model mixtures. To determine the LOQ, the lowest concentration on the calibration curve was selected, which for five measurements gave a signal with a relative error of 15%. According to the results of LOQ is 5% muscle tissue in the stuffing for all peptides.
The true value of the analyte was compared with the average values of the obtained results (using at least five replications), the accuracy of the analytical method was determined. The value obtained in this way should not exceed 20% of the standard value taken as true. All calibration points that go beyond 80% to 120% were consistently excluded from the regression analysis. Accordingly, the concentration of the marker peptide was reached, which corresponded as closely as possible to the true value.
The admirable linearity for beef was established, followed by pork (Table 2). The linear dynamic variety for the three markers assays varied from 100% muscle tissue to 5% mixed with another kind of meat for both pork and beef. The limits of detection of species in model samples, calculated as a percentage of its total number, were in the range of 0.23–0.29%. The borders of quantification, evaluate as a proportion of the whole amount of meat, were in the variety from 0.70 to 0.86%.
Table 2: Calibration curves, detection limits and quantification for different types of meat.
|
Meat species |
Peptide | Line equation | R2 | LOD (%) |
LOQ (%) |
|
Beef |
YLEFISDAIIHVLHAK | y = 1314.94* x + 3544.25 | R2=0.989 | 0.23 | 0.70 |
| NDMAAQYK | y = 8276.64 * x + 23568.42 | R2=0.986 | 0.29 |
0.86 |
|
|
Pork |
YLEFISEAIIQVLQSK |
y = 157.26 * x + 73.15 |
R2=0.998 |
0.25 |
0.76 |
All peptides showed very high sensitivity at threshold below 1.0%. However, it is necessary to take into account that, with the addition of low concentrations of 1-3% (low percentage of added meats), increases the percentage of errors. For higher values (a higher percentage of added meat) accuracy improves.
Conclusion
Because of the work carried out, a unified methodological approach was developed to the quantitative determination the amount of muscle protein biomarkers in foodstuffs from meat using the MRM method using a protein-confirming marker. This methodology is presented in the work on the example of skeletal muscle of beef and pork, but it is applicable to any type of muscle of any kind of warm-blooded animal. Proteomic strategies are one of the main steps to obtaining high quality animal products [8-9].
From the conducted research it follows that the use of proteomic technologies along with the acquisition of new knowledge about muscle proteins opens the way to the creation of new effective methods for monitoring the quality of meat products, including, in particular, determining the content of muscle proteins in final products and their species.
Acknowledgments
The work was supported by the Russian Science Foundation, project no. 16-16- 10073.
References
- Sentandreu, M.A.; Fraser, P.D.; Halket, J.; Patel, R.; Bramley, P.M. of Proteome Res., 2010, 9, 3374–3383.
- Montowska, M.; Fornal, E. Food Chemistry, 2017, 237 (15), 1092–1100.
- Naveena, B.M.; Jagadeesh, D.S.; Babu, A. J.; Rao, T. M.; Kamuni, V.; Vaithiyanathan, S. Food Chemistry, 2017, 233, 311-320.
- Grundy, H.H.; Reece, P.; Buckley, M.; Solazzo, C.M.; Dowle, A.A.; Ashford, D. Food Chemistry, 2016, 190, 276-284.
- Proc, J.L.; Kuzyk, M.A.; Hardie, D.B.; Yang, J.; Smith, D.S.; Jackson, A.M.; Parker, C.E.; Borchers, C.H. of Proteome Res., 2010, 9, 5422–5437.
- Chace, D.H.; Barr, J.R.; Duncan, M.W.; Matern, D.; Morris, M.R.; Palmer-Toy, D.E. Wayne, Pennsylvania, USA, 2006, 27(4), 242–253.
- Kuzyk, M.A.; Smith, D.; Yang, J.; Cross, T.J.; Jackson, A.M.; Hardie, D.B.; Anderson, N.L.; Borchers, C.H. Cell. Proteomics, 2009, 8, 1860–1877.
- Vostrikova, N.L.; Chernukha, I.M. Foods and Raw Materials, 2018, 6(1), 201–209.
- Vostrikova, N.L.; Chernukha, I.M.; Khvostov, D.V. Theory and practice of meat processing, 2018, 3(3), 36-55.

This work is licensed under a Creative Commons Attribution 4.0 International License.


