High Performance of Phenol Adsorption using Iron Based SBA-15 Synthesized by Loading-Microwave Method
Yuvita Eka Pertiwi and Maria Ulfa
Chemistry Education Study Program, Faculty of Teacher Training and Education, Sebelas Maret University, Jl. Ir. Sutami 36A Surakarta, Central Java-57126, Indonesia.
Corresponding Author E-mail: ulfa.maria2015@gmail.com
DOI : http://dx.doi.org/10.13005/ojc/350314
Article Received on : 25-04-2019
Article Accepted on : 03-06-2019
Article Published : 20 Jun 2019
The iron based mesoporous silica (Fe2O3/SBA-15) was studied for the first time for adsorption of phenol as a model adsorbate compound. The structural and textural properties of the synthesized samples were characterized by means of X-Ray Diffraction, Transmission Electron Microscopy, FTIR and element analysis techniques by Energy Dispersive X-Ray (EDX). The result of XRD analysis showed that mesoporous SBA-15 silica molecular sieves which modified with Fe2O3has a hexagonal structure with a pore size is 4.90 nm and iron contents (25.27%) were found on the surface of the Fe2O3/mesoporous silica SBA-15. While the FTIR analysis showed that Fe2O3/SBA-15 had functional group of assymetric Si-O-Si and Fe-O-Si which was found at 1085 cm-1 and 678 cm-1, respectively. Adsorption performance of Fe2O3/SBA-15 material investigated by phenol compounds as adsorbate model. The optimum contact time is 60 minutes and the Kinetics model of the mesoporous SBA-15 silica molecular sieves modified Fe2O3 can adsorb phenol compounds following the Kinetics Model Ho and McKay. The result optimum adsorption capacity occuring in the adsorption of phenol compounds by of the mesoporous SBA-15 silica molecular sieves modified Fe2O3 is 114.000 mg/g.
KEYWORDS:Adsorption; Fe2O3/SBA-15; Phenol Compounds; Silica Mesoporous
Download this article as:| Copy the following to cite this article: Pertiwi Y. E, Ulfa M. High Performance of Phenol Adsorption using Iron Based SBA-15 Synthesized by Loading-Microwave Method. Orient J Chem 2019;35(3). |
| Copy the following to cite this URL: Pertiwi Y. E, Ulfa M. High Performance of Phenol Adsorption using Iron Based SBA-15 Synthesized by Loading-Microwave Method. Orient J Chem 2019;35(3). Available from: https://bit.ly/31F5wxb |
Introduction
Phenol compounds and their derivatives have been widely utilized in a number of activities such as, chemical industry,1 petroleum refining,2 conversion of coal dyes and pesticides in agriculture.3 Phenols are classified as harmful pollutants because they are toxic to organisms even at low concentrations. Given the high toxicity and poor biodegradability, phenol needs to be eliminated before the liquid waste is released into the body of water. Various processes have been used in the removal of phenols from aqueous media, including membrane filtration,4 biological degradation, electrochemical oxidation, catalytic photo oxidation and adsorption.5 Among these methods, adsorption is most widely used because it is effective to removes many pollutants and the process is simple. The use of non-microporous material as phenol adsorbent is rarely used,which will be a consideration in this study, so that there will be an alternative material in reducing pollutants in the water.
Since the discovery of mesoporous silica materials in the 1990s, the synthesis and application of mesoporous solids have received intensive attention due to its highly ordered structure, larger pore size, and high surface area.6 There are several mesopore adsorbents that have been used to adsorp phenol compounds, among others Activated Carbon (AC), Wood Chorcoal (WC) has an adsorption capacity of 98% and 90%7. In the previous research with adsorbent MCM-41 and zeolite obtained adsorption capacity of 71,2% and 80%.8–9 The SBA-15 material is a meso-silica solid (2 – 50 nm) that provides greater access to absorb water-phenol molecules, making them suitable for adsorbing the phenol in the water. The SBA-15 silica characteristic is inert, has a very ordered structure, large pore size (range of 4-30 nm), large specific surface area (> 1000 m2g-1), thick frame wall, high thermal stability and size that can be controlled easily.10 The porosity and regularity of the SBA-15 structure qualify as a material capable of adsorbing phenol effectively and efficiently.
In the use of SBA-15 silica adsorbent, there is difficult in separating the adsorbate. Therefore, a substitution is needed, or a metal that can assist the separation process. Characteristics of a metal that can help the separation process is a highly magnetic metal. The magnetic properties are generally owned by transitional group elements (Ti, Cr, Mn, Cu, Co, Fe, Ni). The transition group elements have high magnetic properties due to the presence of free electron bond in their d orbital, causing magnetic properties stronger. The effective metal used to assist the separation process is Ferrum (Fe) from Fe(NO3)3 which is a ferromagnetic transition class element. Fe are used to substitute, due to high magnetic properties, and they have high separation power so that the adsorption capacity can increase.
Based on the description above, in a study article on the mesoporous silica material SBA-15 (Fe2O3 / SBA-15) with Fe as a lead metal for adsorption of phenol molecules. Fe2O3/SBA-15 is synthesized by a wet impregnation method with a combination of ultrasonication and microwave processes. The structural and textural properties of the synthesized samples will be investigated using XRD, FTIR, TEM, BET and EDX. Then the calculation of the absorption of phenol compounds by Fe2O3/SBA-15 was carried out to determine the first order adsorption kinetic model according to Lagergren and pseudo second order adsorption kinetics according to Ho and McKay.
Experimental
Materials
SBA-15 (pore diameter 7-9 nm, surface area 560 m2/g, pore size 8 nm, pore volume 1.0 cm3/g and the pore morphology is hexagonal) merk six c materia (China supplier), HCl (Merck, 37%), and Fe(NO3)3.9H2O obtained from Sigma-Aldrich is a hygroscopic crystalline solid with a molecular weight of 404 g / mol. Phenol 200 mg/L-1 for the adsorption stage using deionized water and Phenol GR 108-95-2 with molar mass 94.11 g/mol are used as adsorbate model.
Preparation of Fe2O3/SBA-15
The activation of SBA-15 have been done with immersion in HCl 0.1M for 24 h, then dried at 100˚C for 48 h. This aims to eliminated impurities that are still attached and acids effects can affect the performance of SBA-15. Solution Fe(NO3)3 was prepared by Fe(NO3)3.9H2O obtained from Sigma-Aldrich as a precursor ion iron oxide. Fe2O3/SBA-15 activated as adsorbent was mad by mixed in solution Fe(NO3)3 1 M and stirred for 2 h 250 rpm at 25°C. The result were dried in oven for 24 h at 100°C. Ultrasonication with a hot plate and magnetic stirrer for 24 h at 50˚C then microwaved (frequency 2.45 GHz and wavelength 12.25 cm) for 30 min at high temperature. Energy source for microwave is magnetron. At a frequency 2.45 GHz, magnetron is capable of producing power between 500-2000 W.11 The solution then calcined at 750˚C for 6 h.12
Characterization of Fe2O3/SBA-15
Adsorbents are studied by several characterization techniques to identify structural and physiochemical properties. The adsorbent crystal form was identified by X-ray diffraction (Rigaku Multiflex 2 kW) conducted in the Geological Engineering Laboratory, Gadjah Mada University, Yogyakarta. The samples were scanned at a 2θ diffraction angle which small angle starts from 2-5° and a wide angle starts from 10-80°. Fourier Transform Infrared Analysis with (Shimadzu Corp. Prestige-21) at the Laboratory of the Faculty of Mathematics and Natural Sciences, Sebelas Maret University was conducted to identify functional groups associated with the adsorbent. The elements in the samples were calculated using EDX TSL Ametek with detector type: Sdd Apollo X and resolution:127.89. TEM identified the morphology of mesoporous silica and mesoporous silica embedded with iron oxide in Chemistry Laboratory, Faculty of Mathematic and Natural Sciences Gadjah Mada University. BET SBA-15 and Fe2O3/SBA-15 to identified surface area, volume, and pore diameter were analyzed using Quantacrome Nova 1200. For morphology of Fe2O3/SBA-15 was observed under transmission electron microscope.
Adsorption of phenol on Fe2O3/SBA-15
Adsorption experiments have been done with batch mode performed in the sample bottle. The standard solution prepared with diluted phenol in deionized water, where in the amount of the adsorbent in a fixed quantity of 0.0055 g is added to the phenol solution at a concentration of 200 mgL-1. An adsorbent has stirer with speed 125 rpm, time balance set 24 hours. Every sample was taken each of 1 mL per time variation using a syringe. Finnaly, phenol concentrations was analyzed by UV (UV-2550, Shimadzu) spectroscopy at max λ 270 nm13. Each experiment is duplicated under the same conditions. The adsorbate absorption at equilibrium, qe (mmol / g), is calculated by the following equation:
![]()
Where C0 and Ce are initial concentrations and phenol equilibrium (mmol/L) in solution; V is the phenol solution volume (L) and m is the weight of the adsorbent Fe2O3/SBA-15 (g). The experiments were carried out at 25°C, the samples separated within 24 hours of variation.
The adsorption capacity were analized by Legergren and Ho and McKay models. The Lagergren an Ho and McKay kinetic models are described by equation (2) and (3) respectively:

With qe is the equilibrium adsorption capacity (mg/g), qt is the adsorption capacity at time t (mg/g), k is the Lagergren rate constant (min-1), k2 is the Ho and McKay rate constant (g/mg.min) and t is contact time (min).
Results and Discussion
SBA-15 and Fe2O3/SBA-15 X-ray diffraction patterns are shown in Figure 1a using an X-ray diffractometer at 4˚/min scan speed, 10-80 tetha angle. SBA-15 shows two different peaks on reflection (1 0 4) and (1 1 0) showing similar mesoporous structures such as SBA-15. A wide diffraction peak was found at 30–35◦ in all patterns that was attributed to amorphous silica. The peaks of Fe2O3 were undetected at a high scanning angle, indicating that Fe2O3 nanoparticles were well dispersed in SBA-15.14 While the typical Fe peak on XRD shows the presence of hematite (Fe2O3) reinforced by EDX element distribution data (Figure 3).
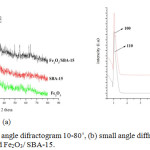 |
Figure 1: (a) large angle difractogram 10-80˚, (b) small angle diffractogram of Fe, SBA-15 and Fe2O3/ SBA-15. |
Based the X-ray diffraction results, the graph overlaps in the range of 2θ 1-1.5ᶱ between Fe2O3/SBA-15 and SBA-15 (Fig 1b) which indicates that the addition of iron oxide to SBA-15 silica does not affect much of the crystal structure of SBA-15. In addition to the diffractogram a slight peak shift indicates an increase in the distance between the crystal plane and the unit cell parameters. In the study there was a partial change of Si by Fe on Fe2O3/SBA-15 adsorbent. In addition to the corresponding peaks of the SBA-15, another peak corresponding to iron oxide a hematite at 2θ (not shown in fig). Small peaks associated with iron oxide indicate that no significant iron oxide crystalline phase is present outside the SBA-15 pore structure.15
Table 1: The BET characterization results of SBA-15 and Fe2O3/SBA-15.
|
Sampel |
LBET (m2g-1) |
LBJH (m2g-1) |
VBJH (cc g–1) |
DBJH (nm) |
|
SBA-15 |
556 |
515 |
1,02 |
8,76 |
|
Fe2O3/SBA-15 |
470 |
401 |
0,87 |
6,50 |
In Table 1 shows that the surface area of SBA-15 and Fe2O3/SBA-15 based on BET analysis decreased 470 m2g-1 to 556 m2g-1. While the surface area by BJH of SBA-15 and Fe2O3/SBA-15 decreased 401 m2g-1 to 515 m2g-1. It also happens in the pore volume of SBA-15 and Fe2O3/SBA-15 is 0.87 cc g–1 to 1.02 cc g–1. It shows that pore diameter decreased 8.70 nm to 6.50 nm. The decrease in surface area and pore diameter, probably caused by filling of the pores with small iron particles, indicates successful iron oxide doping within the mesoporous silica of SBA-15.16 The other reason came to the wet impregnation process that can be a stimulant for the blocking pore.
Based on Figure 2 shows that the isotherm adsorption graph on SBA-15, and Fe2O3/SBA-15 isotherm are of type IV by showing a hysteresis loop as defined by IUPAC classification. The hysteresis loop shows that Fe2O3/SBA-15 is a cylindrical and mesopore-sized material.
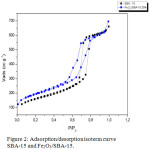 |
Figure 2: Adsorption/desorption isoterm curve SBA-15 and Fe2O3/SBA-15. |
Sharp position shift from relative pressure (P / Po) which is 0.6 to 0.8 is a pore diameter characteristic in the range of mesoporous material.17 This is also supported by research from Montiel-Palacios (2009) which states that Fe metal loading on the mesoporous surface of SBA-15 silica causes a decrease in SBA-15 surface area. Pressure variations are set relative to standard pressure, that is (P / Po) through computer control with ranges (P / Po) from 0.05 to 0.995. While Vads vs P / Po relationship is formed because, the higher pressure that more nitrogen gas will be advertised by solids. Relationships will both be plotted automatically as Vads vs. P / Po graphs.18

Vads: adsorbed volume; Vliq: liquid volume; Pa: Ambient Pressure; Vm: molten gas liquid volume; R: 82.056 cm3. atm/mol.K; T: Temperature
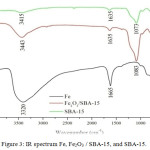 |
Figure 3: IR spectrum Fe, Fe2O3 / SBA-15, and SBA-15. |
Based on the results of the SBA-15 IR spectra shows the presence of Si-O-Si group at 1073 cm-1, Si-O group bonded by Si-OH at 969 cm-1,19 there is a peak at 3415 cm-1 indicating the presence of clusters OH of a water molecule estimated to be still contained in the SBA-15 material. The IR spectral image of Fe2O3/SBA-15 shows the sharp intensity of the asymmetry vibration of the Si-O group of Si-O-Si siloxane ie at 1083.01 cm-1 and Fe-O-Si waves at wavenumber 678.01 cm-1. Peak width at 3443,08 cm-1 represents the vibration of O-H strain from H2O and Si-OH.20 This is reinforced by the band of 1635.71 cm-1 wave numbers indicating the buckling vibrations of both H2O and Si-OH. The image of the Fe2O3 IR spectrum shows the Fe-O-Fe group at 863 cm-1, Fe-O group at 495 cm-1. This is supported by the study of Zhang et al. (2016) which shows that the spectra with higher instensity at the 650 cm-1 wavenumber is the bond that occurs between Fe and O. The peak width at 3320 cm-1 represents the OH vibration of Fe2O3 which may be caused by the presence of a silanol group or an OH group of adsorbed water molecules.
Based on the results of FTIR analysis showing Fe-O-Si group on Fe2O3/SBA-15 adsorbent at wavelength of 678.01 cm-1 indicates that iron oxide has been successfully dispersed on the SBA-15 silica mesoporous material. In addition, it is shown also by the friction shift that causes the change of SBA-15 1073 cm-1 intensity to 1083 cm-1.
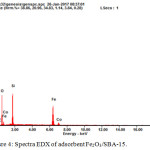 |
Figure 4: Spectra EDX of adsorbent Fe2O3/SBA-15. |
EDX quantification results of SBA-15 mesoporous silica containing iron units (Fe2O3 / SBA-15).
Table 2 presents the EDX profile of Fe2O3/SBA-15. Fe content on Fe2O3/ SBA-15 adsorbent is 25.47 at%. The EDX spectra of Fe loaded with SBA-15 shows the presence of Fe in particles of 25 wt%. Fe loaded on SBA-15 indicates that the impregnation process has proceeded well shown by the total constituent material. These EDX results confirm FTIR and XRD data.
Based on table 2 presents the EDX profile of Fe2O3/SBA-15. Based on the graph above, it shows that Fe2O3 has been impregnated on the SBA-15 wall of ± 25%. This is in line with what was expected in this study where the mass of iron oxide impregnated to SBA-15 was as much as 25%. In the adsorption of Fe2O3/SBA-15 contained several elements, with a percentage of atomic volume (At%) C of (02.80%), O (46.82%), Si (24.71%), Co (00.40% ), and Fe (25.27%).
Table 2: Profile EDX of adsorbent Fe2O3/SBA-15.
|
Element |
Wt % |
At % |
|
C |
01.16 |
02.80 |
|
O |
25.73 |
46.82 |
|
Si |
23.84 |
24.71 |
|
Fe |
48.47 |
25.27 |
|
Co |
00.80 |
00.40 |
Based on the Figure 5, the results of TEM analysis at a magnification of 20 nm showed that iron oxide was successfully distributed on the surface of the SBA-15. This is indicated by the number of black circles in the image that indicate the presence of iron oxide found on the surface of the SBA-15 mesoporous silica. These results are supported by FTIR, XRD, EDX and BET data which indicate that iron oxide has been successfully doped on the SBA-15. Modification of silica mesoporous material SBA-15 with Fe does not change the uniformity of the original inorganic pore walls of hexagonal SBA-15.21
Based on the results of material characterization tests of SBA-15 and Fe2O3/SBA-15 25% showed interrelated data. In the XRD results there are peaks of SBA-15, Fe2O3, and Fe2O3/SBA-15. Where the peaks are used to determine the structure of Fe2O3/SBA-15 material which is hexagonal. These results are supported by FTIR data, which based on FTIR data shows the peak of Si-O-Si and Fe-O-Si groups. Where the results show that there is Si replacement by Fe. The results of the BET characterization test and TEM showed the same results. Where in the BET results there is a decrease in pore diameter (although in the area and volume area there is an increase) which indicates that the dopping process was successfully carried out. This is supported by TEM data, which based on the image at 20 nm magnification shows even black circles showing 25% iron oxide on the surface of SBA-15. This is supported by EDX data, where there are Si, Fe, and O groups which shows that the Fe2O3 dopping process has been successfully carried out on the SBA-15.
Figure 5 shows the phenol adsorption performance of Fe2O3/SBA-15 when adsorbed phenol solution by conducted in isothermal condition at the room constant temperature. The time influence during phenol solution adsorption on Fe2O3/SBA-15 to adsorption capacity of sample are shown in Fig. 6. The adsorption of phenol solution affected by the time contacts where the longer contact adsorbents will give the capacity of adsorption increases.
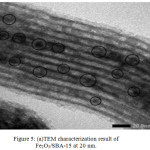 |
Figure 5: (a)TEM characterization result of Fe2O3/SBA-15 at 20 nm. |
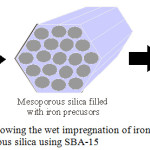 |
Figure 5: (b) A schematic showing the wet impregnation of iron based mesoporous silica using SBA-15. |
The results indicate the optimum adsorption at the time of 60 min. contacting between Fe2O3/SBA-15 as adsorbents and phenol solution as adsorbate has reached equilibrium and evidenced by the adsorption capacity of samples end to be constant after 60 minutes. This is due to the adsorption time of 60 min, Fe2O3/SBA-15 still active and not saturated yet by phenol compounds.
In this research, the equation of pseudofirst- order by Lagergren (2) and the pseudo secondorder by Ho and McKay (3) use as model of adsorption kinetic of the Fe2O3/SBA-15. The equation of both model desribed by follow section.

Where qe (mg/g) is the amount of phenol compounds adsorben upon reaching equilibrum, qt (mg/g) is the amount of phenol compounds adsorben at various times t (min.), (min-1) and k2 (g(mg/min)-1) are the rate constants of the the pseudo-first-order and the pseudo-second-order adsorption kinetic. In Table 3. It shows that the adsorption curve of phenol compounds on Fe2O3/SBA-15 suitable and follows the adsorption kinetics of the Ho and McKay Model because it has a higher linearity level than the Lagergren Model.
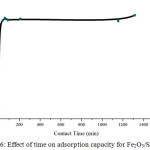 |
Figure 6: Effect of time on adsorption capacity for Fe2O3/SBA-15. |
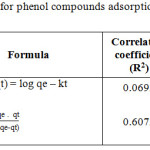 |
Table 3: Kinetics parameter for phenol compounds adsorption onto Fe2O3/SBA-15. |
Thus from the results of kinetics adsorption data test using kinetika equation model above by Adsorption Kinetics Model Ho and McKay has a linearity level of 0.6072, whereas according to Lagergren Adsorption Kinetics Model has a linearity level of 0.0692. It can be concluded that the adsorption pattern of phenol compounds in Fe2O3/SBA-15 is suitable and follows the adsorption kinetics of Ho and McKay Model with optimum adsorption capacity of 114 mg/g and the reaction rate constant rate of 0.8293 min-1.
Conclusions
The silica mesoporous material Fe2O3/SBA-15 has a regular structure with a pore size of 6.50 nm and there is a Fe content of 25.47% on the surface of silica mesoporous material Fe2O3/SBA-15. The silica mesopore material Fe2O3/SBA-15 can adsorb phenol compounds with the optimum contact time of Fe2O3/SBA-15 adsorption against phenol compounds is 60 minutes. The kinetic model of Fe2O3/SBA-15 against phenol compounds follows the Ho and McKay models. The optimum adsorption capacity of silica mesoporous material Fe2O3/SBA-15 in adsorbing phenol compounds was 114 mg/g.
Acknowledgements
Authors thanks the Directorat General of High Education (DIKTI), Indonesia, for the financial support through a Post Doctoral Research 2019 scheme grant with number contract of grant 718/UN27.21/PN/2019 (DIKTI Number Contract 092/SP2H/LT/DRPM/2019).
References
- Sabio, E.; Gonz, M. L. Influence of the Regeneration Temperature on the Phenols Adsorption on Activated Carbon. J. Colloid Interface Sci. 2001, 35, 31–35.
- Da̧browski, A.; Podkościelny, P.; Hubicki, Z.; Barczak, M. Adsorption of phenolic compounds by activated carbon – A critical review. J. Chemosph. 2005, 58, 1049–1070.
- Liu, Q.-S.; Zheng, T.; Wang, P.; Jiang, J.-P.; Li, N. Adsorption isotherm, kinetic and mechanism studies of some substituted phenols on activated carbon fibers. Chem. Eng. J. 2010, 157, 348–356.
- Rzeszutek, K.; Chow, A. Extraction of phenols using polyurethane membrane. J. Talanta. 1998, 46, 507–519.
- Hubicki, Z.; Barczak, M. Adsorption of phenolic compounds by activated carbon — a critical review. Journal of Chemosphere . 2005, 58, 1049–1070.
- Wang, S. Microporous and Mesoporous Materials Ordered mesoporous materials for drug delivery. Microporous Mesoporous Mater. 2009, 117, 1–9.
- Mukherjee, S.; Kumar, S.; Misra, A. K.; Fan, M. Removal of phenols from water environment by activated carbon, bagasse ash and wood charcoal. Chem. Eng. J. 2007, 129, 133–142.
- Mangrulkar, P. A.; Kamble, S. P.; Meshram, J.; Rayalu, S. S. Adsorption of phenol and o-chlorophenol by mesoporous MCM-41. J. Hazard. Mater. 2008, 160, 414–421.
- Khalid, M.; Joly, G.; Renaud, A.; Magnoux, P. Removal of Phenol from Water by Adsorption Using Zeolites. Ind. Eng. Chem. Res. 2004, 43, 5275–5280.
- Kruk, M.; Jaroniec*, M.; And, C. H. K.; Ryoo, R. Characterization of the Porous Structure of SBA-15. J. Chem. Mater. 2000, 12, 1961–1968.
- Taylor, L. A.; Meek, T. T. Microwave Sintering of Lunar Soil: Properties, Theory, and Practice. J. Aerosp. Eng. 2005, 18, 188–196.
- Shukla, P.; Wang, S.; Sun, H.; Ang, H. M.; Tade, M. Adsorption and heterogeneous advanced oxidation of phenolic contaminants using Fe loaded mesoporous SBA-15 and H2O2. Chem. Eng. J. 2010, 164, 255–260.
- Hamdaoui, O.; Naffrechoux, E. Modeling of adsorption isotherms of phenol and chlorophenols onto granular activated carbon Part I . Two-parameter models and equations allowing determination of thermodynamic parameters. J. Hazard. Mater. 2007, 147, 381–394.
- Wang, P. F.; Jin, H X.; Chen, M.; Jin, D F.; Hong, B.; Ge, H L.; Gong, J.; Peng, X L.; Yang, H.; Liu, Z Y.; Wang, X Q.Microstructure and Magnetic Properties of Highly Ordered SBA-15 Nanocomposites Modified with Fe2O3 and Co3O4 Nanoparticles. J. Nanomater. 2012, 2012, 21–23.
- Amama, P. B.; Lim, S.; Ciuparu, D.; Pfefferle, L.; Haller, G. L. Hydrothermal synthesis of MCM-41 using different ratios of colloidal and soluble silica. Microporous Mesoporous Mater. 2005, 81, 191–200.
- Mirji, S. A.; Halligudi, S. B.; Sawant, D. P. Adsorption of octadecyltrichlorosilane on mesoporous SBA-15. Appl. Surf. Sci. 2006, 252, 4097–4103.
- Li, X.; Zeng, G M.; Huang, J H.;Zhang, D M.; Shi, L J.; He, S B.; Ruan, M. Simultaneous removal of cadmium ions and phenol with MEUF using SDS and mixed surfactants. J. Desalin. 2011, 276, 136–141.
- Sudarlin. Prinsip dan Teknik Penggunaan Gas Sorption Analyzer (GSA). Prinsip dan Tek. Pengguna. Gas Sorption Anal. 2012, 1–9.
- Borodko, Y.; Iii, J. W. A.; Marti, G. E.; Song, H.; Niesz, K. Structure Sensitivity of Vibrational Spectra of Mesoporous Silica SBA-15 and Pt / SBA-15. J. Phys. Chem. B . 2005, 109, No 37, 17386–17390.
- Amaria. Adsorpsi Ion Sianida dalam Larutan Menggunakan Adsorben Hibrida Aminopropil Silika Gel dari Sekam Padi Terimpregnasi Aluminium. Jur. Kim. FMIPA Univ. Negeri Surabaya . 2012, 19, 56–65.
- Hartmann, M.; Vinu, A. Mechanical stability and porosity analysis of large-pore SBA-15 mesoporous molecular sieves by mercury porosimetry and organics adsorption. J. Langmuir . 2002, 18, 8010–8016.

This work is licensed under a Creative Commons Attribution 4.0 International License.


