Complexation of Trace Metal Ions by Ligands Anchored to Gold Surfaces Different than by Ligands Dissolved in Homogeneous Solutions
Abdunnaser M. Etorki, Elfituri E. Elhamassi and Ali Elhamassi
Department of Chemistry, University of Al-Fateh, P.O. Box-13203 Tripoli, (Libya).
While the homogenous binding of metal ions by a wide range of organic and inorganic ligands has been studied using numerous methods and comprehensive data of the homogenous association constants are available for many metal ions, ligands and solvent systems, complied data involving heterogeneous binding by surface bound ligands do not exist. Only few methods have been developed and applied for studding and determining the heterogeneous stability constants of trace metal ions by organic ligands contain mercapto, amino, amide and carboxylate groups. We wish to report on new approaches for the determination of the heterogeneous binding constants of trace metal ions by ligands anchored to the gold surfaces. Yet, in order to extract reliable and meaningful thermodynamic values it is crucial that the interfaces be well-defined and homogenous otherwise the surface heterogeneous will allow extracting only the average of the thermodynamic values. Thiols and dithols, which have been the subject of intensive research and characterization during last two decades, appear to provide this prerequisite. Functionalized thiols have been used quite thoroughly for selectively interacting and extracting metal ions. Three different methods have been developed and include IR spectroscopy, electrochemical impedance spectroscopy (EIS) and scanning electrochemical microscopy (SEM). Here we will use other new technique, the electrochemical quartz crystal nanobalance (EQCN). The EQCN, which is based on monitoring the mass of a metal ion (ng) bound to the ligand, is sensitive to changes in the total mass of the monolayer on gold electrode as a result of metal ion binding.
KEYWORDS:Thiols; Trace metal ions; Auartz crystal microbalance; XPS; adsorption isotherm; Surface complexation; Heterogeneous binding constant
Download this article as:| Copy the following to cite this article: Etorki A. M, Elfituri E, Elhamassi E, Elhamassi A. Complexation of Trace Metal Ions by Ligands Anchored to Gold Surfaces Different than by Ligands Dissolved in Homogeneous Solutions. Orient J Chem 2011;27(3). |
| Copy the following to cite this URL: Etorki A. M, Elfituri E, Elhamassi E, Elhamassi A. Complexation of Trace Metal Ions by Ligands Anchored to Gold Surfaces Different than by Ligands Dissolved in Homogeneous Solutions. Orient J Chem 2011;27(3). Available from: http://www.orientjchem.org/?p=24401 |
Introduction
The homogenous binding constants of metal ions to a wide range of organic ligands have been studied intensively using numerous methods, such as potentiometry, polarography, absorption spectroscopy, conductivity, etc. Comprehensive and compiled data that encompass many metal ions, ligands, and solvents are available [1].These data allow the comparison of different systems and assist in designing new ligands for practical applications, such as sensors and heavy-metal remediation systems. Yet, in many instances, the interaction between metal ions and organic ligands occurs at an interface, where the ligands are not free to diffuse and are arranged in either 2 or 3D assemblies.
Examples of such configurations can be found in many natural systems (e.g., membranes and minerals) as well as in artificial systems used in catalysis, selective ion exchangers, liquid chromatography, etc. Evidently, the decrease in the degree of freedom of the ligands that characterizes heterogeneous systems is expected to have a significant impact on the association of metal ions. Moreover, it might well be that the heterogeneous binding will be significantly different than that found in homogeneous systems. Compiled data, which involve heterogeneous binding, are scarce. Furthermore, only very few methods have been developed and applied to determine the heterogeneous stability constants of metal ions attached to organic ligands [2,3,4,5].Functionalized Thiols have been used quite intensively for selectively interacting and extracting metal ions [6,7,8,9].
We have shown that the functional groups at the monolayer/electrolyte interface can introduce the selectivity element required in electrochemical sensing [10]. Reinhoudt et al [11], reported on the interaction between crown ether based SAMs and alkali metal studied by impedance spectroscopy.
Adnan.et.al,[12]also studied similar systems. These systems involving the association of cations by SAMs, which has been treated mathematically as a means of evaluating the heterogeneous association constant, was the deprotonation of o-mercaptoalkanoic acid monolayers.
Here, we aim to take the above treatment one step further and use the same considerations for studying the heterogeneous binding of aromatic thiols to Cu(II). Thiols containing p electron rich aromatic may prove interesting. However, investigations of only a few such systems have been reported, including co-adsorption of short aromatic thiols along with alkane thiols and the influence of a polar aromatic group present in the middle of the aliphatic chain of alkane thiol. It has been found that thiols with fused aromatic rings can form compact and impervious monolayers despite the absence of a long methylene group.
We studied the binding a range of concentrations of copper ions to 4-acetomidothiophenol (AMTP). The mathematical isotherm assuming that a 1:1 complex is formed between an AMTP and Cu(II). The formation of a 1:2 complex between Cu(II) and AMTP can be excluded at higher concentrations of copper ions. The model allows a derivation of the heterogeneous binding constant under certain conditions. The mathematical treatment is supported experimentally by measuring the frequency shift of the electrochemical quartz crystal nanobalance (EQCN) of AMTP, first at different pH values and then at different Cu(II) concentrations (and a constant pH). Our results indicate that the heterogeneous association constant of Cu(II) to a 4-acetomidothiophenol is similar to that reported in homogenous solutions [1,13].
The Electrochemical Quartz Crystal Nanobalance (EQCN) technique can be used to detect low amounts of biological or chemical substances via mass accumulation; this therefore, represents a promising transducing mechanism for sensors [14].
The use of EQCN transducer offers an in-situ sensitive detection without the need for optical or redox indicators. This technique is based on the simple relation between the frequency shift (Δf) of the quartz crystal resonator and changes of its mass per unit surface area (Δm), which is given by the Sauerbrey equation:

where A is the piezoelectrically active area (cm2), rq is the density of the quartz (2.648 g cm-3 )and Vq is the acoustic velocity of quartz (3.34x 105 cm s-1)., f0 the fundamental oscillation frequency of the dry crystal and Δm is the mass of the material adsorbed on the surface per unit/area. Some factors can influence the oscillation frequency, like the thickness, the density and the shear modulus of the quartz that are constant, and the physical parameters of the adjacent media (density or viscosity of liquid). As differences in viscosity between running buffer and sample (like millipore water for AMBP SAM deposition, it is important to separate each frequency variation signal.
The quartz crystal employed in this study was commercially available, they are AT-cut type (diameter 25.1 mm) with Au electrodes on both sides (12.25 mm; 6.25 mm diameter; 0.26 cm2 area) and the resonance frequency was equal to 10 MHz.
Experimental
Materials
The following materials were obtained as indicated: 4-acetomidothiophenol (90%) is obtained from Sigma-Aldrich (England), Cd(NO3)2, Pb(NO3)2, Cu(NO3)2 were obtained from Merck. The Millipore water with specific resistance 18.2 MΩ.cm-1 was employed during all experiments. All solutions are degassed before use.
Passivation of the crystal surface
A typical EQCN experiment begins with the cleaning of the crystal surface with a piranha solution (30% H2O2 and 70% concentration H2SO4). After being rinsed with deionised water, the crystal was dried over a stream of N2 gas. An UV-cleaning process for 5 minutes was used to scavenge hydrocarbons adsorbates. Next, the crystal was mounted in the EQCN and impedance cell for reference measurements with flow-injection pump. After that, the crystal was rinsed another time, and soaked in a 1 mM 4-acetomidothiophenol solution (dissolved in ethanol) over night. The crystal was then, rinsed with ethanol and mounted onto the EQCN and impedance cell for measurement with the same injection rate.
Acoustic wave measurements
The EQCN cell and instrumentation have been described in detail elsewhere [12]. Frequency measurements were routinely made relative to a reference crystal and at least once in each series an absolute measurement was made to ensure the direction of frequency change was known unambiguously; in both cases, these measurements were made with a Hewlett Packard 5313A universal counter. The quartz crystal was sealed to the glass cell using Dow Corning 3145 RTV silicon rubber adhesive. Quartz crystal impedance measurements were carried out across a frequency range close to resonance quartz crystal using a Hewlett Packard HP8751A network analyser.
XPS characterization
XPS analyses of the adsorbed heavy metal ions on the AMTP SAMs were carried out on a Scienta ESCA 300 photoelectron spectrometer at the NCESS Facility, CCLRC Daresbury Laboratory with an AlKα X-ray source (1486.71 eV of photons) to determine the adsorption of metal ions on the modified gold electrode. The X-ray source was run at a reduced power of 350 W, and the pressure was run at a reduced power of 350W, and the pressure in the analysis chamber was maintained at less than 10−8 Torr during each measurement. Although internal calibration to the Au 4f7/2 line at 84.0 eV was used to compensate for sample charging. XPS samples were prepared analogously to EQCN samples, except that the substrate was an Au film (with a Cr binder layer) deposited on a glass microscope slide, cut into ca. 2.0 x 2.0 cm2 squares.
All binding energies were referenced to the neutral C 1s peak at 285.0 eV to compensate for the surface-charging effects.The sub-peaks were de-convoluted using a curve-fitting method from a series of Gauss–Lorentzian curves.
Results and Discussion
Electrochemical characterization of the 4-acetomidothiophenol
Figure 1 shows the cyclic voltammogram of the fresh gold electrode before and after thiol. There are two processes which take place, one in positive bias (oxidation of gold surface) and the second one in a negative bias (reduction of gold surface). The oxidation reaction at the interface has been reduced after thiol deposition and no reduction takes place. This confirms the high insulating properties of the thin layer of thiol to prevent the oxydo-reduction of the gold surface. The percentage of the coverage area can be estimated with impedance spectroscopy with [Fe(CN)6 ]3-/4- redox couple. The frequency shifts for SAM formation after 24 h exposure to AMTP SAM solution were Df =219 Hz for the emersed crystal and 190 Hz for the immersed crystal. Application of Eq. (1) which corresponded to a surface coverage: 2.72 nmol cm-2 and 3.30 nmol cm-2, respectively.
The impedance spectra of the crystal substrate before and after the deposition of the thiol monolayer are represented in Figure 2. The impedance spectra should be fitted using the model equivalent circuit presented in Figure 1. The capacitance C2 is the double layer capacitance of the gold/electrolyte interface, R1 is the charge transfer resistance in the low frequency range and Z(W) is the impedance due to the mass transfer of the redox species to the electrode described by Warburg. The resistance in the high frequency range R0 is the resistance of the electrolyte, the contacts and connections. The results of frequency shift for the immobilization of SAM on emersed and immersed crystals from 1mM of modification solutions indicate that SAM of AMTP has been successfully immobilized on gold electrode.
Binding of Cu2+, Pb2+ or Cd2+ to 4-acetomidothiophenol SAMs
In this stage a serious of Cu(II) concentrations from 10mM to 10mM at pH= 5.4 was bound to the surface of 4-acetomidothiophenol. The results of frequency shifts for each concentration of Cu(II) was bound to the monolayer are shown in the Figure3.
You can see form these graphs again the uptake of Cu(II) from aqueous solutions to the surface of the monolayer is increase with increase the concentration of Cu(II) in solution until attained to the plateau state at higher concentrations of Cu(II). All these adsorption isotherms were conducted in triplicate to check for the reproducibility and the relation between surface coverage of the ligand and binding different concentrations of copper ions from aqueous solutions. All Cu(II) ions present in solution could interact with the binding sites of the ligand and thus the percentage sorption were higher than those at higher initial Cu(II) ion concentrations. At higher concentrations, lower sorption yield is due to the saturation of sorption sites.
Adsorption Isotherms
Several models have been published in the literature to describe experimental data of sorption isotherms [15,16]. The Langmuir and Frumkin models are the most frequently employed models. In this work, both models were used to describe the relationship between the sorbed amount of Cu(II) and its equilibrium concentration in solution.
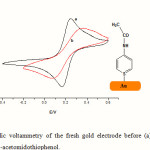 |
Figure 1: Cyclic voltammetry of the fresh gold electrode before (a) and after (b) deposition of 4-acetomidothiophenol. |
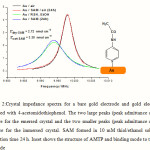 |
Figure 2:Crystal impedance spectra for a bare gold electrode and gold electrode modified with 4-acetomidothiophenol. The two large peaks (peak admittance ca. 4.5 mS) are for the emersed crystal and the two smaller peaks (peak admittance ca. 2.5 mS) are for the immersed crystal. SAM formed in 10 mM thiol/ethanol solution; adsorption time 24 h. Inset shows the structure of AMTP and binding mode to the Au electrode |
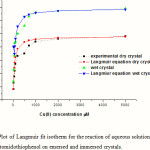 |
Figure 3: Plot of Langmuir fit isotherm for the reaction of aqueous solutions of Cu(II) with 4-acetomidothiophenol on emersed and immersed crystals. |
The binding capability of the surface-bound 4-acetomidothiophenol towards copper ions was quantified via the binding constant, K. To determine this, we need to fit the data to a model isotherm. The fractional coverage (q) at any solution concentration (c) of the complexed ion was estimated gravimetrically as the ratio of the frequency change (Df) at that concentration to the frequency shift (Dfω) observed at high concentration, i.e. the plateau value; in both cases, the frequency changes are referred to the value observed when the SAM was exposed to pure water.
Langmuir isotherm [16] is represented by the following equation:
1/q = 1 + 1/KC (2)
The linear plot of (1/q) versus 1/C shows that sorption follows a Langmuir isotherm (Figure 4).Values of K and C were calculated. The applicability of the Langmuir isotherm suggests the monolayer coverage of the Cu(II) sorption onto AMTP.
To determine if the Cu(II) sorption process by AMTP is favorable or unfavorable for the Langmuir type sorption process, the isotherm shape can be classified by a term “RL”, a dimensionless constant separation factor, which is defined below:

where RL is a dimensionless separation factor and b is Langmuir constant (L/mol-1). The parameter RL indicates the shape of the isotherm accordingly: RL > 1 unfavorable; RL = 1, linear; 0<RL < 1, favorable; RL = 0, irreversible. The calculating of RL value as 0.08 indicated that sorption of Cu(II) on AMTP was favorable at initial Cu(II) concentration at 25 ◦C and pH 6.
The Frumkin isotherm [15] was also applied for the Cu(II) removal by sorption. Frumkin isotherm model is given by the following equation:
fq = ln[(1 – q)/Cq] + lnK (4)
where K is the heterogeneous binding constant, f is the interaction constant, being indicative of the sorption capacity and intensity of sorption. Values of K and f were calculated from the intercept and slope of the plots of ln[(1 – q)/Cq] versus q. Representative data for binding Cu2+ to 4-acetomidothiophenol plotted according to the Langmuir and Frumkin isotherms are shown in Figure 4. The Frumkin isotherm model resulted in the best fit to the experimental data; the highest R2 values as well as the lowest standard error as listed for the emersed and immersed crystals. The same experimental isotherms for the Cd2+ and Pb2+ were done using the same procedures. The estimated equilibrium binding constants was listed in table 1. From this analysis (and replicates), the mean values (from three independent adsorption isotherms) of K were found to be 2.5 (±1.2) × 106 mol-1 dm3 for emersed crystals and 3.1 (±0.7) × 106 mol-1dm3 for immersed crystals: these values are not significantly different, suggesting that the interpretation of in situ frequency responses is not complicated by physicochemical processes beyond the simple complexation reaction postulated. Further support for this comes from the stoichiometry, as follows. Conversion of the plateau value (high concentration regime) of the frequency shift to a surface concentration of metal ions allows determination of the mole ratio between Cu2+ and SAM. On the plateau of the isotherm, we find Cu2+: AMTP = 1.35(±0.02) for emersed crystals and 1.40 (±0.05) for immersed crystals.
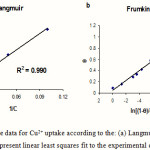 |
Figure 4: Plots of the data for Cu2+ uptake according to the: (a) Langmuir and (b) Frumkin isotherms. Lines represent linear least squares fit to the experimental data (points). |
Table 1: Summary of gravimetrically determined adsorption constants for uptake of metal ions by AMTP SAM.
| Log (K /mol-1/dm3) | |||
| Crystal environment | Cu2+ | Pb2+ | Cd2+ |
| Emersed crystal | 6.4±0.7 | 5.2±0.2 | 5.6±0.3 |
| Immersed crystal | 6.5±0.3 | 5.3±0.6 | 5.4±0.4 |
Values derived from Dfdry (emersed crystal) and Dfwet (immersed crystal) data (3 replicates), as described in main text.
The interaction factor obtained for AMTP / Cu2+ from Frumkin isotherm was ca. −0.06, which is quite close to zero. This value generally predicts that there is no a remarkable concentration dependent attraction or repulsions between SAM and Cu2+, resulting in almost no influence over the thermodynamics of their adsorption. The sign of f indicates the presence of a repulsive or attractive force upon adsorption. This can be interpreted as an initially large electrostatic attraction to the surface from the negatively charged deprotonated AMTP and a decreasing attraction due to neutralization of the surface charge by the positive metal ions. From the adsorption heterogeneous binding constant K, the adsorption free energy DGo can be determined according to Eq. (6) DGo = −RT lnK (6)
The DGo values obtained (average of the immersed and emersed data) from each K range from −36.9 to −38.0 kJ/mol for AMTP SAMs with Cu2+, Cd2+ and Pb2+. It is interesting to note that the DGo value for this system is in good agreement with that (−37.03 kJ/mol) for gold electrodes modified with azobenzenecarboxamydoethylthiol with different metal ions [17]. The DGo value can give insight into the chemical process of monolayer formation. There are two significant interactions leading to monolayer formation: one is the strong chemisorption forming gold–thiolate bond and the other is the aromatic interchain interaction. The magnitude of DGo value we measure greatly depends upon these interaction energies making contribution to thermodynamic stability of monolayer. The relative contribution of the interchain interaction to the total free energy of adsorption would be much smaller than that of the chemisorptive interaction. All characterise copper ion binding to the ligand as chemisorption and the adsorption of Cu(II) ions on AMTP SAM is spontaneous in nature.
Analogous interpretation of the Pb2+ and Cd2+ isotherms leads to equilibrium constants and Gibbs energies of their complexation by surface-bound AMTP. The outcomes are summarised in Table1, along with the Cu2+ value for comparison. In interpreting the Pb2+ and Cd2+ data, we have taken the plateau values as representing ‘‘full’’ coverage, although this is clearly significantly below the 1:1 stoichiometry seen for Cu2+; at very high concentration of these metal ions in solution we do not see the additional binding found for Cu2+. From the binding constants, the implied selectivity of AMTP for Cu2+ over Pb2+ and Cd2+ is about a factor of 10.
Representing the binding constants determined above in the conventional logarithmic form, logK values for surface-bound 4-acetomidothiophenol and solution Cu2+, Pb2+ and Cd2+, respectively, are 6.7, 5.3 and 5.4. Literature values for some closely related: acetoacetamido-3-methyl benzene/Cu2+,logK= 6.0, [13], N-phenyl acetoacetanilide acid/Cu2+, logK = 5.9, [18].
These data show that although the surface-bound ligand does not have the same overwhelming selectivity as its solution analog, probably due to geometrical constraints, it is still sufficient to be of practical utility. The adsorption binding constants for Cd2+ and Pb2+ are similar because for the behaviour of adsorption isotherms exhibit similar adsorption rate and similar uptaking by the ligand.
XPS Results
XPS provides a sensitive means of characterizing the chemical composition of the surface layer by following the photoelectron bands of carbon, sulphur, oxygen nitrogen and copper ions (in at.%) of the layer to be calculated. The results obtained are presented in Table 2. Apart from the presence of sulfur (the finding of sulfur confirmed that the immobilization had been effective). The nature of the chemical interaction between the copper ions and AMTP can be deduced from the Cu(2p) features. Representative example is shown in Figure 5, including best fits, which required either one or two doublets. The peaks with binding energies at 935 eV are related to Cu(II) species. Figure 5 shows a wide scan spectrum for the SAM after adsorbed copper ions. The detailed spectrum of the Cu region is given in Figure 5. The binding energy of Cu2p3/2 is 935 eV and the kinetic energy of copper Auger line Cu(L3VV) is 918.1 eV, corresponding to Cu(II) state [19], thus excluding the presence of Cu(II). The concentration of Cu(II) shows an insignificant increase with the increasing number of layers. The thickness of the copper-terminated layers was estimated by using the attenuation of Au 4f peaks. If the data fitted to linear regression, we find a straight line with a slope of 0.8 nm and a y-intercept of 1.2 nm, which corresponds to the thickness of a monolayer.
Table 2: Summary of the XPS results for the binding Cu(II) to AMTP SAM on gold electrode.
| Name | Area (cps) | Sensitivity | Conc. (%) |
| C 1s | 4568 | 1.0000 | 72.51 |
| O 1s | 2355 | 2.8000 | 13.35 |
| N 1s | 1600 | 1.7300 | 8.26 |
| S2p1/2 | 552 | 2.0800 | 4.22 |
| Cu 2p3/2 | 1749 | 16.7300 | 1.66 |
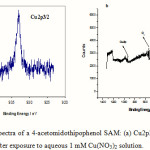 |
Figure 5: XPS spectra of a 4-acetomidothipophenol SAM: (a) Cu2p3/2 and (b) wide scan spectrum; after exposure to aqueous 1 mM Cu(NO3)2 solution. |
Conclusion
The heterogeneous binding constant of Cu(II) ions to a self-assembled monolayer of 4-acetomidothiophenol was determined by means of frequency shift of the EQCN measurements. The experimental results can be fitted using a relatively Langmiur and Frumkin model. The thermodynamic parameters such as DGo and interaction repulsion constant between metal ions and a self-assembled monolayer were also studied. Interestingly, we find that the binding constant is significantly affected by the monolayer and is many orders of magnitude higher than that obtained inhomogeneous solutions. This dramatic difference is presumably due to two major factors, namely, to a reduced degree of freedom and a higher charge density at the monolayer–electrolyte interface. This has interesting and important implications to the way monolayers have to be designed as a means of selectively extracting and interacting with metal ions.
References
- Sillen.L.G and Martell.E, (1971) Stability constants of metal ion complexes, The Chemical Society, London, UK.
- Azcurra, A.I, Yudi.L.M and Baruzzi. A.M, J. Electroanal. Chem 560: 35 (2003).
- Brzozowska. Z and Figaszewski. A, Biophys. Chem, 95:173 (2002).
- Ju.H.X and Leech.D, J. Electroanal. Chem, 484:150 (2000).
- Ruphino.Z , James. K.D and Victor Patrick. Y. G, Talanta, 61:837 (2003).
- Plehnert. R, Schroter. J.A and Tschierske.C, Langmuir, 14:5245 (1998).
- Tsukube. H, Talanta, 40:1313 (1993).
- Yujun. Y and Soo. K.B, Sensors and Actuators B, 97:221 (2004).
- Yagi. K, Khoo.S.B, Sugawara. M, Sakaki. T, Shinkai. S, Odashima.M and Umezawa. K.Y, J. Electroanal. Chem, 401:65 (1996).
- Turyan. I and Mandler. D, (1997), Anal. Chem., 69:894 (1997).
- Reinhoudt.I, Gödel’s. Matthew.L and Michelle. W, Chem. Rev. 104:2723 (2004).
- Asma.T.I, Adnane.A, Salwa.H and Mhamed .M, Sensors,4:105 (2004).
- Martell. E and Smith. R.M, Critical Stability Constants, Vol. 3, Other Organic Ligands, Plenum Press, New York,411-430 (1979).
- Burshtain. D and Mandler. D, ChemPhysChem, 5:1532 (2004).
- Chun.J.H, Ra.K.H and Kim.N.Y, J.Electrochem.Soc, 149, 9:325 (2002).
- Masel. R.I, Principles of Adsorption and Reaction on Solid Surfaces, Joh Wiley and Sons, New York,.1300-1340 (1996).
- Doron.B and Mandler. D, Phys.Chem.Chem.Phys, 8:118 (2006).
- Perrin. G.D, Stability constants of Metal Ion Complexes, Part B. Organic Ligands,Oxford, Pergamon, 205-240 (1979).
- Smith. E.L, Alves. C.A, Anderegg. J. W and Porter. M.D, Langmuir,8:2707(1992)

This work is licensed under a Creative Commons Attribution 4.0 International License.


